Can Manure Application Offset Tillage Impact on Soil Health Metrics in Organic Systems?

Purpose

Organic farming systems rely on internal, biologically mediated processes that can provide plants essential nutrients and suppress pests and disease. While reliance on soil biology to produce healthy plants is at the heart of the soil health concept, little research has been conducted in certified organic systems. Organic growers in Idaho and elsewhere need greater access to information on building soil health to enhance long-term productivity and sustainability on their farms. The overall goal of this project was to provide tools and targets to guide soil management during the transition to organic operation, thereby increasing soil health and internal function of certified organic systems.

Specifically, we assessed how key soil health indicators and soil organisms changed under combinations of three different tillage and nutrient management strategies during the transition to organic farming.

What Did We Do?

Replicated plots were established at two sites each in two growing regions of Idaho (North and South), to determine the impact of different levels of tillage and organic matter additions on soil health indicators and crop growth during the organic transition phase. Both sites in Northern Idaho, GDF and SSF, were located near Moscow while both sites in Southern Idaho, KF and TF, were in Twin Falls County. All sites can be broadly characterized as having silt loam soils. However, Northern Idaho is rainfed with 27 inches of rainfall per year while Southern Idaho receives an average of 8 inches of precipitation. The sites in Southern Idaho were irrigated while those in Norther Idaho were not.

For all sites, alfalfa was established in year one and maintained for three years before it was terminated then feed barley was planted. For the two sites in Northern Idaho, alfalfa did not establish and was replanted in year 2. Each site had three levels of disturbance (tillage): high, medium, and low and three levels of organic additions: high, medium, and low for a total of nine plots per site (Figure 1). Treatment combinations were not replicated within site but instead replicated across sites (4 sites total). High tillage intensity included several passes of a rototiller and/or chisel plow with harrow. Medium intensity included one pass of a rototiller and/or chisel plow; while the low intensity only had harrow. Organic amendments were added every year; the medium rate of organic addition was designed to provide crop uptake of phosphorus for alfalfa and nitrogen for barley while the high rate was doubled. The low rate was bone meal (phosphorus) or blood meal (nitrogen) to meet crop uptake of the alfalfa and barley, respectively.

Yield was measured via hand sampling at all sites in September 2024. A wide range of soil physical, chemical, and biological soil health indicators were assessed in June 2024. Due to space limitations, only active carbon, also known as POxC, will be reported here. POxC is generally considered an indicator that is sensitive to management changes, especially those that increase soil carbon. It provides a quicker response than soil organic matter because POxC only indicates a small fraction of the soil carbon pool.

Figure 1. Example site layout. F= low organic amendment, 1C = medium organic amendment, and 2C = high organic amendment.

What Have We Learned?

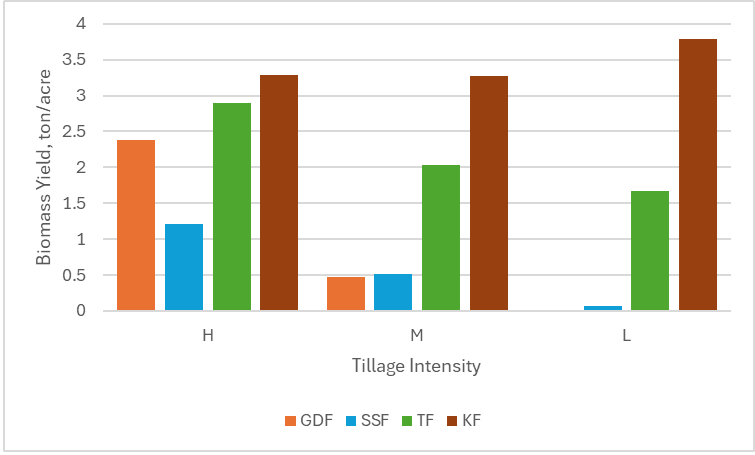
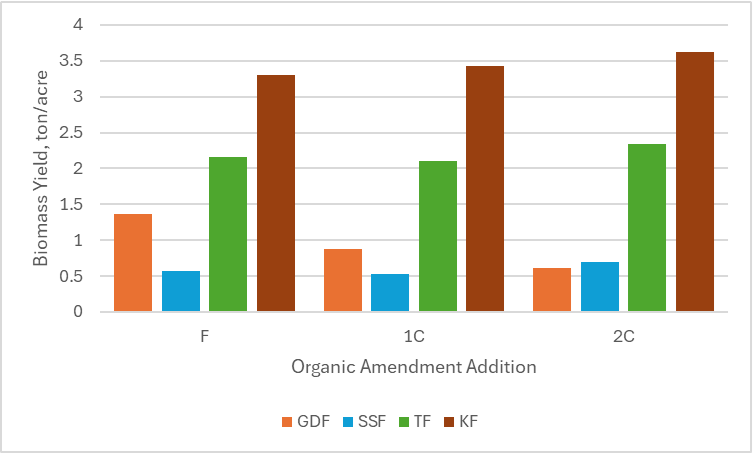
In Northern Idaho, upon harvest, total above ground biomass of spring barley was nearly double at GDF (1.72 tons/acre) compared to SSF (0.91 tons/acre) (Figure 2). Across both Northern Idaho sites, higher barley yield was associated with higher tillage with one of the sites having no harvestable barley in the low tillage treatment due to high weed and volunteer alfalfa pressure. Barley yields in Southern Idaho were higher than in Northern Idaho; KF had average yields of 3.45 tons/acre with TF averaging 2.20 tons/acre. Yields in Southern Idaho were the highest in the high tillage plots and lowest in the medium tillage. Organic amendment addition made little difference compared to tillage intensity for yields (Figure 3).

Figure 2. Spring barley yield (tons/acre) for sites in Northern (GDF and SSF) and Southern (TF and KF) Idaho by tillage intensity where H=high tillage intensity, M= medium tillage intensity, and L = low tillage intensity.
Figure 3. Spring barley yield (tons/acre) for sites in Northern (GDF and SSF) and Southern (TF and KF) Idaho by organic amendment addition levels where F= low organic amendment (bone meal), 1C= medium organic amendment addition where dairy compost applied to meet barley nutrient uptake, and 2C= high organic matter amendment addition at double the rate of 1C.

In terms of soil health indicators, POxC averaged higher at GDF plots (833.19 mg/kg soil) when compared to SSF plots (452.95 mg/kg soil). POxC was substantially lower in Southern Idaho than in Northern Idaho; plots at KF averaged 331.46 mg/kg soil while the TF site averaged 404.35 mg/kg soil. POxC decreased with depth across all sites. In Northern Idaho, there were no consistent trends for tillage or fertilizer across both sites. Treatment effects of tillage and fertilizer application depended on location. For example, GDF plots had an inverse relationship of POxC levels and increasing tillage. At SS, higher levels of POxC were associated with higher levels of tillage. Unlike Northern Idaho, POxC increased with decreasing tillage intensity at both sites in Southern Idaho. Across both Southern Idaho sites, POxC averaged 390.17 mg/kg soil in the lowest tillage intensity, 372.68 mg/kg soil for medium tillage intensity, and 340.87 mg/kg soil in the highest tillage intensity. There was no consistent effect of organic matter addition, however.

Future Plans

We are still analyzing data from this four-year study for other soil health indicators, such as the , earthworm species, and soil infiltration rates. This robust data set (over a dozen indicators total) will help guide which indicators of soil health are most suitable for organically managed systems.

Authors

Presenting & corresponding author

Linda Schott, Assistant Professor and Extension Specialist, University of Idaho, Lschott@uidaho.edu

Additional authors

Kendall Kahl, Assistant Professor and Extension Specialist, University of Idaho

Jodi Johnson-Maynard, Department Head and Professor, University of Georgia

Glen Stevens, Research Technician, University of Idaho

Ed Lewis, Professor, University of Idaho

Additional Information

Soil Health | University of Idaho Extension

Acknowledgements

Dan Temen, Will Romano, Kevin Kruger, Cami Ditton


The authors are solely responsible for the content of these proceedings. The technical information does not necessarily reflect the official position of the sponsoring agencies or institutions represented by planning committee members, and inclusion and distribution herein does not constitute an endorsement of views expressed by the same. Printed materials included herein are not refereed publications. Citations should appear as follows. EXAMPLE: Authors. 2025. Title of presentation. Waste to Worth. Boise, ID. April 7-11, 2025. URL of this page. Accessed on: today’s date. 

Leveraging Carbon Intensity Scoring for Sustainable Livestock Feed Supply Chains

Purpose

As market demands, consumer expectations, and environmental regulations evolve, agricultural producers increasingly focus on improving profitability while minimizing environmental impact. Carbon Intensity (CI) scoring is a tool that quantifies the greenhouse gas emissions associated with crop production, thereby helping producers understand their ecological footprint. CI scores may influence crop sales for biofuel production for corn and soybean producers and may eventually affect livestock feed markets as companies seek carbon-neutral supply chains. Furthermore, renewable fuel producers may become eligible for Low Carbon Fuel Standard (LCFS) credits, where revenue is contingent on the lifecycle CI score of the fuel, and similar economic approaches may be required to drive livestock feeds toward carbon neutrality. Biofuels and animal feed share a strong relationship; ethanol plants generate distiller grains, a key component of livestock diets, and soybean processing plants generate soybean meal and soybean oil. Distiller grains represent a large portion of livestock feed, and soybean oil is a common biodiesel feedstock. We evaluate the emissions associated with corn and soybean production for each county in Iowa, assessing how their yield, crop rotation, tillage practices, cover crop implementation, and manure application affect their CI scores.

What Did We Do?

This study used the Department of Energy’s Feedstock Carbon Intensity Calculator (FD-CIC) and published literature to estimate corn and soybean production emissions throughout Iowa counties. Manure nutrient volumes were found using animal feeding operation data from Iowa DNR and manure production characteristics from ASAE D384.2. Data for yield, acres of corn, acres of soybean, acres of cover crop, acres of no-tillage, acres of reduced tillage, and acres of intensive tillage by county in Iowa were found using the USDA Quick Stats Database. Diesel emissions and grain drying emissions were calculated using Iowa State University Extension resources. The nitrogen fertilizer application rate was calculated using the yield goal method (manure) and Iowa State University Extension resources (commercial fertilizers). Limestone emissions were directly correlated to the amount of CaCO3 necessary to neutralize the H+ added to the soil from manure nitrogen and anhydrous ammonia. Embedded fertilizer emissions, biomass degradation emissions, leguminous N fixation emissions, and specific fuel emission factors were pulled from FD-CIC. Corn and soybean CI scores were calculated in g CO2e/bu units. Through this work, we provide actionable insights for corn and soybean supply chain stakeholders interested in improving sustainability and expanding revenue opportunities.

What Have We Learned?

Key emission sources from corn and soybean production are nitrous oxide (N2O) from fertilizer and manure application, biomass residue degradation, embedded emissions from fertilizer production, and tractor diesel emissions. Reducing CI in corn production can be achieved through increased yield, reduced tillage, increased cover crop, and manure application. Reduced tillage and increased cover cropping increase soil organic carbon (SOC). Depending on the location and its existing soil characteristics, reduced tillage, and cover crops can sequester soil carbon, decreasing the overall CI score of the corn and soybeans. On average, SOC reduced CI scores by 6% and 18% for corn and soybeans, respectively.

Yield significantly impacted CI scores; counties with greater yield featured reduced CI scores. The CI score dropped by 33 g CO2e/bu for corn as yield increased by bu/acre with an R2 of 0.53. For soybeans, the CI score dropped by 72 g CO2e/bu as yield increased by bu/acre with an R2 value of 0.19.

Manure also significantly impacted CI scores. Although manure has increased diesel emissions compared to anhydrous ammonia application, manure lacks the embedded emissions of anhydrous ammonia, P2O5, and K2O fertilizers. As the percentage of manure-derived nitrogen increased by 1%, the CI score for corn reduced by 14 g CO2e/bu, featuring an R2 of 0.25. As the percentage of manure-derived P2O5 increased by 1%, the CI score for soybeans reduced by 25 g CO2e/bu, featuring an R2 of 0.68.

Crop rotation had a less intuitive effect on the CI score. Corn-soybean (CS) rotations typically have higher yields, reduced nitrogen fertilizer inputs, and reduced tillage. Nonetheless, continuous corn (CC) rotations facilitate greater build-up of SOC (assuming county tillage practices are evenly distributed among corn and soybean acres). Also, CC rotations occurred more frequently in high-yielding counties. For these reasons, the CS rotation was not associated with a reduced CI score.

Figure 1 and Figure 2 show carbon intensity scores of corn and soybean, respectively, for all counties throughout Iowa. Green counties typically feature greater yields, greater manure volume, and more significant SOC accumulation, whereas red counties typically feature opposite trends. It is worth noting that while CI scores are calculated per bushel, corn production averages roughly 194 bushels per acre, whereas soybean averages approximately 57 bushels per acre.

Figure 1: Corn Carbon Intensity by County in Iowa
Figure 2: Soybean Carbon Intensity by County in Iowa

Future Plans

Future analysis includes evaluating the CI scores of biofuels and animal feed produced in Iowa counties where the corn and soybean CI scores have already been assessed. Additionally, we intend on investigating the economics of implementing emission reduction strategies, considering potential yield loss and expenses of associated field activities. Also, by applying the methods of this paper to decades of historical data, we plan on analyzing how corn and soybean CI scores have evolved throughout time. Lastly, we will project future emission reduction strategy adoption and predict how CI scores of feed and fuel will change throughout the next decade.

Authors

Presenting author

Luke Soko, Graduate Student, Iowa State University

Corresponding author

Dan Andersen, Associate Professor, Iowa State University, dsa@iastate.edu


The authors are solely responsible for the content of these proceedings. The technical information does not necessarily reflect the official position of the sponsoring agencies or institutions represented by planning committee members, and inclusion and distribution herein does not constitute an endorsement of views expressed by the same. Printed materials included herein are not refereed publications. Citations should appear as follows. EXAMPLE: Authors. 2025. Title of presentation. Waste to Worth. Boise, ID. April 7-11, 2025. URL of this page. Accessed on: today’s date. 

Effect of Manure Handling and Incorporation on Steroid Movement In Agricultural Fields Fertilized With Beef Cattle Manure

Waste to Worth: Spreading science and solutions logoWaste to Worth home | More proceedings….

Why Study Manure Land Application and Steroids?

Manure generated from concentrated animal feeding operations may serve as a source of steroids in surface water and adversely impact the development of aquatic ecosystems. The objectives of this research were to determine the amount of steroids and metabolites in manure from beef cattle production pens, and runoff from crop production fields.

What Did We Do?

Heifers were treated with zeranol, trenbolone acetate, and 17b-estradiol implants and fed melengestrol acetate, while a second group was not treated with growth promoters. Manure was sampled in the pens during feeding, run-off was collected during rainfall events, after feeding manure was collected, and either composted or stockpiled overwinter. In the  following summer both composted and stockpiled manure was spread on a field, with plots subjected three tillage practices. Following application, two rainfall simulation events were conducted: one day (1 DAT) and one month later (30 DAT) to determine the effects of rainfall timing, manure handling (treated compost, untreated compost, treated stockpile and untreated stockpile) and tillage (no-till, moldboard plow+disk and disk) on the runoff losses of steroids.

What Have We Learned?

Simulated rainfall apparatus.

Results from the manure composting showed reduction in steroid concentrations over stockpiling for some compounds in manure samples such as 4-androstenedione, a-zearalenol, and progesterone, though not for all steroids. Very low concentrations of steroids were found in most runoff samples, approaching or below detection limits. Considering only detection frequency, fewer runoff samples showed traces of steroids on the 1 DAT in comparison to the 30 DAT simulations.  The amount of  rainfall  before runoff was initiated was affected by tillage, and was different for the 1 DAT and 30 DAT events. A second year’s study with a smaller set of treatments, and use of a surrogate estrogen applied at known mass showed that disking significantly reduced runoff losses of the steroids. Runoff risk is affected by the storm event needed to initiate runoff, and also the time since manure application.

Soil during rain simulation and tube to take runoff to collection point.

Future Plans

From both the steroid runoff and general manure applications risk perspectives, how the soil receives rainfall changes during the first month after tillage. Therefore, this process needs to be investigated more closely and models predicting runoff have to take these changes into account.

Authors

Charles A. Shapiro, Professor, Department of Agronomy and Horticulture, University of Nebraska-Lincoln, Haskell Agricultural Laboratory, Concord, NE cshapiro@unl.edu

Sigor Biswas, Research Assistant, William L. Kranz, Associate Professor, David P. Shelton, Professor, Simon J. van Donk, Assistant Professor, Biological Systems Engineering; Daniel D. Snow, Associate Professor, Schol of Natural Resources; Shannon L. Bartelt-Hunt, Assistant Professor, Tian C. Zhang, Professor, Civil Engineering; Terry L. Mader, Professor, Animal Science, University of Nebraska-Lincoln; David D. Tarkalson, Soil Scientist, USDA-ARS, Kimberly-ID. 

Additional Information

Bartelt-Hunt, S., D. Snow, W. Kranz, T. Mader, C. Shapiro, S. van Donk, D. Shelton, D. Tarkelson, and T.C. Zhang. 2012. Effect of growth promotants on the occurrence of steroid hormones on feedlot soils and in runoff from beef cattle feeding operations. Environ. Sci. Technol. 46(3): 1352-1360.

Biswas, S., C. A. Shapiro, W. L. Kranz, T. L. Mader, D. P. Shelton, D.D. Snow, S. L. Bartell-Hunt, D. D. Tarkalson, S. J. van Donk, T. C. Zhang, S. Enslay. Current knowledge on the environmental fate, potential impact and management of growth promoting steroids used in the US beef cattle industry. J. of Soil and Water Cons. (In press, July 2013 issue).

Acknowledgements

This research was funded by US-EPA Science to Achieve Results (STAR) grant R833423.


The authors are solely responsible for the content of these proceedings. The technical information does not necessarily reflect the official position of the sponsoring agencies or institutions represented by planning committee members, and inclusion and distribution herein does not constitute an endorsement of views expressed by the same. Printed materials included herein are not refereed publications. Citations should appear as follows. EXAMPLE: Authors. 2013. Title of presentation. Waste to Worth: Spreading Science and Solutions. Denver, CO. April 1-5, 2013. URL of this page. Accessed on: today’s date.