
Purpose
Oftentimes fall manure application is associated with significant offsite transport of nitrogen and phosphorus into nearby bodies of water and the atmosphere. Mechanisms of losses include leaching, runoff, sediment transport, and volatilization processes. This is becoming more common as there has been a trend of increased wet springs that create difficult planting conditions. This prolonged period without an active root system leaves more time for nutrient loss from fall-applied manure to occur.
A strategy to offset nutrient losses in the fall and early spring is to plant a cover crop. The uptake of nutrients during this time in the field, which would otherwise be left fallow, allows for nutrients to be stored in the tissue of the cover crops, minimizing nutrient loss risk. Upon terminating the cover crops, the decomposing residues can supply nutrients to the succeeding row-crop. However, cover crop adoption is low in the upper Midwest US stemming from a short cover crop growing season due to the cold climate. This is especially the case for crops utilizing manure. A strategy to expand the cover crop growing season may be to interseed a cover crop into a maturing row-crop prior to harvest. Previous studies investigating the integration of manure and cover crops have seeded the cover crop after manure application. We wanted to measure the impacts of first planting a cover crop then applying manure once the cover crop has had ample time to get established. This may help expand the cover crop growing season and potentially limit the offsite transfer of pollutants to our water and air.
What Did We Do?
A small plot study was started in fall 2019 at the University of Minnesota West Central Research and Outreach Center near Morris, MN. We tested the effect of nitrogen source and cover crops on soil health, nutrient cycling, and agronomic responses using a randomized complete block design with split plots.
Cover crop mixtures of cereal rye and annual ryegrass were interseeded near corn’s fifth leaf collar (V5) growth stage, physiological maturity (R5 to R6 growth stage), or drilled after corn harvest. Dairy manure was sweep-injected to minimize soil disturbance in early and late fall, when soil temperatures were above and below 10°C (50°F), respectively. Non-manured plots received urea in the spring prior to corn planting. Urea applied plots (no manure) with no cover crops served as the control. Soil samples were taken throughout the cover crop and row-crop growing season from the 0-15, 15-30, and 30-60 cm (0-6, 6-12, and 12-24 in) soil layers. Cover crop biomass samples were taken in the late fall prior to the first frost event and prior to cover crop termination in the spring.
What Have We Learned?
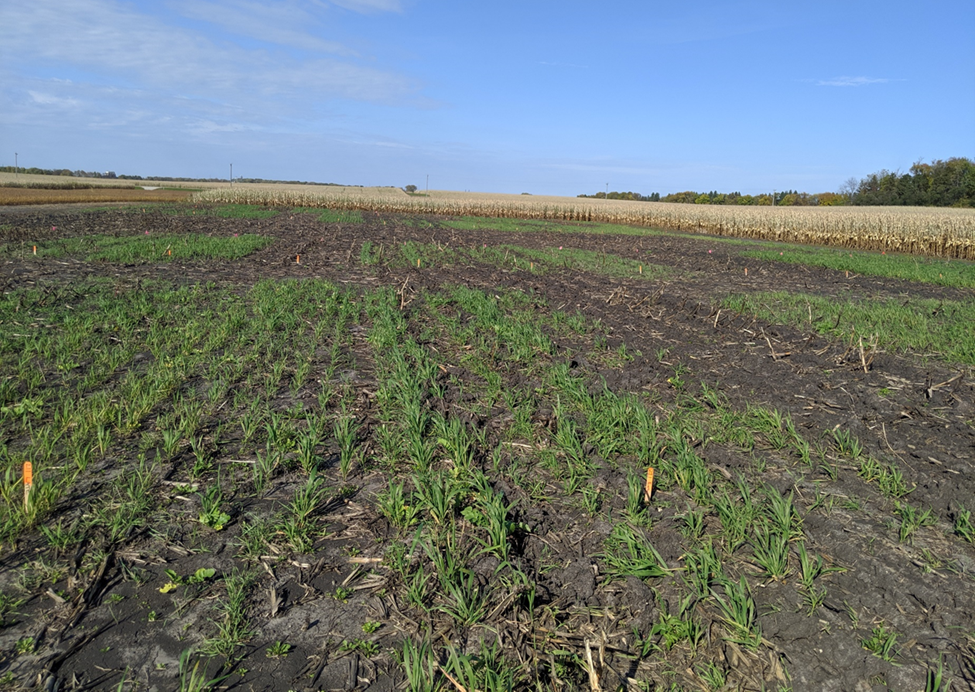
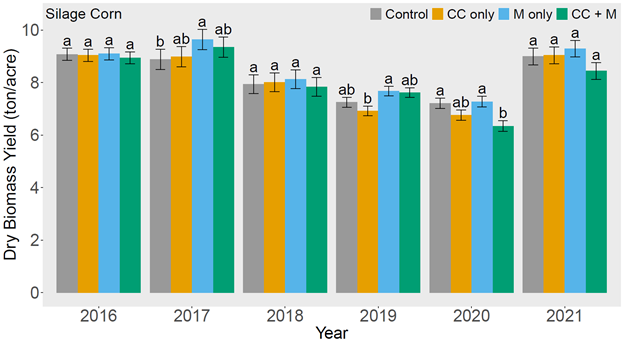
Sweep injection is a reliable method to apply liquid manure to a field with an established stand of cover crops with minimal noticeable damage to the cover crops in the spring (Figure 1). Planting cover crops as soon as possible ensures more biomass is produced; planting after harvest consistently had lower cover crop yield than interseeding. Spring cover crop yield, right before termination, was highest when planted near physiological maturity [110 kg ha-1 (98 lb ac-1)] compared to drilling after harvest [87 kg ha-1 (78 lb ac-1)]. Nutrient source had a significant effect on silage yield. Manure, either applied in the early or late fall, had greater silage yield [58.5 and 58.7 Mg ha-1 (26.1 and 26.2 ton ac-1), respectively] than spring applied urea [53.6 Mg ha-1 (23.9 ton ac-1)]. Plots with cover crops interseeded at V5 had greater silage yield [59.5 Mg ha-1 (26.5 ton ac-1)] than all other treatments [54-56 Mg ha-1 (24-25 ton ac-1)] except no cover crops [57.8 Mg ha-1 (25.8 ton ac-1)].
Future Plans
Soil samples collected throughout the study are currently being analyzed for nutrient content and other soil health parameters. Results from this study will be used to develop best management practices for integrating cover crops and liquid injected manure in the upper Midwest.
Authors
Manuel J. Sabbagh, Graduate Research Fellow, University of Minnesota
Corresponding author email address
sabba018@umn.edu
Additional authors
Melissa L. Wilson, Assistant Professor, University of Minnesota; Paulo H. Pagliari, Associate Professor, University of Minnesota
Additional Information
Twitter: @mannyandmanure @manureprof
Lab website: https://wilsonlab.cfans.umn.edu/
Acknowledgements
This work is supported by the Conservation Innovation Grants program at the Natural Resources Conservation Service of the USDA, the Minnesota Corn Research and Promotion Council, and the Foundation for Food and Agriculture Research.





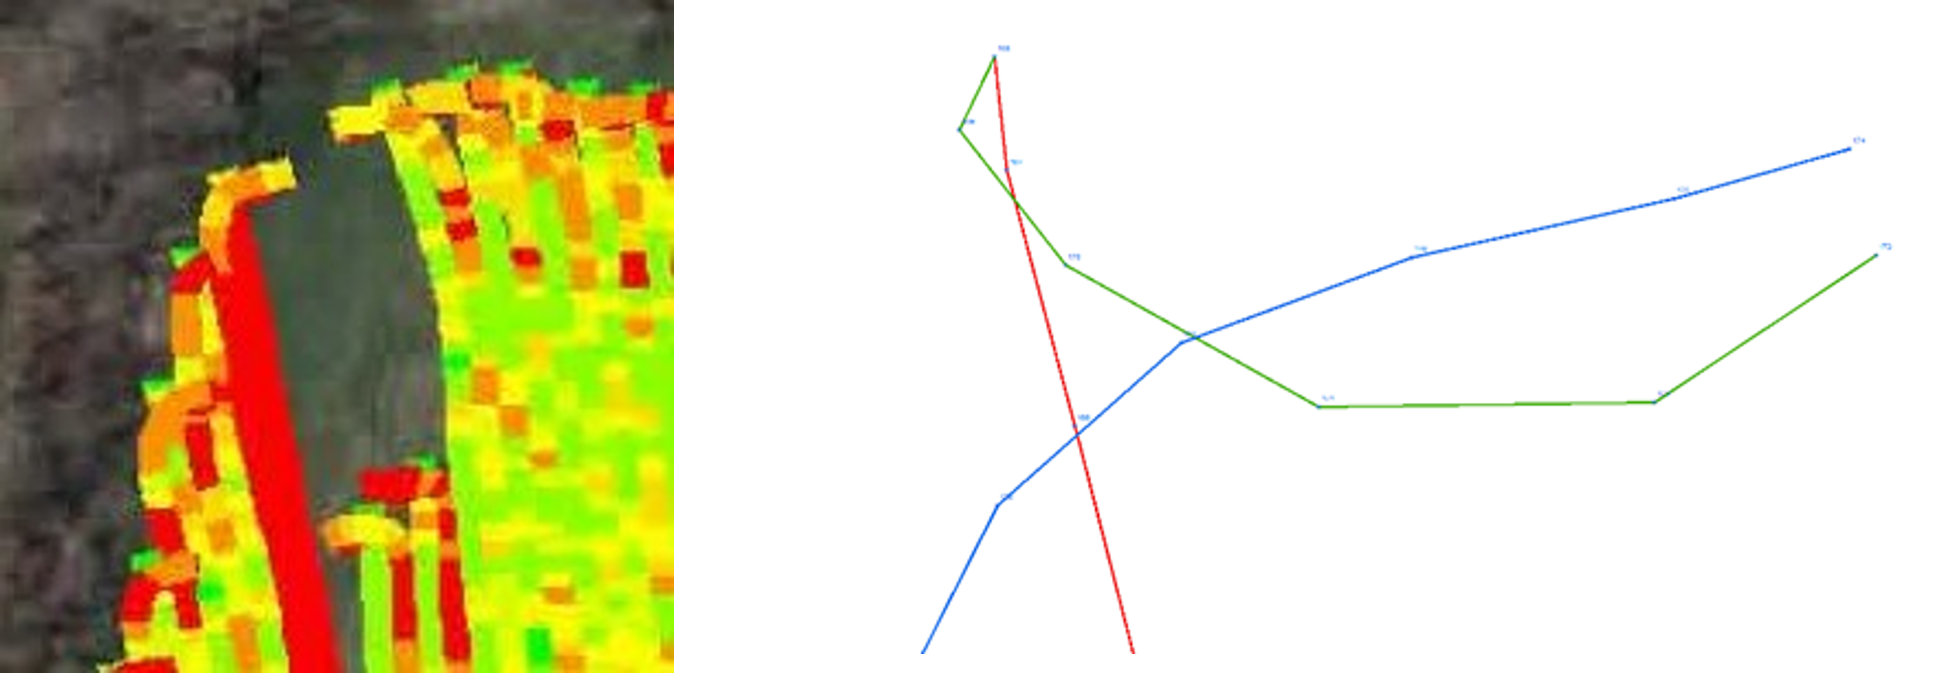 movement during the application. The lines represent the path of the tractor using a dragline to apply manure as it performs a K-turn at the end of the pull. The lines are formed by connecting the GPS coordinates recorded each second. The red line represents the tractor traveling North until it reached the end of the pass. The green line represents the travel path as the tractor backs up to make the K turn. The blue line is the path of the tractor as it again travels forward to complete the turn and head South again. The blue and green lines do not connect because a tractor backed up to some point northeast of the end of the green line, stopped and resumed moving forward again, all during the one-second interval between the ends of the green and blue lines.
 North on the right side of the figure, making a 180 degree turn at the end of the row, and heading back south. The numbers in the section of the curve on the upper right reflect the application rates per acre for a fictional piece of equipment with the following characteristics. The descriptive data is real, but it comes from multiple equipment companies. For this example, we used a dragline toolbar that is 60 feet wide with the left and right halves represented by the three arrows on the lines pointing north and south. The dragline has 16 injectors and is fed by a pump capacity of 5,500 gallons per minute. We spent some time watching videos of spreaders at equipment company websites and timing, with a stopwatch, different spreaders as they made turns. This example uses 13 seconds for the toolbar, to make a 180-degree turn. A 5,500 gallon per minute pump pumps 91.7 gallons per second, or a total of 1192 gallons as the vehicle turns around. We divide 1192 in half to separate the left and right sides of the toolbar and you have 596 gallons applied inside and outside the centerline during the turn. Now we need to turn our attention to the area that was covered. The area of a circle is given by the formula Pi times the square of the radius. The area of the 180-degree turn for the inside of a 60-foot toolbar is given by the formula (3.141593 X (30X30))/2 or 1,414 square feet. Using the same formula, the area of the larger 60-foot radius is 5655. To get the actual area covered by the outside half of the toolbar we need to subtract the area of the 30-foot radius half-circle from the 60-foot radius half circle which comes out to 5,655-1,414 = 4,241. Now that we have the areas, we can divide the left and right areas into gallons.