Proceedings Home | W2W Home 
Purpose
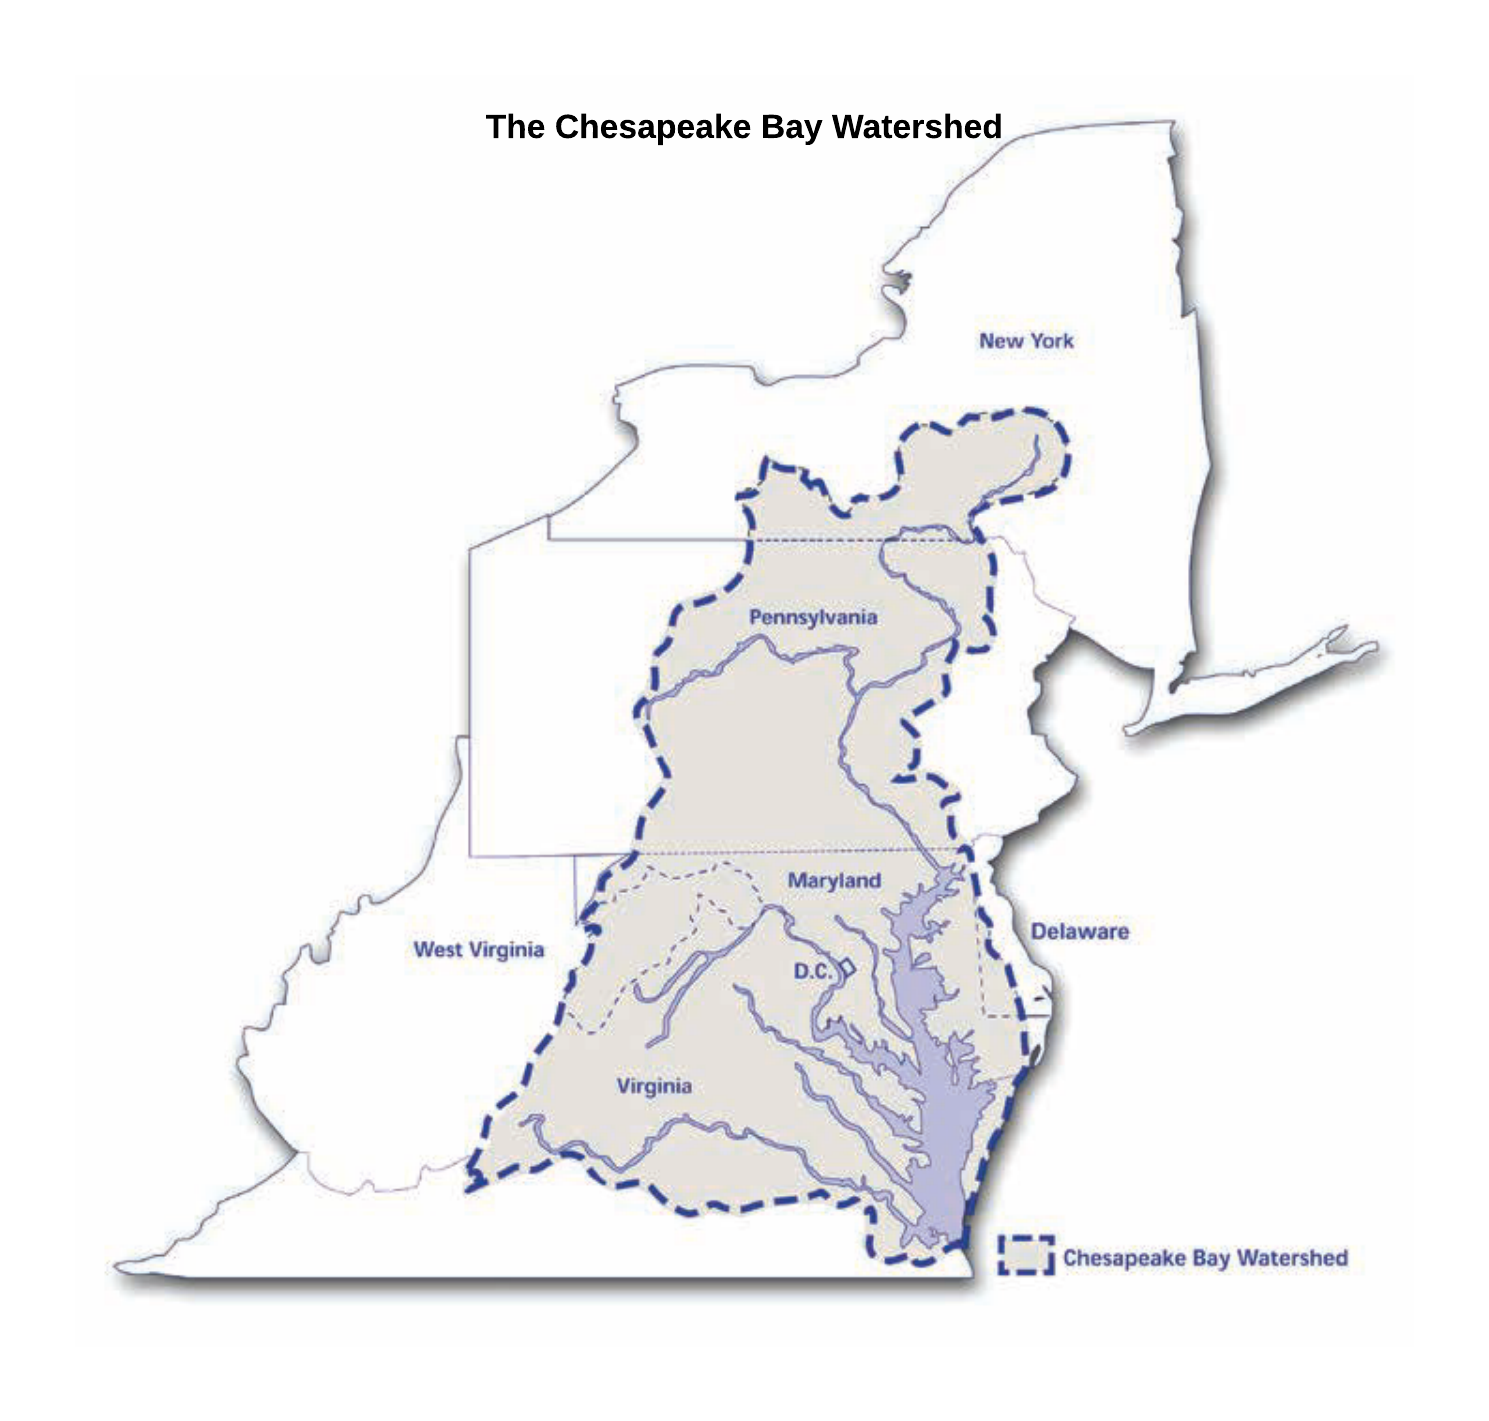
A Best Management Practice (BMP) Expert Panel was convened under guidance of the Chesapeake Bay Program’s (CBP) Water Quality Goal Implementation Team to assess and quantify Nitrogen and Phosphorus load reductions for use in the Phase 6 Chesapeake Bay Watershed Model when manure is injected or incorporated into agricultural lands within the watershed. (Further description of Expert Panels and processes can be found in the 2017 Waste to Worth Proceedings and Presentation by Jeremy Hanson and Mark Dubin).
What Did We Do?
The Expert Panel first created definitions of injection and incorporation practices, which allowed technologies utilized in research to be categorized within each definition. Categorization considered the manner in which manure was placed beneath the soil surface as well as the level of surface disturbance. Manure injection was defined as a specialized category of placement in which organic nutrient sources (including manures, biosolids, and composted materials) are mechanically applied into the root zone with surface soil closure at the time of application with soil surface disturbance of 30% or less. Manure incorporation was defined as the mixing of dry, semi-dry, or liquid organic nutrient sources (including manures, biosolids, and compost) into the soil profile within a specified time period from application by a range of field operations (≤24hr for full ammonia loss reduction credit and 3 days for P reduction credit(s)). Incorporation was divided into categories of high disturbance (<30% residue retention) and low disturbance (>30% residue retention). Both liquid and solid manures were considered.
The panel conducted an extensive literature review of research that allowed comparison of nutrient loss after manure injection and incorporation with a baseline of surface manure application without incorporation. These comparisons were assembled in a large categorical table in percentage form, that reflected loss reduction efficiency. Many manuscripts offered a percentage comparison of application treatments to the surface application baseline. For research reports that did not provide a percentage comparison, the panel interpreted results into a percentage comparison when possible.
Consideration to soil variability and location in the Chesapeake Bay Watershed was considered on a very broad basis and in a manner consistent with work of other panels and modeling team recommendations. Loss reduction efficiencies were provided for soils or locations listed as either Coastal or Upland regions. Nitrogen efficiencies did not vary between the regions, but Phosphorus efficiencies did.
What Have We Learned?
Nitrogen and Phosphorus loss reduction efficiency reported or derived from literature varied within categories. For some categories, the volume of literature was small. Research providing these efficiencies is often conducted on small plots with simulated rainfall. Literary reduction results were often provided as a range and not as a single value. Professional scrutiny and judgment was applied to each value provided from literature and to all values within injection and incorporation categories to determine loss reduction efficiencies to be used in the broad categories of the model. The final loss reduction efficiencies of the Expert Panel’s final report are provided in Tables 1 (Upland Region) and 2 (Coastal Region).
Table 1. Loss reduction efficiency values for Upland regions of the Chesapeake Bay Watershed.
|
Category |
Nitrogen |
Phosphorus |
|||
|
Time to Incorporation |
Ammonia Emission Reduction |
Reduction in N Loading1 |
Time to Incorporation |
Reduction in P Loading2 |
|
|
Injection |
0 |
85% |
12% |
0 |
36% |
|
Low Disturbance Incorporation |
≤24 hr 24-72 hr |
50% 34%
|
8% 8% |
≤72 hr
|
24% |
|
High Disturbance Incorporation |
≤24 hr 24-72 hr |
75% 50%
|
8% 8% |
≤72 hr
|
0%3 |
1 Reduction in N loading water achieved only for losses with surface runoff. The portion of total N loss through leaching is not impacted by the practices. 25% of total N losses to water are assumed to be lost with runoff (both dissolved N and sediment-associated organic matter N).
2 Reduction in P loading water achieved only for losses with surface runoff. The portion of total N loss through leaching is not impacted by the practices. 80% of total P losses to water are assumed to be lost with runoff (both dissolved and sediment-bound P) in upland regions of the watershed.
3 Reduction in dissolved P losses typically offset by greater sediment-bound P losses due to greater soil erosion with tillage incorporation in upland landscapes.
Table 2. Loss reduction efficiency values for Coastal Plain region of the Chesapeake Bay Watershed.
|
Category |
Nitrogen |
Phosphorus |
|||
|
Time to Incorporation |
Ammonia Emission Reduction |
Reduction in N Loading1 |
Time to Incorporation |
Reduction in P Loading2 |
|
|
Injection |
0 |
85% |
12% 12% |
0 |
22% |
|
Low Disturbance Incorporation |
≤24 hr 24-72 hr |
50% 34%
|
8% 8% |
≤72 hr
|
14% |
|
High Disturbance Incorporation |
≤24 hr 24-72 hr |
75% 50%
|
8% 8% |
≤72 hr
|
14% |
1 Reduction in N loading water achieved only for losses with surface runoff. The portion of total N loss through leaching is not impacted by the practices. 25% of total N losses to water are assumed to be lost with runoff (both dissolved N and sediment-associated organic matter N).
2 Reduction in P loading water achieved only for losses with surface runoff. The portion of total N loss through leaching is not impacted by the practices. 48% of total P losses to water are assumed to be lost with runoff (both dissolved and sediment-bound P) in Coastal Plain.
Future Plans
The report of the Manure Injection and Incorporation Panel were accepted by the Chesapeake Bay Program’s Agricultural Workgroup in December 2016. The values will be utilized in Phase 6 of the Chesapeake Bay Watershed Model. Future panels may revisit the efficiencies as future model improvements are made.
Corresponding author (name, title, affiliation)
Robert Meinen, Senior Extension Associate, Penn State University
Corresponding author email address
Other Authors
Curt Dell (Panel Chair), Soil Scientist, USDA-Agricultural Research Service
Art Allen, Associate Professor and Associate Research Director, University of Maryland – Eastern Shore
Dan Dostie, Pennsylvania State Resources Conservationist, USDA-Natural Resources Conservation Service
Mark Dubin, Agricultural Technical Coordinator, Chesapeake Bay Program Office, University of Maryland
Lindsey Gordon, Water Quality Goal Implementation Team Staffer, Chesapeake Research Consortium
Rory Maguire, Professor and Extension Specialist, Virginia Tech
Don Meals, Environmental Consultant, Tetra Tech
Chris Brosch, Delaware Department of Agriculture
Jeff Sweeney, Integrated Analysis Coordinator, US EPA
For More Information
Two related presentations given at the same session at Waste to Worth 2017
- Developing science-based estimates of BMP effectiveness
- Recommendations of the expert panel on manure treatment technologies
Acknowledgements
Funding for this panel was provided by the US EPA Chesapeake Bay Program and Virginia Tech University through an EPA Grant.
The authors are solely responsible for the content of these proceedings. The technical information does not necessarily reflect the official position of the sponsoring agencies or institutions represented by planning committee members, and inclusion and distribution herein does not constitute an endorsement of views expressed by the same. Printed materials included herein are not refereed publications. Citations should appear as follows. EXAMPLE: Authors. 2017. Title of presentation. Waste to Worth: Spreading Science and Solutions. Cary, NC. April 18-21, 2017. URL of this page. Accessed on: today’s date.