Composting Pen Pack Cattle Manure for Improved Nutrient Transport

Purpose

The overall purpose of this research was to demonstrate the volume, weight and moisture reduction from composting pen pack cattle manure so that organic nutrients can be transported farther from the livestock barn. Simultaneously, through laboratory analysis, the goal was to measure the nutrient density of the compost from the start of the process to the finish. The reduction in volume will allow cattle farmers to store more manure in their dry stack (manure) barns to be land-applied at more ideal times, thus avoiding winter application on frozen and/or snow-covered ground.

Due to the overwhelming weight and volume logistics of unprocessed (raw) manure in general, often the manure is land-applied to fields relatively close to the livestock barn. This phenomenon has historically resulted in some fields or areas within fields that have high or luxury levels of soil test phosphorus and potassium. Manure is a great source of nutrients and organic matter for crop production. Avoiding application of manure on fields that are farther from the livestock barn can result in lower soil health and missed economic opportunity for these fields. Once a drier, more nutrient-dense compost is created, a second purpose of the research is to promote transfer of the compost to fields that are farther from the livestock barn or to fields with lower soil test phosphorus or potassium levels.

A final purpose of the research is to utilize compost in corn production systems to evaluate its benefit when applied at the same nutrient rate as its raw manure or commercial fertilizer counterparts. When manure or compost are added to a crop production system, the health and biology of the soil are improved.

What Did We Do

The study began by working with local cooperators who currently raise cattle and manage manure nutrients. This peer learning group included five (5) cooperators. Each cooperator was asked to build at least one windrow of pen pack (solid, dry bedded) manure removed from their cattle barn. The windrow was not to exceed 6 feet in height by 12 feet in width and could be of any length. All manure was weighed at the start of the composting process and then at the end of the process to measure weight reduction. To measure volume, windrows were measured (height x width x length) at the start and finish; cooperating farmers recorded ‘trucks in’ and ‘trucks out’. The five cooperators built eight (n=8) windrows for the purpose of this study.

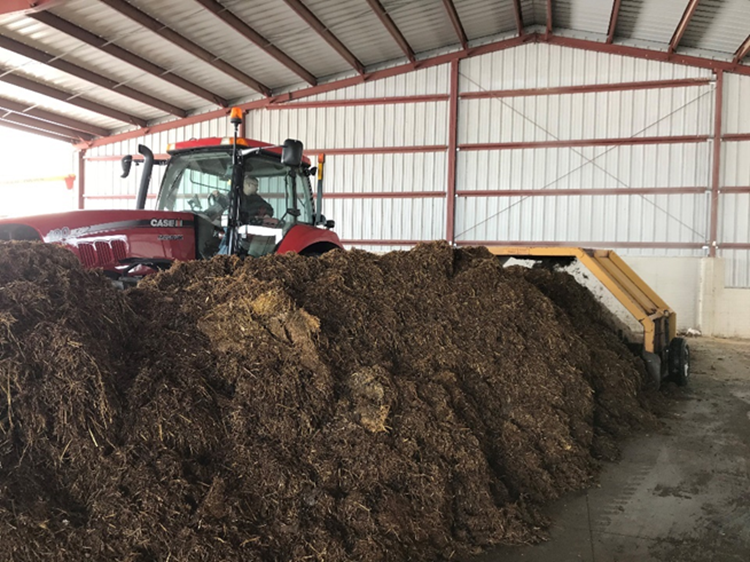
For baseline data, all cooperators were asked to dedicate one windrow for weekly mechanical compost turning inside a dry stack barn for eight (8) weeks. Any additional windrows composted were to address research questions raised by cooperators. Two ‘additional’ windrows were turned every 2 weeks and a third ‘additional’ windrow was turned weekly, but in an outdoor setting. Mechanical composting was achieved with an HCL Machine Works pull-type compost turner (Figure 1). The compost turner accomplished two key things: consistently mixing compost ingredients (manure, sawdust, wheat straw), and adding oxygen into the composting system. The compost turner was pulled by a Case IH 190 Magnum tractor equipped with a continuously variable transmission (CVT). The CVT allowed for critical ultra-slow speeds (.05-.15 mph) necessary for early mixing passes with the compost turner and raw ingredients.

Figure 1. A pull-type compost turner (6 foot x 12 foot) used for this study

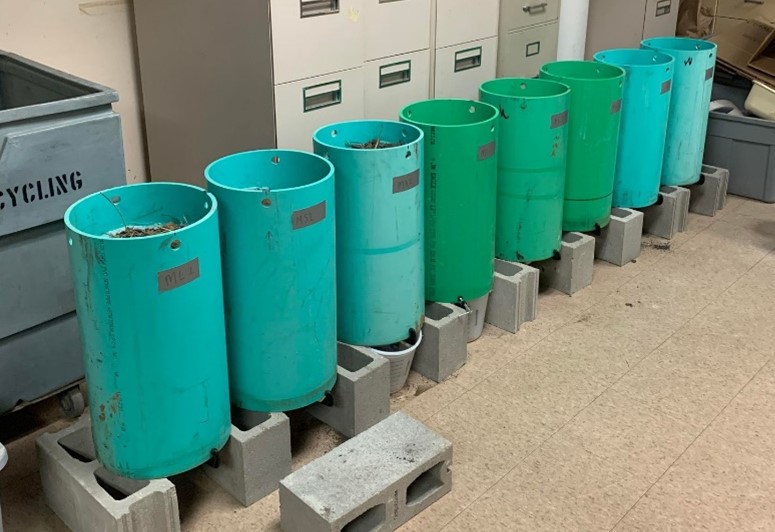
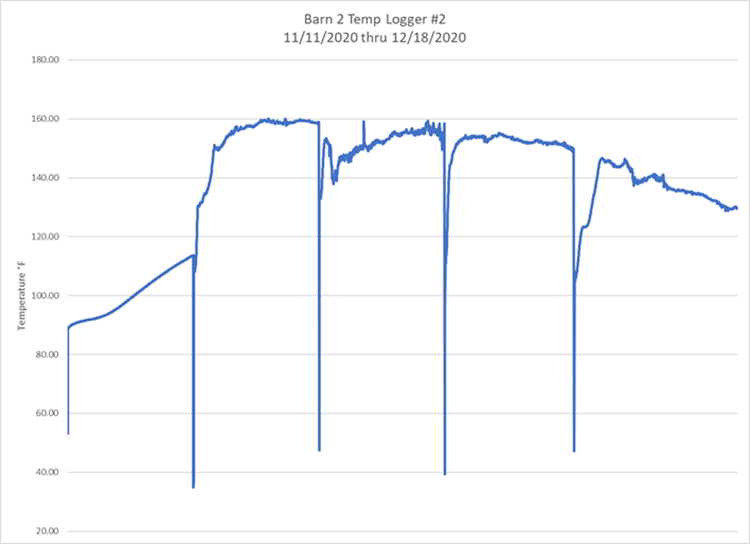
Another significant part of the research was manure nutrient analysis. Every windrow site (n=8) had 3 samples pulled for analysis: once at the start of composting, after every compost turn (6-8 turns on average) and when the compost was land applied or at the last turn. Key nutrients analyzed were nitrogen, phosphorus, potassium, sulfur and calcium. Additionally, temperatures were monitored using a 36” dial compost thermometer (Figure 2) prior to every turn to ensure adequate composting temperatures (120-140 deg F ideally) were maintained. Each windrow also had a HOBO temperature logger inserted in the center of the pile for temperature logging every 15 minutes for the duration of the process.

Figure 2. Compost thermometers (36”) were used to double-check pre-turn temperatures each week

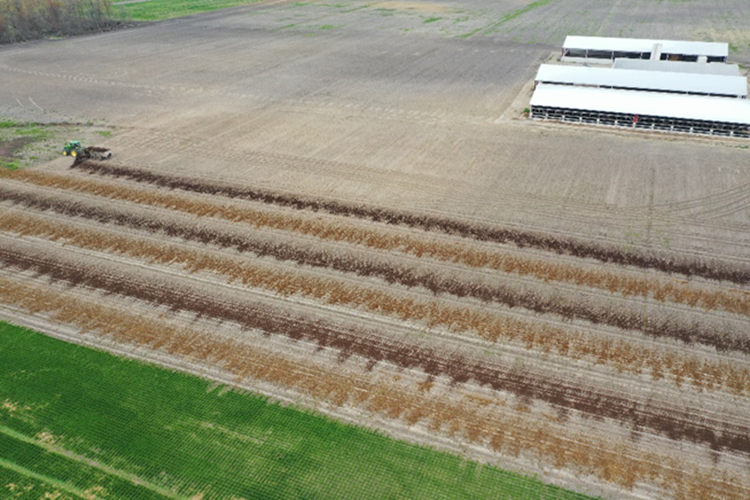
Finally, cooperators were asked to work with the researcher to develop a replicated field trial in field corn utilizing the finished compost product from their farm. Generally, the goal of the field trials were to compare a ‘normal’ rate of manure against a half rate of compost (Figure 3). Yield and moisture data from field trials were collected and analyzed.

Figure 3. Land application of manure (light in color) and compost (dark in color) for replicated strip trials in corn.

What Have We Learned

This research began with an aggregated 258 tons of unprocessed (raw) pen pack cattle manure among 8 sites (windrows) and yielded 121 tons of finished compost, a 53% reduction in weight. However, the volume reduction was less significant than the reduced weight. The number of ‘trucks in’ versus ‘trucks out’ resulted in 28% reduction in volume. The average initial moisture of raw manure was 66% as compared the average final moisture of 48%.

Cooperators turned compost for a minimum of five weeks with some turning up to eight weeks. The average number of turns was seven weeks for each of the eight windrow sites.

The starting nutrient analysis of the manure on a per ton basis was 8 lbs total nitrogen (TKN), 8 lbs phosphorus (P), 14 lbs potassium (K), 1.5 lbs sulfur (S), and 4.5 lbs Calcium (Ca). The finished compost averaged 7.5 lbs TKN, 20 lbs P, 31 lbs K, 3 lbs S, and 12 lbs Ca per ton. Except for total nitrogen, nutrient density more than doubled for these key nutrients as a result of the composting process (Figure 4). It is assumed that nitrogen was consumed in the composting process resulting in increased organic matter and organic carbon.

Figure 4. Density of key nutrients doubled for phosphorus, potassium, sulfur and calcium from the start of composting to the finished product (n=8 sites)

Temperatures were monitored weekly and temperature data indicated that only one windrow dropped below 100 degrees Fahrenheit during the 8-week process. This windrow was smaller than the others and the compost was happening in below freezing temperatures that occurred in the month of February 2021.

Figure 5. Buried temperature loggers monitored compost temperatures throughout the research. Temperature drops resulted when loggers were removed for compost turning and then replaced

Finally, three replicated field trials were conducted in field corn to compare full rates of manure versus half rates of compost (Tables 1, 2, 3). One more comprehensive trial included a university recommended fertilizer rate as well (Table 4). On average, the compost was hauled 4.5 miles from the livestock barn, thus giving some promise to improved transport of manure/compost to farther field locations. The results below are from one year of data at each respective site and should be interpreted as such.

Table 1: Site 1 – Corn for grain
Treatments Harvest Moisture (%) Yield (bu/acre)
10 tons/ac MANURE 17.5 252 a
5 tons/ac COMPOST 17.8 245 a
LSD: 11.5, CV 2.0
Table 2: Site 2 – Corn for grain
Treatments Harvest Moisture (%) Yield (bu/acre)
Check (no manure or compost) 18.0 258 a
6 tons/ac MANURE 17.9 259 a
3 tons/ac MANURE 18.1 258 a
LSD: 9.7, CV 2.1
Table 3: Site 3 – Corn for silage
Treatments Harvest Moisture (%) Yield (bu/acre)
10 tons/ac MANURE 57.8 23.8 a
5 tons/ac COMPOST 57.8 22.7 a
LSD: 1.7, CV 3.1
Table 4: Site 4 – Corn for grain
Treatments Harvest Moisture (%) Yield (bu/acre)
Fertilizer (22-52-120-12s/ac) 17.6 190 b
10 tons/ac MANURE 17.7 213 a
5 tons/ac MANURE 17.5 202 ab
LSD: 14.9, CV 4.3

Future Plans

Future plans include adding 4-5 more windrow sites before this 2023 grant expires. In 2022 and 2023, the hope is to compare static windrows versus those that are turned mechanically. In the first 8 sites, compost turning was based on time (weekly or bi-weekly turn). In the future, oxygen level or temperatures should be evaluated to help determine timing of turning. From a crop yield perspective, measuring soybean yields in the year following corn where the compost, manure or fertilizer was applied would be informative for growers as they make decisions about improving placement (transport) of manure or compost further from the livestock barn or to fields that have low soil test phosphorus or potassium. Finally, a complete economic analysis of the composting plus further transport needs to be conducted via a case study model.

Authors

Eric A. Richer, Assistant Professor and Extension Educator, Ohio State University Extension
richer.5@osu.edu

Additional Authors

-Jordan Beck, Water Quality Extension Associate, Ohio State University Extension
-Glen Arnold, Field Specialist, Manure Nutrient Management, Ohio State University Extension

Additional Information

Hawkins, E. et al. 2021 eFields Report. Retrieved from https://digitalag.osu.edu/efields

OSU Extension Facebook and Twitter pages: www.fulton.osu.edu

Acknowledgements

This work is supported by a Great Lakes Sediment and Nutrient Reduction Program grant. Thanks to the five cooperating farmers who participated in this research study with Ohio State University Extension. Thanks to Stuckey Brothers Farms for use of compost turner and Redline Equipment for rental of Case IH 190 Magnum tractor.


The authors are solely responsible for the content of these proceedings. The technical information does not necessarily reflect the official position of the sponsoring agencies or institutions represented by planning committee members, and inclusion and distribution herein does not constitute an endorsement of views expressed by the same. Printed materials included herein are not refereed publications. Citations should appear as follows. EXAMPLE: Authors. 2022. Title of presentation. Waste to Worth. Oregon, OH. April 18-22, 2022. URL of this page. Accessed on: today’s date.

Overview of ODA’s Division of Livestock Environmental Permitting

Purpose

The purpose of this presentation is to provide a complete overview of ODA’s Division of Livestock Environmental Permitting (“ODA-DLEP”). ODA-DLEP regulates any livestock facility in Ohio that has the following number of animals or greater:

    • 700 mature dairy cows
    • 1,000 beef cattle or dairy heifers
    • 2,500 swine weighing more than 55 pounds
    • 10,000 swine weighing less than 55 pounds
    • 82,000 layers
    • 125,000 broilers or pullets
    • 500 horses
    • 55,000 turkeys

What Did We Do

Ohio Department of Agriculture’s Division of Livestock Environmental Permitting (“ODA-DLEP”) regulates the siting, construction, and operation of Ohio’s largest livestock facilities, referred to as Concentrated Animal Feeding Facilities (“CAFF”). ODA-DLEP’s primary objective is to minimize any water quality impacts, including both surface and ground waters, associated with the construction of new or expanding CAFFs, as well as implementation of best management practices once a CAFF becomes operational. These best management practices include management of manure, insect and rodent control, mortality management, and emergency response practices. ODA-DLEP issues Permits to Install (for construction) and Permits to Operate (for operations).

In addition, ODA-DLEP conducts routine inspections of each CAFF at least once a year, responds to complaints, and participates in emergency response. Inspections are conducted to review a CAFF’s compliance with Ohio Revised Code 903 and Ohio Administrative Code 901:10, the laws and regulations governing Concentrated Animal Feeding Facilities.

Finally, ODA-DLEP administers the Certified Livestock Manager program. Any individual in the State of Ohio that manages 4,500 dry tons of solid manure or 25 million gallons of liquid manure is required to be a Certified Livestock Manager (“CLM”).

What Have We Learned

Livestock operations continue to get larger and more concentrated and as a result, regulations are necessary to ensure proper handling and management of manure, particularly with land application of manure.

Future Plans

Over the past several years, DLEP has started to see more interest in manure treatment technologies. This could include, but is not limited to, anaerobic digestion, nutrient recovery, solids separation, and wastewater treatment. Technologies like this could greatly alter the landscape of the livestock industry by fundamentally changing the way manure is handled and how nutrients from manure are applied. DLEP does have regulations in place to account for manure treatment technologies. However, regulations, and specifically changes to regulations, cannot maintain the same pace as these technological advancements.

Authors

Samuel Mullins, Chief of ODA-Division Livestock Environmental Permitting
Samuel.mullins@agri.ohio.gov

Additional Information

https://agri.ohio.gov/divisions/livestock-environmental-permitting
https://codes.ohio.gov/ohio-administrative-code/901:10
https://codes.ohio.gov/ohio-revised-code/chapter-903

Videos, Slideshows and Other Media

ODA Division Spotlights – Division of Livestock Environmental Permitting 1

ODA Division Spotlights – Division of Livestock Environmental Permitting 2


The authors are solely responsible for the content of these proceedings. The technical information does not necessarily reflect the official position of the sponsoring agencies or institutions represented by planning committee members, and inclusion and distribution herein does not constitute an endorsement of views expressed by the same. Printed materials included herein are not refereed publications. Citations should appear as follows. EXAMPLE: Authors. 2022. Title of presentation. Waste to Worth. Oregon, OH. April 18-22, 2022. URL of this page. Accessed on: today’s date.

Quantification of greenhouse gas emission reductions for eight dairy manure management systems employed in the Northeast and upper Midwest

Purpose

Dairy farmers and their key advisors, the balance of the dairy value chain, policy makers, government officials, non-governmental organizations (NGOs), and astute consumers value best available information about the greenhouse gas (GHG) emissions associated with milk production. In 2020, the Innovation Center for US Dairy set three 2050 environmental stewardship goals spanning from cradle to processor gate, including GHG neutrality. Further, they committed to reporting on progress towards the goals every five years starting in 2025.

Dairy farming economics will continue to drive production consolidation, a trend that substantially began in the 1960s. Consolidation results in fewer total farms yet only somewhat fewer total cows overall; thus, the number of cows per farm has substantially increased. The best management practice of long-term manure storage (LTS) was developed by USDA NRCS decades ago to protect water quality due to manure runoff and infiltration. The number of farms with LTS increased as the number of cows per farm increases. Overall, LTSs are largely anaerobic, resulting in the emission of methane (CH4) and in some cases nitrous oxide (N2O). It is generally understood that the 2nd largest cradle to farm gate CH4 emission source is LTS. Continued industry consolidation will result in more LTS over time.

Continued use of (LTS) to protect water quality, coupled with today’s use of manure treatment practices on-farm and the US dairy and other GHG reduction goals set are important reasons to quantify manure-based GHG emissions.

What Did We Do

To help dairy farmers and others understand the relative impact manure management (MM) has on GHG emissions, seven integrated MM systems that are utilized by farmers in the Northeast/upper Midwest were analyzed. The approach was to calculate the GHG emission impacts using best available information and procedures. The seven systems analyzed, each shown in process flow order, were:
1. Long-term storage (LTS)
2. Solid-liquid separation (SLS), LTS
3. SLS, LTS with cover/flare (CF)
4. Anaerobic digestion (AD) of manure only, SLS, LTS
5. AD, SLS, LTS with CF
6. AD of manure/food waste, SLS, LTS with CF
7. AD of manure/food waste, SLS, LTS with cover/gas utilization

The resulting net GHG emission values were compared to the baseline MM practice of daily spreading.

Impact of systems on GHG emissions associated with LTS and offsets from net energy production and landfill organics diversion (anaerobic digestion systems only) were included. Results were normalized on a metric ton of carbon dioxide equivalent (CO2e) per cow-year basis. A 100-year global warming potential (GWP100) value of 25 and a 20-year GWP20 (84) were used for comparative purposes in calculating CO2e. A sensitivity analysis was conducted to understand the impact of volatile solid (VS) biodegradability on GHG emissions and anaerobic digester system biogas leakage.

What Have We Learned

Not surprisingly, results show that the largest GHG reduction opportunity was from anaerobic co-digestion of dairy manure with community substrate (7. above). The net GHG emission from this system was -16 (GWP100) and -43 (GWP20) metric tons CO2e per cow-year (GHG avoidance). This is compared to the GHG emission of 1.9 (GWP100) and 5.6 (GWP20) metric tons CO2e per cow-year from the LTS (1. above). Sensitivity analysis results showed manure VS degradability had meaningful impact on GHG emissions, particularly for Scenario 4, and for the co-digestion scenarios, the most significant impact – 5% – resulted in a leakage increased from 1% to 3%. While using SLS with an impermeable cover and flare system on a separated liquid manure LTS reduces CH4 emissions as compared to uncovered long-term liquid manure storage, the practice does not provide an opportunity to achieve net zero or better manure enterprise GHG footprint because the energy in the biomass is wasted and diversion of organics from landfills cannot be effectively included.

Future Plans

Next step is to develop additional results for integrated MM systems that included advanced manure treatment technologies that further reduce the organic loading on LTSs. Further parallel work will focus on quantifying these same advanced manure treatment technologies on their partitioning of digester effluent nutrients for off-farm export.

Authors

Curt A. Gooch, Sustainable Dairy Product Owner, Land O’Lakes – Truterra
cgooch@landolakes.com

Additional Authors
-Peter E. Wright, Extension Associate, Cornell PRO-DAIRY Dairy Environmental Systems Program
-Lauren Ray, Extension Support Specialist III, Cornell PRO-DAIRY Dairy Environmental Systems Program

Additional Information

More information on related work can be found on the Cornell University PRO-DAIRY Dairy Environmental Systems Program website: https://cals.cornell.edu/pro-dairy/our-expertise/environmental-systems.

Acknowledgements

The Coalition for Renewable Natural Gas and the New York State Department of Agriculture and Markets provided financial resources to support this work.


The authors are solely responsible for the content of these proceedings. The technical information does not necessarily reflect the official position of the sponsoring agencies or institutions represented by planning committee members, and inclusion and distribution herein does not constitute an endorsement of views expressed by the same. Printed materials included herein are not refereed publications. Citations should appear as follows. EXAMPLE: Authors. 2022. Title of presentation. Waste to Worth. Oregon, OH. April 18-22, 2022. URL of this page. Accessed on: today’s date.

Abating Particulate Matter Emissions From On-Farm Poultry Litter-Fueled Energy Systems

Purpose

Approximately, 11% of the poultry operations in the United States are in the five-state region of the Chesapeake Bay Watershed (Bay), representing 7,000 family farms and generating about $1.1B in revenues. The Bay states have identified a variety of manure management practices and programs to help meet the nutrient reduction targets set in the Bay-Total Maximum Daily Load plan. Poultry-litter fueled on-farm thermal conversion processes (PL-TCP) can be used to generate renewable thermal energy for heating poultry houses. Additionally, PL-TCP can potentially enhance nutrient management alternatives by concentrating the phosphorus- and potassium-rich ash co-products to enable reaching more distant markets more efficiently. However, due to PL fuel properties, scale- and setting-appropriate emission abatement has been a challenge for on-farm PL-TCP.

What Did We Do

This project assessed total particulate matter (TPM) emissions for two PL-TCP systems on two poultry farms, S1 and S2, and at a technology provider facility (S3). S1 is located in Pennsylvania on a 60-acre farm with two 24,000 sq. ft poultry houses. The farm raises certified-organic broilers on approximately six-week flock cycles resulting in an average of five flock cycles per year per house. The biomass boiler and heat distribution systems were installed by Total Energy Solutions (TES) to provide heating for two poultry houses and an adjacent mechanical shop in 2012. The system specified by TES uses a biomass boiler (model CGS-225 and rated at 1.5 MMBtu/hr) marketed through Triple Green Products (TGP), Morris, Manitoba. S2 is also located on a poultry farm in Pennsylvania with three 24,000 square foot poultry houses for antibiotic free broilers, with an average of six-and-a-half flock cycles per year per house. In 2015, the farmer installed two Bio-Burner BB-500 heating units from LEI Products, a firm now doing business as OrganiLock, to heat two of the poultry houses. The heating units are each rated 0.5 MMBtu/hr and were installed in a mechanical room located between two poultry houses. S3 is located at the OrganiLock corporate headquarters in Kentucky where a bioenergy unit, similar to that at S2, is used for testing purposes.

The TPM emissions were assessed using EPA source testing methods. Seventy-eight emission tests were completed for 15 different system configurations. First, we established the baseline TPM emissions and shared this information with collaborating technology providers to inform their modifications to the TPM-emission abatement control systems to meet the stated project TPM reduction goal of at least 70%. Base case emission factors were estimated as 3.851 and 2.885 TPM-lb/MMBtu for S1 and S2, respectively. Abatement system upgrades consisted of cyclones with a bag filter system at S1, a wet scrubber at S2, and filtration media at S3. Three levels of a fuel additive were used during seven source emission tests in the bioenergy unit at S3. The fuel additive consisted of an aluminosilicate mineral product and dosed with the poultry litter fuel at 2%, 5%, and 10%, by weight (w.b.). Additionally, farmers were interviewed to share their experiences operating the on-farm bioenergy units for use in broader outreach dissemination.

What Have We Learned

The abated emission factor for the S1 system was 0.187 TPM-lb/MMBtu, a 95% reduction relative to the base case. While the abated emission factor for the S2 system was 1.887 TPM-lb/MMBtu, a 35% reduction relative to the base case. The use of the mineral additive at S3 at a 10% fuel mix reduced the emission factor for that system from 2.885 to 1.098 TPM-lb/MMBtu, a 61% reduction. Three educational videos were developed from recorded farmer interviews to document and share actual experiences operating these on-farm bioenergy systems. The intent of these videos is to help inform potential future adopters of these technologies on the first-hand operational experiences shared by the technology host farmers managing these on-farm poultry little-to-energy technologies.

Future Plans

Future areas of work include: develop a techno-economic assessment to understand the economic viability of fully-abated systems, including farmer/service provider time requirements and to compare to other nutrient and energy management strategies; optimize abatement systems to evaluate options for lower capex/opex abatement strategies; evaluate fuel additives to replicate emission reductions and assess impacts to broader system performance; benchmark fuel properties to characterize the range of highly variable PL more suitable for thermal conversion processes; and assess the key factors for broader adoption.

Authors

John Ignosh, Extension Specialist, Dep. Biological Systems Engineering, Virginia Tech, Harrisonburg, VA, USA
Jignosh@vt.edu

Additional Authors
Jactone Ogejo, Associate Professor & Extension Specialist, Dep. Biological Systems Engineering, Virginia Tech, Blacksburg, VA, USA

Additional Information

https://sites.google.com/vt.edu/bioenergy-emissions-abatement/home

Acknowledgements

This summary is based on work supported by the Natural Resources Conservation Service, U.S. Department of Agriculture, under #69-2037-18-006

Videos, Slideshows and other Media

1. https://youtu.be/tQAirjhxAs4

2. https://cdnapisec.kaltura.com/html5/html5lib/v2.75.3/mwEmbedFrame.php/p/2375811/uiconf_id/41950442/entry_id/1_3nrpmniy?wid=_2375811&iframeembed=true&playerId=kaltura_player&entry_id=1_3nrpmniy&flashvars[streamerType]=auto&flashvars[localizationCode]=en&flashvars[leadWithHTML5]=true&flashvars[sideBarContainer.plugin]=true&flashvars[sideBarContainer.position]=left&flashvars[sideBarContainer.clickToClose]=true&flashvars[chapters.plugin]=true&flashvars[chapters.layout]=vertical&flashvars[chapters.thumbnailRotator]=false&flashvars[streamSelector.plugin]=true&flashvars[EmbedPlayer.SpinnerTarget]=videoHolder&flashvars[dualScreen.plugin]=true&flashvars[hotspots.plugin]=1&flashvars[Kaltura.addCrossoriginToIframe]=true&&wid=1_1q37mw14#

3. https://cdnapisec.kaltura.com/html5/html5lib/v2.75.3/mwEmbedFrame.php/p/2375811/uiconf_id/41950442/entry_id/1_cdnhswma?wid=_2375811&iframeembed=true&playerId=kaltura_player&entry_id=1_cdnhswma&flashvars[streamerType]=auto&flashvars[localizationCode]=en&flashvars[leadWithHTML5]=true&flashvars[sideBarContainer.plugin]=true&flashvars[sideBarContainer.position]=left&flashvars[sideBarContainer.clickToClose]=true&flashvars[chapters.plugin]=true&flashvars[chapters.layout]=vertical&flashvars[chapters.thumbnailRotator]=false&flashvars[streamSelector.plugin]=true&flashvars[EmbedPlayer.SpinnerTarget]=videoHolder&flashvars[dualScreen.plugin]=true&flashvars[hotspots.plugin]=1&flashvars[Kaltura.addCrossoriginToIframe]=true&&wid=1_mets5wc5#


The authors are solely responsible for the content of these proceedings. The technical information does not necessarily reflect the official position of the sponsoring agencies or institutions represented by planning committee members, and inclusion and distribution herein does not constitute an endorsement of views expressed by the same. Printed materials included herein are not refereed publications. Citations should appear as follows. EXAMPLE: Authors. 2022. Title of presentation. Waste to Worth. Oregon, OH. April 18-22, 2022. URL of this page. Accessed on: today’s date.

Air Quality Issues at Livestock Facilities

Abstract

Confinement and concentration of livestock and poultry production decades ago exacerbated nuisance and health effects caused by emissions of odor, particulate matter (dust) and gases from animal manure. Concern about health effects on animals and farm workers are due to potential exposure to high concentrations of various noxious gases and particulate matter. People downwind of production facilities and land application of manure are concerned about both nuisance odor and health effects, resulting in lawsuits, community protests, government regulations, and state and federal consent decrees and agreements. Besides the chronic issue of odor, livestock production’s emissions of ammonia, hydrogen sulfide, volatile organic compounds, greenhouse gases, and bioaerosols have also created potential problems depending on livestock species, site location, and facility design, and management. Major technical air quality issues facing livestock producers are: 1) obtaining suitable sites for new facilities, 2) selecting effective and practical mitigation methods, if necessary, 3) obtaining reliable and economical on-farm measurements of pollutant concentrations and emissions, 4) estimating pollutant emission rates at their farms, and 5) managing manure to minimize impacts of pollutant emissions.


The authors are solely responsible for the content of these proceedings. The technical information does not necessarily reflect the official position of the sponsoring agencies or institutions represented by planning committee members, and inclusion and distribution herein does not constitute an endorsement of views expressed by the same. Printed materials included herein are not refereed publications. Citations should appear as follows. EXAMPLE: Authors. 2022. Title of presentation. Waste to Worth. Oregon, OH. April 18-22, 2022. URL of this page. Accessed on: today’s date.

Odor Emissions from Typical Animal Production Farms in Ohio

Purpose

Odor emissions from animal feeding operations (AFOs) remain a significant nuisance issue. Some neighboring communities of AFOs have complained that odor degraded their quality of life and well-being. Odor is a subjective response of humans, and the perception of odor varies significantly among people. Farmers may have been used to the farm smells and do not feel odor offensive. However, people with no farming background may be sensitive to odor and experience many different physiological and psychological responses to odor.

Unbiased scientific assessments are needed to resolve conflicts among farmers and neighboring communities and make objective and informed decisions about best management practices for odor mitigation in animal productions. Due to the complication and high cost of odor measurement, limited odor data are available to facilitate scientific understanding and develop effective mitigation of the odor concerns. The presentation reports on-farm odor sampling methods, measurement of odor concentrations in labs, and estimation of odor emission rates (ERs) for representative animal production farms in Ohio.

What Did We Do

Over the past decades, we have developed many research and extension projects to evaluate air quality and emissions at typical Ohio farms through seasonal on-farm sampling and monitoring measurement. The farms include swine, dairy, and poultry layer farms. Odorous air was sampled into 10-L Tedlar bags using a SKC-Vac-U-Chamber (SKC Inc., 863 Valley View Road, Eighty-Four PA 15330). The odor samples were shipped to the odor lab at Purdue University within 30 h of collection for measurement of odor concentrations (OUE m-3) using a dynamic olfactometer (AC’SCENT International Olfactometer, St. Croix Sensory, Inc., Stillwater, MN, USA).

When it was feasible to measure ventilation rates of animal facilities, the ventilation rate data along with the odor concentration data were used to estimate odor emission rate from the animal facilities. Further, the odor concentration and emission data were analyzed to identify correlation with environmental conditions and other air pollutant emissions, such as ammonia emission, to seek effective management practices for odor control.

What Have We Learned

Odor sources are animals and their manure and therefore can be physically associated with animal buildings, manure storages, and fields of manure land application. Different animal operations result in significantly different odor levels and liquid manure management practices are associated with higher odor levels.

The odor characteristics of layer house exhaust air were strongly associated with layer manure characteristics. The annual mean odor concentration was quantified as 355 ± 112 OUE m-3, and the annual mean odor emission rate was estimated as 0.14 ± 0.11 OUE s-1 hen-1for two manure-belt layer houses in Midwest region.

Significant seasonal variations were observed in odor concentrations inside the layer houses with high concentrations in summer and winter. The odor emission rates were the lowest in spring, but not significantly different in summer, fall, and winter.

House ventilation rate significantly affected odor emission rates, with higher ventilation rates corresponding to higher odor emissions. Ammonia concentration and emission rate inside the layer houses were significantly and positively correlated with the odor concentrations and emission rate.

Odor concentrations decrease exponentially as distances from the sources increase. Odor dispersion is affected by many factors. The data analysis also indicated seasonal and spatial variations in odor levels on farms, and the times and places that effective mitigation is needed. Measurements of odor are fundamentally important to understand odor concerns, develop estimation tools and effective mitigation.

Future Plans

Continue to develop odor mitigation management practices and technologies and tools to predict odor emission and dispersion from animal feeding operations.

Authors

Lingying Zhao, Professor and Extension Specialist, The Ohio State University
zhao.119@osu.edu

Additional Authors

-Glen Arnold, Assoc. Professor and Extension Field Specialist, The Ohio State University
-Mike Brugger, Faculty Emeritus, The Ohio State University
-Roger Bender, Former OSU Extension Educators. The Ohio State University
-Gene McClure, Former OSU Extension Educators. The Ohio State University
-Eric Immerman, Former OSU Extension Educators. The Ohio State University
-Albert Heber, Professor Emeritus, Purdue University
-JiQin, Ni, Professor, Purdue University

Additional Information

Airquality.osu.edu

Zhao, L.Y., L.J. Hadlocon, R. B. Manuzon, M. J. Darr, X. Tong, A.J. Heber, and J.Q. Ni. 2015. Odour concentrations and emissions at two manure-belt egg layer houses in the U.S. J.Q. Ni, T.T. Lim, C. Wang (Eds.). In Animal Environment and Welfare–Proceedings of International Symposium (pp 42-49). Rong Chang, China, October 23-26th.

Acknowledgements

The air quality survey studies on Ohio farms were supported by the internal SEED grants of the Ohio Agricultural Research and Development Center, College of Food, Agricultural and Environmental Sciences, The Ohio State University.

The poultry layer house study was supported by the National Institute of Food and Agriculture, U.S. Department of Agriculture, under award number 2005-35112-15422.

Appreciation is also expressed to the participating producers and staff for their collaboration and support.


The authors are solely responsible for the content of these proceedings. The technical information does not necessarily reflect the official position of the sponsoring agencies or institutions represented by planning committee members, and inclusion and distribution herein does not constitute an endorsement of views expressed by the same. Printed materials included herein are not refereed publications. Citations should appear as follows. EXAMPLE: Authors. 2022. Title of presentation. Waste to Worth. Oregon, OH. April 18-22, 2022. URL of this page. Accessed on: today’s date.

Conservation Planning for Air Quality and Atmospheric Change (Getting Producers to Care about Air)

Purpose

The United States Department of Agriculture-Natural Resources Conservation Service (USDA-NRCS) works in a voluntary and collaborative manner with agricultural producers to solve natural resource issues on private lands. One of the key steps in formulating a solution to those natural resource issues is a conservation planning process that identifies the issues, highlights one or more conservation practice standards that can be used to address those issues, and allows the agricultural producer to select those conservation practices that make sense for their operation. In this conservation planning process, USDA-NRCS looks at natural resource issues related to soil, water, air, plants, animals, and energy (SWAPA+E). This presentation focuses on the resource concerns related to the air resource.

What Did We Do

In order to facilitate the conservation planning process for the air resource, USDA-NRCS has focused on five main issues: emissions of particulate matter (PM) and PM precursors, emissions of ozone precursors, emissions of airborne reactive nitrogen, emissions of greenhouse gases, and objectionable odors. Each of these resource concerns are further subdivided into resource concern components that are mainly associated with different types of sources or activities found on agricultural operations. By focusing on those agricultural sources and activities that have the largest impact on each of these air quality and atmospheric change resource concerns, USDA-NRCS has developed a set of planning criteria for determining when a resource concern exists. We have also identified those conservation practice standards that can be used to address each of the resource concern components.

What Have We Learned

Our focus on the agricultural sources and activities that have the largest impact on air quality has helped to evolve the conservation planning process by adding resource concern components that are targeted and simplified. This approach has led to a clearer definition of when a resource concern is identified, as well as how to address it. For example, the particulate-matter focused resource concern has been divided into the following resource concern components: diesel engines, non-diesel engine combustion equipment, open burning, pesticide drift, nitrogen fertilizer, dust from field operations, dust from unpaved roads, windblown dust, and confined animal activities. Each of these types of sources can produce particles directly or gases that contribute to fine particle formation. In order to know whether a farm has a particulate matter resource concern, a conservation planner would need to determine whether one or more of these sources is causing an issue. Once the source(s) of the particulate matter issue is identified, a site-specific application of conservation practices can be used to resolve the resource concern.

We expect that increased clarity in the conservation planning process will lead to a greater understanding of the air quality and atmospheric change resource concerns and how agricultural producers can reduce air emissions and impacts. Simple and clear direction should eventually lead to greater acceptance of addressing air quality and atmospheric change resource concerns.

Future Plans

USDA-NRCS will continue to refine our approach to addressing air quality and atmospheric change resource concerns. As we gain a greater scientific understanding of the processes by which air emissions are generated and air pollutants are transported from agricultural operations, we can better target our efforts to address these emissions and their resultant impacts. Internally, we will be working throughout our agency to identify those areas where we can collaboratively work with agricultural producers to improve air quality.

Authors

Greg Zwicke, Air Quality Engineer, USDA-NRCS National Air Quality and Atmospheric Change Team
greg.zwicke@usda.gov

Additional Authors
Allison Costa, Air Quality Engineer, USDA-NRCS National Air Quality and Atmospheric Change Team

Additional Information

General information about the USDA-NRCS can be found at https://www.nrcs.usda.gov. An overview of the conservation planning process is available at https://www.nrcs.usda.gov/wps/portal/nrcs/detail/national/programs/technical/cta/?cid=nrcseprd1690815.

The USDA-NRCS website for air quality and atmospheric change is https://www.nrcs.usda.gov/wps/portal/nrcs/main/national/air/.


The authors are solely responsible for the content of these proceedings. The technical information does not necessarily reflect the official position of the sponsoring agencies or institutions represented by planning committee members, and inclusion and distribution herein does not constitute an endorsement of views expressed by the same. Printed materials included herein are not refereed publications. Citations should appear as follows. EXAMPLE: Authors. 2022. Title of presentation. Waste to Worth. Oregon, OH. April 18-22, 2022. URL of this page. Accessed on: today’s date.

Assessing the implications of chloride from land application of manure for Minnesota waterways

Purpose

Rising chloride contamination in ground and surface waters is a growing concern in Minnesota. Previous studies estimate 87% of the chloride load originated from road salts, fertilizers, and wastewater treatments plants, and 6% from livestock manure. However, these estimates may be outdated as the livestock industry and manure application practices have evolved since these estimates of manure chloride concentrations were calculated in 2004. It also remains unclear how varying soil types affect the movement of chloride leaching following manure application. The aim of this study is to understand the movement of manure-based chloride from liquid and solid manures in Minnesota soils through a series of intact core leaching studies. Specifically, this project examines the magnitude of chloride leaching from swine and turkey manure application and compares it with synthetic potassium chloride fertilizer and a no nutrient control. The soil cores represent fine and medium textured soil.

What Did We Do?

    • Collected 24 12-inch soil columns from medium and fine-textured soils in Minnesota (Figure 1).
    • Collected swine and turkey manure from Minnesota farms
    • Analyzed soil pre- and post-leaching study for nutrient analysis (Cl, Bray P, NH4+, NO3, K, Organic Matter, pH, and Exchangeable Ca, Mg, Na, K)
    • Analyzed manure samples for nutrient analysis pre-application (Total N, P2O5, K2O, Cl)
    • Added water to cores until they reached field capacity
    • Applied manure using N-based application rates, and fertilizer using a K-based rate to 3 replicates
    • Simulated 2-in rainfall events on days 4, 12, and 18 post nutrient application
    • Collected and analyzed leachate for Cl, NH4+-N, and NO3-N
Figure 1: Setup of 12-inch PVC soil cores for leaching study

What Have We Learned?

    • How chloride concentration varies based on manure type and species
    • How the total amount of chloride applied via fertilizer application to cores varies by treatment
    • How manure-based chloride moves through soil
    • How fine and medium textured soil influences the movement of manure-based chloride
    • How chloride storage changed by soil type following the experiment (Figure 2)
      1. Medium textured soils had a greater change in chloride storage in both top and bottom layers compared to fine textured soils
      2. Manure additions increased chloride storage in both medium and fine textured soils
      3. Control soil cores experienced a loss in chloride storage following leaching
Figure 2: Change in soil chloride storage in each medium textured (left) and fine textured (right) soils by treatment. Positive values indicate a net gain in soil chloride, while negative values indicate a net loss in soil chloride following leaching.
Table 1: Total Cl concentration of liquid swine manure (lbs/1000 gallons), solid turkey litter, and synthetic KCl (lbs/ton) followed by total weight (g) of Cl added per core via application.
Treatment

Cl (lbs/1000 gallons)

Cl (lbs/ton)

Cladded per core (g)

Liquid

26

1.49

Solid

2.7

0.179

KCl

940

0.576

Control

0

0

Future Plans

Our group would like to complete a second round of this study the following year on newly identified liquid and solid manure and an additional coarse textured soil type. Future attempts in creating chloride-based mass balances for the state of Minnesota will benefit from this study.

Authors

Matthew Belanger, Graduate Research Assistant, Dept of Soil, Water, and Climate, University of Minnesota

Corresponding author email address

belan081@umn.edu

Additional authors

Dr. Erin L. Cortus, Associate Professor and Extension Engineer, Dept of Bioproducts and Biosystems Engineering, University of Minnesota

Dr. Gary W. Feyereisen, Research Agricultural Engineer, USDA-ARS Soil & Water Mgt. Research Unit

Nancy Bohl Bormann, Graduate Research Assistant, Dept of Soil, Water, and Climate University of Minnesota

Dr. Melissa L. Wilson, Assistant Professor and Extension Specialist, Dept of Soil, Water, and Climate, University of Minnesota

Additional Information

Wilson Manure Management and Water Quality Lab Site

Acknowledgements

This project is funded through the University of Minnesota Water Resource Center’s Watershed Innovation Grants Program. We’d also like to thank Scott Cortus, Eddie Alto, Todd Schumacher, Dr. Pedro Urriola, and Thor Sellie for their assistance.

Assessment of method of photo analysis for demonstrating soil quality

Purpose

The use of livestock manure as a soil amendment to benefit soil health by improvements to soil physical, chemical, and biological properties, has been documented. However, quantification of the impact of improved soil health metrics on nutrient cycling has lagged. The soil your undies experiment has been implemented in the past to visually demonstrate microbial activity (Figure 1). However, this demonstration is seldom quantified, and does not have the capacity to statistically show that the effects of different management practices are distinct. The goal for this study was to quantify the degradation of fabric on a similar experiment, using cotton fabric on agricultural soils through photographic editing software. This study was designed to assess a visual method for quantifying carbon cycling in soil, observed through the degradation of buried organic materials.

Figure 1. Soil your undies soil health demonstration. Credit Clackamas Soil and Water Conservation District.

What Did We Do?

White, 100% cotton fabric cloths were cut into 29.21 × 29.84 cm (871.62 cm2) (11.5 x 11.75 in, 135 in2) pieces and placed flat inside a non-degradable mesh bag (48 cm × 48 cm, 18.9 in x 18.9 in). Sixty of the mesh bags were buried at 5 cm (2 in) depth in a field planted with corn in May of 2021 (Figure 2). The sixty bags were arranged in 12 plots to which one of three soil treatments (swine slurry, swine slurry + woodchips, and control plots with no amendments) with four replications per treatment were also applied. Swine slurry was applied at a rate of 39,687.06 L-ha-1 (4,242 gal-ac-1) and woody biomass was applied at a rate of 21.52 Mg-ha-1 (9.6 tons-ac-1).

Figure 2. Fabric and mesh bag burial in research plots

Five times during the growing season (25, 54, 81, 99 and 128 days after establishment), one bag was retrieved from each plot and returned to the lab for analysis. For each bag, soil was gently removed from the surface of the mesh and then the bag was cut open to observe the cotton fabric remaining. All the fabric pieces were photographed after retrieval. Photographs of the fabric were taken with an iPad mounted on a tripod. Fabric samples were photographed in a premeasured area of 29.21 × 29.84 cm (11.5 x 11.75 in) on a black surface (Figure 3).

Figure 3. Fabric sample placement inside pre-measured area (29.21 × 29.84 cm) for photographing

Manual evaluation of percent fabric degradation for each sample was performed by overlaying a clear plastic grid (Figure 4) with primary graduations (darker lines) of 2.54 cm (1 in) and secondary graduations (lighter lines) of 6.4 mm (0.25 in) on fabric samples and counting grid squares that were void of fabric.

Figure 4. Grid overlayed on fabric sample for manual evaluation of percent fabric degradation

Each photograph was assessed using Adobe Photoshop 2020 and the free license program ImageJ. Briefly, each image was opened in the respective program and the initial fabric area (871.62 cm2) (135 in2) was delineated in the program, based on the premeasured area included in the photo to set a scale for the degradation measurement. The image was converted to black and white, and brightness and contrast were adjusted as needed to remove glare on the black background that might be misread by the program as fabric. Then, all the pixels within a specific color range – which was previously defined as fabric – were selected using the native editing tools in the two programs and this area was compared to the pixels in the initial fabric area to determine the percentage of fabric remaining.

What Have We Learned?

The three methods for estimating the area of the fabric did not show significant differences among each other, which means estimates of fabric degradation obtained with Photoshop and Image J accurately reflect manual hand counts, suggesting that these are reliable visual methods for determining the area of the remaining area of fabric (Figure 5, 6).

Figure 5. Linear regression model for degradation estimation via Photoshop relative to degradation value obtained by hand count
Figure 6. Linear regression model for degradation estimation via ImageJ relative to degradation value obtained by hand count

Future Plans

Future work will seek to validate this method according to standard measures of soil health and biological activity and ensure that the method has enough sensitivity to demonstrate statistical differences between soil treatments. Future studies should also focus on making the process of area estimation with the software an easier, less laborious process. Creating a cellphone app to determine degradation quickly and without the need for a computer could increase the adoption of the fabric degradation assessment method in field settings.

Authors

Amy Schmidt, Associate Professor, University of Nebraska-Lincoln

Corresponding author email address

aschmidt@unl.edu

Additional authors

Karla Melgar Velis, Graduate Research Assistant, University of Nebraska-Lincoln

Mara Zelt, Research Technologist, University of Nebraska-Lincoln

Andrew Ortiz Balsero, Undergraduate Research Assistant, University of Nebraska-Lincoln

Acknowledgements

Funding for this study was provided by the Nebraska Environmental Trust and Water for Food Global Institute at the University of Nebraska-Lincoln. Much gratitude is extended to collaborating members of the On-Farm Research Network, Nebraska Natural Resource Districts, Nebraska Extension Agents and Michael Hodges and family for providing the land, manure, and effort for this research project. Much appreciation to members of the Schmidt Lab who supported field and laboratory work: Juan Carlos Ramos Tanchez, Nancy Sibo, Andrew Lutt, Seth Caines and Jacob Stover.

Experience of Removing and Land Application of Lagoon Solids

Purpose

Manure lagoon systems are designed to hold and treat animal farm wastewater for a predetermined period and remain popular in many livestock farms. If the lagoon is properly designed and built, many years can go by without any significant maintenance requirements outside of water management, pumps and valves. Depending on the capacity and maintenance, additional manure solid removal is often required to reduce the amount of manure solids entering the lagoon storage. When excessive solids build-up or sludge was found, significant odor and low quality/quantity of flushing water would be the issues.

This study documents experience to prepare for and complete land application of lagoon effluent with heavy solids from a flush dairy lagoon in central Missouri. The free stall barn uses mattress bedding with supplemental cedar shavings and houses 140-160 lactating cows. Preparation included measuring lagoon sludge depth and lab analysis of sludge characteristics and scouting for crop fields for land application prior to contacting contractors for a bidding process. A contractor team utilized specialized equipment to dilute, agitate, pump and land apply approximately 8 million gallons of diluted lagoon solids in less than nine working days. Lagoon effluent was sampled throughout the process to monitor the mass of nutrients applied to specific plots of land. For effective lagoon solids removal and land application, proper preparation, specialty equipment and trained professional, timing of the crop fields, and adequate field working days are critical. Simple, non-mechanical technologies are available for even small to midsize dairy farms to reduce the cost of lagoon maintenance by preventing the bulk of solids from entering the lagoon.

What Did We Do?

We documented the process of lagoon solids removal for land application, considering the preparation (sludge and effluent sampling), specialty equipment and trained professionals, timing of the crop fields, and adequate field working days. The barn was flushed two to three times per day, with three times per day being typical. There was, at one time, an elevated screen that helped remove the large solids from the flush, but the screen system fell into disrepair several years ago and was abandoned. Solids in the lagoon were agitated and pumped out from May 21, 2020, through June 8, 2020, Figures 1 and 2. A total of 8 million gallons over 280 acres was applied to fields further away from the lagoon, including neighbor’s crop fields that were 1.5 miles away. Equipment needs and specifications were documented (Canter et al., 2021) and being prepared for an Extension publication.

Figure 1. PTO-drive lagoon agitators and agitation boat in operation.
Figure 2.  A dilution pump was used to pump water from the nearby lake (left) to the dairy lagoon (right) with agitation boat and lagoon agitation working in the background.

Daily lagoon effluent samples were taken multiple samples throughout the day on June 2 to gauge the consistency of nutrient concentrations. Results suggest that once completely mixed via agitation, the applied nutrient concentration from a single sample is a reliable estimate within a working day if the moisture content is consistent. The initial slurry had a 10-13 percent solids content, so a significant amount of dilution water was needed to dilute the solids content to the target range. The exact amount of dilution water used was unknown. Figure 3 shows the concentration and moisture data. In general, the higher the moisture content (less solids) in the slurry samples, the higher the concentrations of the important manure nutrients are. The team evaluated potential technologies based on historical experience and first-person interviews. A pull-plug sediment basin (PPSB) was selected after reviewing cost and visiting with a farmer who operated a PPSB and was satisfied with the overall operation and performance (Canter et al., 2021). The application rate of important manure nutrients did show variation during the several days of land application, suggesting an improvement to the real-time effluent nutrient measurement and land application rate adjustment could be improved to provide more consistent nutrients to the crop fields.

Figure 3. Concentrations and moisture content of slurry samples from the lagoon.

What Have We Learned?

Manure management can be a burden for animal feeding operations, which can potentially become a significant threat to the profitability and management of farms if not proactively managed. Owners would be well-advised to survey their lagoon yearly to track solid inventory and plan ahead for the amount of land needed for solids application. Proper solids removal from the lagoon, particularly if regular and effective solids removal has been neglected, requires specialized equipment to reduce liquid supernatant on an annual or semiannual basis. There can be significant variability of nutrient concentration and resulting mass applied. Testing for nutrient concentrations in the lagoon, whether supernatant or sludge, or both, can be misleading due to variance in concentrations due to moisture content as the applicators dilute and concentrate the solids during the land application process.

Daily sampling during land application could help but may not be practical due to the analysis time generally required by labs (5-10 business days). Sensors and probes are available that return instantaneous values and have been used in municipal and industrial wastewater treatment for over a decade. Companies have offered integrated sensors for land application equipment, combining them with their GPS and flow control system to give a complete and accurate summary of nutrient application. Simple, non-mechanical technologies are available for even small to midsize dairy farms to reduce the cost of lagoon maintenance by preventing the bulk of non-degradable solids from entering the lagoon. Implementation of a coarse solids separation system such as the PPSB could significantly reduce the long-term cost of manure management by allowing the operator to use more common equipment (e.g., a loader and spreader) to remove solids from the manure management system.

Future Plans

Continuous monitoring of the lagoon sludge level at a minimum of annual basis is needed to closely monitor the lagoon solid accumulation and performance of the PPSB. The authors are collaborating with NRCS team to improve the PPSB and ways to monitor the lagoon sludge level.

Authors

Teng Lim, Extension Professor, Agricultural Systems Technology, University of Missouri

Corresponding author email address

Limt@missouri.edu

Additional authors

Timothy Canter, Extension Specialist, Agricultural Systems Technology, University of Missouri

Joseph Zulovich, Extension Assistant Professor, Agricultural Systems Technology, University of Missouri

Additional Information

    1. Canter, T., Lim, T.-T., and J. A. Zulovich. 2021. Field Experience of Removing and Land Application of Dairy Lagoon Solids. In International Symposium on Animal Environment and Welfare. Rongchang, Chongqing, China.
    2. Lim, T.-T. 2022. Lagoon Solids Removal, Lessons Learned. Cleanout for Lagoons and Anaerobic Digesters, Jan 21, 2022. Webinar of Livestock and Poultry Environmental Learning Community (LPELC). https://lpelc.org/cleanout-for-lagoons-and-anaerobic-digesters/
    3. Canter, T., Lim, T.-T., Chockley, T. 2021. Considerations of Pull-Plug Sedimentation Basin for Dairy Manure Management. University of Missouri Extension Publication. Retrieved September 25, 2021. https://extension.missouri.edu/publications/eq302.

Acknowledgements

USDA NIFA, Water for Food Production Systems Program A9101, for supporting the project. It is titled “Management of Nutrients for Reuse”, a multi-faceted project that involves professionals from the University of Arkansas, University of Nebraska, Colorado School of Mines and Metallurgy, Case Western University, and University of Missouri.

Joe Harrison, Professor, Livestock Nutrient Management program, Washington State University

Gilbert Miito, Postdoctoral Fellow, Agricultural Systems Technology, University of Missouri

Richard Stowell, Biological Systems Engineering, University of Nebraska

Farm crew and custom applicator team for their help.