
This webinar will examine how black soldier fly larvae (BSFL) can transform food and agricultural waste into valuable products for both animal feed and soil health. Presenters will discuss large-scale BSFL production, the frass co-product, and how nutrient content can vary based on inputs and processing. This presentation was originally broadcast on August 15, 2025. Continue reading “Flies, Frass, Feces, and Fields”
Augmenting sustainability through bioenergy generation using aquaponics production wastes
Purpose
With a rapid increase in global population, food security has become a significant concern. This has led to a significant rise in the demand for protein rich sustainable food. Therefore, worldwide tilapia cultivation is being seen as one of the most economical paths to meet the demand of protein rich food. Moreover, with increasing urbanization and pressing need of nutrient circularity, cost reduction and sustainability has driven the concept of aquaponics system, integrating aquaculture with hydroponics.
Aquaponics has gained significant demand both in the USA and globally and is postulated to reduce overall cost and land footprint, while simultaneously recycling the nutrients in a closed system. Further integration of an anaerobic digestion (AD) system for biogas production using aquaponics waste can make the aquaponic system energy resilient and environmentally sustainable. Therefore, the purpose of this study is to investigate the potential of various aquaponics waste for biogas production, and their fate under co-digestion.
What Did We Do?
In this study, aquaponics waste viz., aquaponic sludge, and lettuce roots and leftover leaves after harvesting were obtained as AD substrate from the aquaponic test bed, running under controlled conditions at Purdue University. A centroid simplex design was created to test the biochemical methane potential (BMP) of the substrate under co-digestion. The BMP test was performed in 1.2-L BMP anaerobic digesters, which have a working volume of 1 L. Dairy manure-based digestate obtained from a continuously running industrial digester was used as an inoculum. For all the test groups, substrate to inoculum ratio was maintained at 1:3. All the test groups were set up in triplicates, and the digesters were incubated in the water bath at 37 °C for 30 days. Biogas volume was measured daily using a syringe method.
What Have We Learned?
The study results showed that the aquaponic sludge and lettuce leaves fed in the anaerobic digesters at a ratio of 50:50 on volatile solids (VS) basis had the highest specific methane yield of 0.525 m3 kg-1 VS. However, the lettuce roots showed an antagonistic effect on co-digestion, giving a specific biogas yield of 0.173 m3 kg-1 VS. The results indicate that enhanced methane yields can be achieved by co-digesting aquaponic sludge with farm residues in an appropriate ratio.
Future Plans
This study is part of a USDA research project to develop sustainable blue food systems driven by integrated aquaponics. Further efforts in AD of aquaponics waste are planned to mitigate the inhibitory effect of lettuce roots on co-digestion, so all aquaponics farm residues can be optimally utilized, simultaneously addressing waste management and generating nutrient-rich digestate as a biofertilizer for aquaponic crops. This approach can transform organic waste from aquaponics and plant harvesting into renewable energy, offsetting external energy needs and reducing the environmental footprint.
Authors
Presenting & corresponding author
Ji-Qin Ni, Professor, Agricultural and Biological Engineering, Purdue University, Jiqin@purdue.edu
Additional authors
Mohit Singh Rana, Postdoctoral Research Associate, Purdue University
Rajesh Nandi, Ph.D. student, Purdue University
Additional Information
Web: https://ag.purdue.edu/department/foodsci/big-project/index.html
Instagram: https://www.instagram.com/whenblueisgreenproject?igsh=MTF5a2xsdmppbWE0
X: https://twitter.com/WBlueIsGreen?_ga=2.200172589.2080482534.1739499225-1469780589.1739498857
Acknowledgements
This research was supported by the intramural research program of the U.S. Department of Agriculture, National Institute of Food and Agriculture, Agriculture and Food Research Initiative grants no. 2023-68012-39001.
The authors are solely responsible for the content of these proceedings. The technical information does not necessarily reflect the official position of the sponsoring agencies or institutions represented by planning committee members, and inclusion and distribution herein does not constitute an endorsement of views expressed by the same. Printed materials included herein are not refereed publications. Citations should appear as follows. EXAMPLE: Authors. 2025. Title of presentation. Waste to Worth. Boise, ID. April 7-11, 2025. URL of this page. Accessed on: today’s date.
The Circular Bioeconomy
Purpose
The “Circular Bioeconomy” seems to be everywhere these days. The American Society of Biological and Agricultural Engineers (ASABE) created a Circular Bioeconomy Systems Institute. The Water Environment Federation (WEF) sponsored a Circular Water Economy Summit. I’m on an email list called “In the Loop with EPA: Circular Economy Updates”. Even my old alma mater, the University of Arkansas, announced a position for an Assistant Professor in Engineering for the Circular Economy.
In the midst of all this, I am sensing a backlash from my colleagues. There is a rising attitude of, “isn’t this just a new name for what we’ve been doing all along?” True, but the Circular Bioeconomy is a bona fide environmental concept, one rooted in a process evolving for at least four and a half billion years on planet earth – Nature itself. We Waste to Worth folks should embrace the Circular Bioeconomy. We should proudly say, “This is what I do.”
What Did We Do?
So, what is the Circular Bioeconomy?
Here lies the problem. The terms “circular economy” and “bioeconomy” are interpreted by different groups to mean different things, leading to confusion and cynicism. Perhaps the clearest way to define the Circular Bioeconomy is to state what it is not. A circular bioeconomy is not a linear “take-make-waste” economy based on extraction of limited resources. The Circular Bioeconomy is an aspiration, a transition to a nature-based economy centered on sustainability.
What Have We Learned?
How can we explain what we do in the Circular Bioeconomy to the public we serve?
Most of the people attending this conference already work in “the bioeconomy” — either in agriculture, forestry, fisheries, or natural resource conservation. The place to start is with circularity. The universe you and I inhabit works in cycles. The second law of thermodynamics is “water flows downhill.” The law of nature is “energy flows and materials circulate.”
Translating this simple concept can get complicated quickly. There are numerous qualitative descriptors for various aspects of circularity, and an attempt to quantify circularity is in its infancy.
Future Plans
So, take a step back and focus on the central truth. What is true for the water cycle, is true for nutrient cycles, is true for agriculture, is true for the power grid, and these are all interconnected.
Plants use solar energy and transpire water vapor to the atmosphere. Energy is released through condensation. Rain falls on the earth and rivers flow to the sea. Water vapor travels on prevailing winds…
Soil microorganisms use energy contained in organic matter for growth. Microorganisms release nutrients for crops to grow. Crops are eaten by livestock and poultry. Animals of all species produce manure rich in organic matter and nutrients…
round and round …
sustainably.
Presenting and Corresponding author
Douglas W. Hamilton, Ph.D., P.E., Associate Professor and Waste Management Specialist, Oklahoma State University, dhamilt@okstate.edu
Additional Information
An Analysis of Poultry Litter Purchases in South Carolina
Purpose
Poultry production is the number one agricultural enterprise in value of production for South Carolina with approximately 280,000,000 birds in inventory. Poultry litter as a by-product of poultry production is a low-cost fertilizer that can provide nitrogen (N), phosphorus (P), potassium (K), and micronutrients for forage systems. Poultry litter can improve soil fertility and health by adding organic matter and enhancing water infiltration and soil fertility over time on more than 300,000 acres of forages in South Carolina.
Yet, despite purported benefits to the pasture system and use as a fertilizer to improve forage, questions remain for livestock producers looking to apply poultry litter to their pastures. There is a lack of information about the availability, cost, and quality of litter. With the increase in interest in poultry litter applications as a climate-smart agricultural practice or to participate in conservation programs, this work is expected to assist regional producers in understanding poultry litter attributes and inform purchasing decisions.
What Did We Do?
Using a dataset of 68 producers utilizing poultry litter and the corresponding transactions, we characterize the availability and market for poultry litter in South Carolina. Data on transactions, including prices paid, delivery date, application rate, and county-level location of litter, forms the basis for analysis. Also, we use sample analysis results to compare nutrient price with commercial fertilizer nutrient values.
What Have We Learned?
Of the 68 producers reporting data, 45 reported detailed price, location and application information. An exploration of prices paid per ton of litter across the state suggests differences based on location (Table 1). Based on the results of a t-test, higher prices are observed for the mid-state compared to the upstate (statistically significant at 6% level for two tail t-test). Differences in prices observed by season appear but are not statistically significantly different based on ANOVA tests.
| Midstate (n=20) | Upstate (n=25) | Average | |
| Fall | 25.55 | 22.32 | 23.30 |
| Spring | 32.13 | 22.55 | 28.02 |
| Summer | 22.31 | — | 22.31 |
| Winter | — | 19.33 | 19.33 |
| Average | 27.37 | 22.02 | 24.40 |
Other findings from the data could be helpful to design outreach and assist producers looking to purchase litter for their operation. Some other interesting information includes the type of litter: broiler, layer, turkey, and other sources. Also, of the producers in the sample, 19 were unable to find litter with the majority of producers located in the Upstate area (74%).
Next, for the approximately 40 samples that included nutrient analysis, a summary of mean and standard deviation of pounds per ton of ammonium N, organic N, P205 and K20 are given in Table 2. From prices reported by each producer, the cost per pound of nutrient is also calculated. From here, average fertilizer and nutrient prices were gathered for South Carolina and displayed in Table 3. Similar costs can be seen when comparing the average cost per pound for each nutrient (Table 2) to the average price per pound for commercial fertilizers (Table 3). For example, the average cost of a pound of ammonium N from the poultry litter sources was $2.46/lb and $2.45/lb from commercial sources.
| Nutrients | ||||
| Ammonium N (lbs./ton) | Organic N (lbs./ton) | P205 (lbs./ton) | K20 (lbs./ton) | |
| n | 41 | 40 | 42 | 42 |
| mean | 10.04 | 50.21 | 47.15 | 51.65 |
| std dev | 3.93 | 15.09 | 20.41 | 21.04 |
| $/# | $2.46 | $0.49 | $0.52 | $0.48 |
| South Carolina Average Fertilizer Prices FY2024 | ||||
| DAP (18%-46%-0%) | Urea (46%) | 10-10-10 | Potash (60%) | |
| Mean | $881.00 | $504.45 | $489.00 | $482.45 |
| Std. Dev. | $8.02 | $13.30 | $5.72 | $13.05 |
| N ($/#) | $2.45 | $0.55 | $2.45 | $0.00 |
| P ($/#) | $0.96 | $0.00 | $2.45 | $0.00 |
| K ($/#) | $0.00 | $0.00 | $2.45 | $0.40 |
Source: South Carolina Crop Production Report (Monthly), Livestock, Poultry, and Grain Market News, USDA Agricultural Marketing Service.
Future Plans
Findings and data from this analysis will first be prepared for outreach and dissemination efforts to producers across the state. Information will also be summarized for current enrollees in the grant program. Finally, given that this data was collected as part of a five-year study, data will be collected in subsequent years. Ultimately, a hedonic analysis of poultry litter attributes to help understand differences in price as a result of nutrient attributes, storage conditions, type, and trucking could inform producer sourcing of litter and prices paid.
Authors
Presenting & corresponding author
Nathan B. Smith, Extension Economist, Clemson University, nathan5@clemson.edu
Additional authors
Anastasia W. Thayer, Assistant Professor, Clemson University; Matthew Fischer, Extension Associate, Clemson University; Maggie Miller, Extension Associate, Clemson University.
Additional Information
https://www.climatesmartsc.org/
Acknowledgements
This material is based upon work supported by the U.S. Department of Agriculture, under agreement number NR2338750004G049.
The authors are solely responsible for the content of these proceedings. The technical information does not necessarily reflect the official position of the sponsoring agencies or institutions represented by planning committee members, and inclusion and distribution herein does not constitute an endorsement of views expressed by the same. Printed materials included herein are not refereed publications. Citations should appear as follows. EXAMPLE: Authors. 2025. Title of presentation. Waste to Worth. Boise, ID. April 7-11, 2025. URL of this page. Accessed on: today’s date.
Sustainability of the Dairy Industry in the United States
Purpose
The U.S. dairy industry recognizes its environmental impact and has committed to achieving carbon neutrality by 2050, aiming to significantly reduce greenhouse gas (GHG) emissions while maintaining production efficiency. The primary sources of dairy-related emissions include enteric methane from cows, manure management, feed production, and energy use on farms.
Improvements in feed efficiency and manure management have already led to reductions in emissions per unit of milk produced. For instance, Idaho has successfully reduced enteric methane emissions per unit of milk by 25% since 1990, and methane emissions from manure per unit of milk have declined by about 20% (O’Hara, 2022). However, the total emissions from manure have increased by 20% due to herd growth in Idaho. These figures highlight the challenge of balancing productivity with environmental stewardship. Despite these difficulties, advancements in animal nutrition, manure management, and emerging technologies provide a promising path toward sustainability.
What Did We Do?
Over the past several decades, remarkable advancements in dairy farming have significantly improved milk production efficiency. Since the 1940s, the industry has nearly quadrupled milk output per cow through genetic improvements, optimized nutrition, and better overall management. This increase in productivity has allowed farmers to produce more milk with fewer cows, reducing the environmental footprint of each unit of dairy produced. Beyond improvements in feed efficiency, nutritional interventions such as adding feed additives like 3-NOP (3-nitrooxypropanol), seaweed, and oilseeds have been shown to reduce enteric methane emissions by altering rumen microbial activity. Research suggests that 3-NOP, for instance, can reduce methane emissions by up to 30% without negatively affecting milk yield or composition (Hristov, 2021).
Manure management is another critical area of focus. Technologies such as anaerobic digesters, composting systems, and improved storage techniques have been implemented to mitigate methane emissions from manure. Anaerobic digesters convert manure into biogas, which can be used as a renewable energy source, reducing the reliance on fossil fuels and lowering overall carbon emissions. Other strategies, such as mechanical separators and compost-bedded pack barns, have also been explored as effective methods for reducing methane release from stored manure.
What Have We Learned?
Several key strategies have emerged as effective pathways for improving dairy sustainability. The first is continued advancements in genetics, which allow farmers to breed more productive cows that require fewer resources per unit of milk produced. Selective breeding programs targeting low-methane-emitting cows could further contribute to sustainability efforts. Precision feeding techniques, which ensure cows receive the optimal balance of nutrients without overfeeding, are also crucial for reducing emissions. Feed additives such as tanniferous forages, alternative electron sinks like nitrates, and certain types of fats have shown potential in mitigating enteric methane production. However, long-term research is still needed to assess their effectiveness and potential side effects on animal health and productivity.
Another significant finding is the role of manure management systems in influencing overall farm emissions. Studies indicate that farms implementing covered liquid slurry storage and anaerobic digesters experience lower methane emissions compared to traditional open-lagoon systems. Additionally, manure treatment systems that integrate composting or separation techniques have been identified as key factors in reducing GHG emissions. Beyond farm-level practices, the industry has recognized the importance of collaboration across the supply chain. Processors, retailers, and policymakers must work together to promote sustainable practices, invest in research, and provide incentives for farmers to adopt new technologies.
Future Plans
Moving forward, the dairy industry will continue to focus on increasing milk production efficiency as a means of reducing emissions per unit of milk produced. Advances in genetics, feed optimization, and herd management will further contribute to sustainability efforts. Additionally, manure management will play a pivotal role in achieving sustainability goals. Expanding the use of anaerobic digesters and nutrient recycling technologies will help reduce emissions while providing renewable energy and valuable soil amendments.
Investment in research and innovation will be essential for identifying new strategies and improving existing ones. Research into alternative feed additives, precision agriculture, and digital monitoring tools will enable farmers to make data-driven decisions that enhance both productivity and environmental sustainability. Policy support and financial incentives will also be critical in accelerating the adoption of sustainable practices. Government programs and industry initiatives should continue to provide funding for technology adoption, carbon offset programs, and educational resources for farmers. Ultimately, the U.S. dairy industry is well-positioned to make significant strides toward its sustainability goals. By leveraging innovation, research, and collaboration, the industry can continue to provide essential nutrition while reducing its environmental footprint and working toward carbon neutrality by 2050.
Authors
Presenting & corresponding author
Mark A. McGuire, University Distinguished Professor, Department of Animal, Veterinary and Food Sciences, University of Idaho, mmcguire@uidaho.edu
Additional Information
Capper, J. L., Cady, R. A., & Bauman, D. E. (2009). The environmental impact of dairy production: 1944 compared with 2007. Journal of Animal Science, 87(6), 2160–2167. https://doi.org/10.2527/jas.2009-1781
El Mashad, H. M., Barzee, T. J., Franco, R. B., Zhang, R., Kaffka, S., & Mitloehner, F. (2023). Anaerobic digestion and alternative manure management technologies for methane emissions mitigation on Californian dairies. Atmosphere, 14(1), 120. https://doi.org/10.3390/atmos14010120
Godber, O. F., Czymmek, K. J., van Amburgh, M. E., & Ketterings, Q. M. (2024). Farm-gate greenhouse gas emission intensity for medium to large New York dairy farms. Journal of Dairy Science. https://doi.org/10.3168/jds.2024-25874
Hristov, A. N., Melgar, A., Wasson, D., & Arndt, C. (2021). Symposium review: Effective nutritional strategies to mitigate enteric methane in dairy cattle. Journal of Dairy Science, 105(10), 8543–8557. https://doi.org/10.3168/jds.2021-21398
Innovation Center for U.S. Dairy. (2022). U.S. Dairy Sustainability Report 2021-2022. Retrieved from https://www.usdairy.com/about-us/innovation-center
Kreuzer, M. (2024). Feed additives for methane mitigation: Introduction—Special issue on technical guidelines to develop feed additives to reduce enteric methane. Journal of Dairy Science.
Nguyen, B. T., Briggs, K. R., & Nydam, D. V. (2023). Dairy production sustainability through a one-health lens. Journal of the American Veterinary Medical Association, 261(1). https://doi.org/10.2460/javma.22.09.0429
O’Hara, J. K. (2022). State-level trends in the greenhouse gas emission intensity of U.S. milk production. Journal of Dairy Science, 106(10), 5474–5484. https://doi.org/10.3168/jds.2022-22741
Rotz, C. A. (2017). Modeling greenhouse gas emissions from dairy farms. Journal of Dairy Science, 101(7), 6675–6690. https://doi.org/10.3168/jds.2017-13272
U.S. Farmers & Ranchers in Action (USFRA). (2024). Potential for U.S. Agriculture to Be Greenhouse Gas Negative. Retrieved from https://www.usfraonline.org
Acknowledgements
Supported by USDA-NIFA SAS 2020-69012-31871
Bang for Your Buck: Developing Effective Anaerobic Digestion Policies for Carbon Emission Reduction
Purpose
Anaerobic digesters are an established technology for reducing methane emissions from livestock manure. In recent years, the rapid expansion of renewable natural gas (RNG) projects, driven by economic incentives such as Renewable Identification Number (RIN) credits, Low Carbon Fuel Standard (LCFS) credits, and Investment Tax Credits (ITC) from the 2022 Inflation Reduction Act, has spurred significant growth in RNG production. These incentives, while promoting the adoption of anaerobic digestion, may only sometimes be the most cost-effective way to achieve meaningful carbon reductions within the livestock sector. RNG production, electricity generation via biogas, and flaring biogas all mitigate agricultural greenhouse gas (sometimes referred to as carbon dioxide equivalence or CO2e) emissions from manure. Nonetheless, electric generators are significantly cheaper than the biogas upgrading systems necessary for RNG production, and flares are significantly cheaper than electric generators.
Our analysis compares system costs and emissions reductions, and investigates the societal benefit featured by each system. The only revenue we analyze is RNG sales and electricity sales; we do not incorporate carbon credits into the revenue stream. Flaring biogas, or the process of burning the methane within biogas to produce the lesser potent greenhouse gas, CO2, greatly reduces agricultural CO2e emissions, though this process does not generate usable renewable energy. Electricity generation via biogas is cheaper than RNG production via biogas, but electricity can be sustainably generated with more efficient methods, such as wind turbines and solar panels. RNG is primarily created via anerobic digestion; additionally, RNG is the leading renewable replacement for conventional natural gas, a fossil fuel with increasing use, traveling within 3,000,000 miles of pipelines in the U.S. Nonetheless, RNG remains an expensive and technically complex process, requiring high capital investment and persistent, local, and skilled labor for effective operation.
What Did We Do?
This study compares the economic and carbon reduction potential of various anaerobic digestion biogas uses, including RNG production, electricity generation, and flaring. By evaluating the carbon savings and cost-effectiveness of these options, the study provides policymakers insights on optimizing public funding and incentives for the livestock industry. Furthermore, we provide livestock farmers with a decision support tool that balances the environmental benefits of anaerobic digestion with the most efficient use of financial resources to foster clean and sustainable livestock production system.
What Have We Learned?
Table 1 summarizes dollars per megagram (MG) of CO2e mitigated via RNG production, electricity production via biogas, and flaring biogas for both covered manure storages and constructed anaerobic digesters. Five scenarios were compared for farms featuring dairy cows, swine with lagoon manure storages, and swine with deep pit manure storages to analyze the carbon credit value (units of dollars per MG of CO2e mitigated) necessary to financially break even on the project. Flaring biogas featured the lowest necessary break-even carbon credit for dairy, swine farms with lagoon manure storage, and swine farms with deep pit manure storages. If a farmer wants to generate power, then generating electricity requires a lesser carbon credit value per MG CO2e mitigated compared to RNG generation. If a farmer wants to generate power via RNG, and carbon credits exist in units of dollars per energy, then a dairy farmer would be more profitable with a digester, whereas a swine farmer would be more profitable with a covered manure storage.
If a governing body is interested in maximizing its livestock manure CO2e reduction given a set amount of tax dollars, then the governing body may be most interested in incentivizing flaring systems. If a governing body is interested in both power generation via livestock manure and CO2e reduction, then the governing body may be most interested in incentivizing electricity generation. Nonetheless, renewable electricity can be generated more efficiently by a variety of methods, whereas RNG is the most prominent fossil natural gas replacement and primarily created via anaerobic digestion. Furthermore, as the electric grid “greens”, or as the CO2e emissions associated with grid electricity decrease, RNG generation will provide an overall greater percent CO2e reduction.
Deep pit swine farms generating electricity or RNG demonstrated CO2e reduction that was greater than 100%. Deep pit swine farms have less emissions than lagoon swine farms. By converting a deep pit swine farm to an outdoor covered manure storage or digester system, methane production increases, though that methane is now used for renewable energy generation, thereby offsetting fossil energy generation.
| Head | Dairy: 2,000 | Swine – Lagoon: 14,000 | Swine – Deep Pit: 14,000 | ||
|---|---|---|---|---|---|
| Baseline CO2e (MG/yr) | 10,654 | 10,179 | 3,980 | ||
| Covered Storage | Flaring | CO2e Mitigated (MG/yr) | 8,786 | 8,786 | 3,424 |
| % CO2e Reduction | 82% | 86% | 86% | ||
| $/yr Profit (10-year life) | ($84,137) | ($108,151) | ($342,975) | ||
| Break-Even ($/MG CO2e Mitigated) Carbon Credit | $10 | $12 | $100 | ||
| Covered Storage | Electricity | CO2e Mitigated (MG/yr) | 9,734 | 9,735 | 4,373 |
| % CO2e Reduction | 91% | 96% | 110% | ||
| $/yr Profit (10-year life) | ($178,978) | ($202,992) | ($437,816) | ||
| Break-Even ($/MG CO2e Mitigated) Carbon Credit | $18 | $21 | $100 | ||
| Break-Even ($/kWh) Carbon Credit | $0.08 | $0.09 | $0.20 | ||
| Covered Storage | RNG | CO2e Mitigated (MG/yr) | 9,913 | 9,914 | 4,552 |
| % CO2e Reduction | 93% | 97% | 114% | ||
| $/yr Profit (10-year life) | ($780,801) | ($795,726) | ($1,030,551) | ||
| Break-Even ($/MG CO2e Mitigated) Carbon Credit | $79 | $80 | $226 | ||
| Break-Even ($/MMBTU) Carbon Credit | $46 | $47 | $61 | ||
| Digester | Electricity | CO2e Mitigated (MG/yr) | 10,042 | 9,826 | 4,464 |
| % CO2e Reduction | 94% | 97% | 112% | ||
| $/yr Profit (10-year life) | ($557,022) | ($519,566) | ($754,390) | ||
| Break-Even ($/MG CO2e Mitigated) Carbon Credit | $55 | $53 | $169 | ||
| Break-Even ($/kWh) Carbon Credit | $0.14 | $0.19 | $0.27 | ||
| Digester | RNG | CO2e Mitigated (MG/yr) | 10,169 | 9,904 | 4,542 |
| % CO2e Reduction | 95% | 97% | 114% | ||
| $/yr Profit (10-year life) | ($1,207,287) | ($1,056,809) | ($1,291,633) | ||
| Break-Even ($/MG CO2e Mitigated) Carbon Credit | $119 | $107 | $284 | ||
| Break-Even ($/MMBTU) Carbon Credit | $39 | $50 | $62 |
Future Plans
The project life of biogas upgrading equipment, pipeline interconnects, electric generators, and flares are not always the same. We intend to further investigate the project lives of different equipment to calculate more accurate annualized costs and payback periods. Furthermore, we will analyze how the economies of scale compare between biogas upgrading equipment, electric generators, and flares by evaluating costs of equipment necessary for various farm sizes. Lastly, we would like to further define and quantify the overall societal impact created by RNG production, electricity production via biogas, and flaring biogas.
Authors
Presenting author
Luke Soko, Graduate Student, Iowa State University
Corresponding author
Dan Andersen, Associate Professor, Iowa State University, dsa@iastate.edu
The authors are solely responsible for the content of these proceedings. The technical information does not necessarily reflect the official position of the sponsoring agencies or institutions represented by planning committee members, and inclusion and distribution herein does not constitute an endorsement of views expressed by the same. Printed materials included herein are not refereed publications. Citations should appear as follows. EXAMPLE: Authors. 2025. Title of presentation. Waste to Worth. Boise, ID. April 7-11, 2025. URL of this page. Accessed on: today’s date.
High Clearance Robotic Irrigation Impacts on Soybeans and Corn Yield and Nutrient Application
Purpose
This collaborative project between The Ohio State University, Iowa State University, and 360YieldCenter intends to demonstrate the in-season application of commercial and animal nutrient sources and water application as a unified strategy to reduce nutrient losses while improving profitability with increased grain yields. A new and innovative high-clearance robotic irrigator (HCRI) is being used to apply liquid-phase nutrients in-season beyond all stages of row crops. Replicated strip trials of Fall, Spring, and in-season application will occur using the HCRI (e.g., 360 RAIN Robotic Irrigator, Figure 1). The in-season application consists of traditional N and P application rates as well as reduced rates to take advantage of better matching nutrient availability to crop needs during the growing season. Data were collected to verify nitrate-nitrogen leaching loss using liquid swine manure as a nutrient source in Iowa, while total and dissolved reactive phosphorus losses with both runoff and leaching using commercially available nutrients were collected in in Ohio. Secondly, as climate shifts result in water scarcity during critical crop growth stages, robotic irrigation water applications will be used to meet the crop needs. Higher crop yields are anticipated via precision water management.

What Did We Do?
OSU is conducting two field demonstrations, one with a focus on water quality, and a second for comparison of nutrient management practices. The HCRI is being utilized to apply commercial fertilizer in-season via dilution in irrigation water with up to 12 applications per growing season (effective 4.5 in. of precipitation season dependent). Nutrient injection rates (N and P) are scaled to plant nutrient uptake and irrigator pass intervals. Both sites are farmed in accordance with existing crop rotation and standard practices.
Beck’s Hybrid Site (West 1A) – The Beck’s Hybrid site (78 ac) is subdivided in accordance with the sub-watershed boundaries and managed with two treatments: 1) conventional commercial fertilizer application in accordance with the Tri-State Fertilizer recommendations, and 2) in-season nutrient management (N and P) using the HCRI and Tri-State Fertilizer Recommendations with the exception nutrient application matching with plant nutrient uptake rates as judged by growing degree days (GDD). This site is instrumented as a paired watershed for surface water and subsurface tile drainage. Further, these watersheds are monitored for precipitation, flow, and water quality (nitrate, nitrite, total phosphorus and DRP).
Molly Caren Agricultural Center (MCAC) Site 1 (Field 7) – Field demonstrations at this site (140 ac) are laid-out in a randomized complete block design (RCBD) strip trial design with treatments that include: 1) commercial fertilizer application (N and P) in accordance with the Tri-State Fertilizer recommendations, 2) in-season nutrient management (N and P) using the HCRI and Tri-State Recommendations with the exception nutrient application matched with crop nutrient uptake rates based on growth stages as determined by GDD, and 3) in-season nutrient management (N and P) using the HCRI and 67.7% Tri-State recommend application rates matched with crop nutrient uptake rates based on growth stages (GDD). Strip trials are 160 ft. in width and approximately 1,170 ft. in length (4.3 ac treatments) with eight replicates.
MCAC Site 2 (Field 8A) – Field demonstration site used to test HCRI and “sandbox” for other RCBD trials outside of NRCS CIG grant to discovery and planning for future projects. This site varies depending on studies each year, but trials are completed via RCBD strips.
Data Collection and Analysis – Demonstration sites are grid sampled each season on a 1-ac grid (Beck’s) and within treatments (MCAC site) to monitor soil fertility levels. Soil moisture and temperature in situ sensors (CropX) are placed in both study locations (three per treatment, 15 total sensors). Tissue samples are collected by treatment type to assess nutrient uptake at three stages of crop growth. Harvested crops are scaled by treatment to ensure yield monitor accuracy. Remote sensing imagery (RGB, ADVI and thermal) is collected 10 or more times during the growing season to evaluate crop growth and development. Data is analyzed using RCBD procedures in SAS.
Water Quality Assessment – Surface and subsurface (tile) monitoring capacity was established in 2016 at the Beck’s Hybrid Site. Two isolated subareas within a single production field were identified and the surface and subsurface pathways were instrumented with control volumes and automated sampling equipment. Surface runoff sites were equipped with H-flumes while compound weirs were installed at each of the subsurface (tile) outlets. Each sampling point (two surface and two subsurface) is equipped with an automated water quality sampler and programmed to collect periodic samples during discharge events. Once collected, samples will be analyzed for N and P. An on-site weather station provides weather parameters. Water samples are collected weekly from the field plots during periods of drainage and follow the same ISU protocol for NO3–N. Dissolved reactive phosphorus (DRP) and digested (total phosphorous) samples are analyzed using ascorbic acid reduction method.
What Have We Learned?
2023 Results
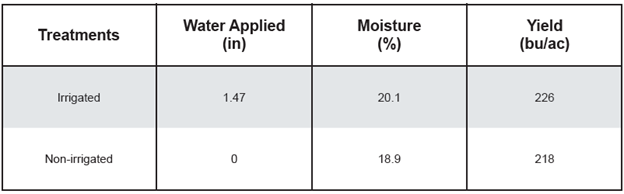
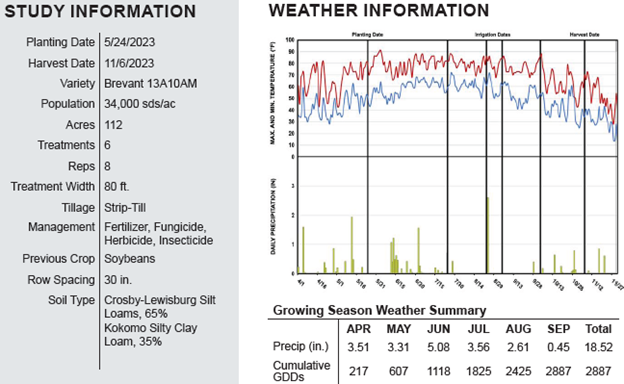
At the Beck’s Hybrid location field West 1A was planted to corn for the 2023 cropping season. There was an 8.0 bu/ac difference between irrigated and non-irrigated treatments. Nitrogen was injected using the rain unit and put on crop for the first application and use of the rain machine. Not having the rain unit in June made a significant difference in this study. The results of this location from 2023 should be taken lightly as complete implementation was not done until August. Location study information can be seen in Figure 2 and results in Figure 3.

In 2023, field 7 at MCAC was in soybeans and had no irrigation completed for this growing season.
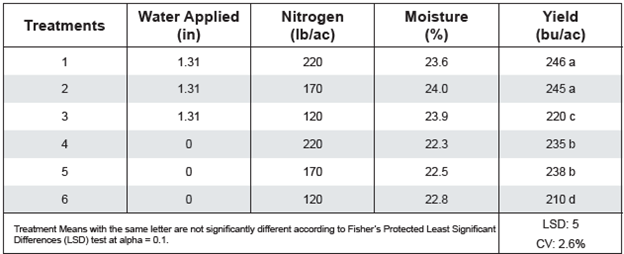
Field 8A at MCAC was in corn for the 2023 cropping season. Irrigation had a statistically significant effect on yield over all treatments. Nitrogen had statistical significance from 120 versus 170 and 220 units on nitrogen treatments. The 170 units of nitrogen was the optimal amount of nitrogen for all treatments. Not having the irrigator installed in early June caused there to be less yield in irrigated treatments. The results of this location from 2023 should be taken lightly as complete implementation was not done until August. Location study information can be seen in Figure 4 and results in Figure 5.
2024 Results
Field 7 at MCAC was in corn for the 2024 cropping season. Irrigation had a statistically significant effect on yield over all treatments. There was a 48 bu/ac between irrigated two-thirds nutrients and non-irrigated and 44 bu/ac between irrigated and non-irrigated for the 2024 growing season. A total of 773 gallons of diesel was used to run the irrigator for this trial for 2024 cropping season across 71 acres. A total of 25,739 kWh was used to run the electric pumps, base station, and well for 2024 growing season across 71 acres. These are the initial results that were published in efields and further results will continue to be analyzed to meet all project objectives. This data will be used to help in evaluating HCRI versus traditional crop production and management practices to meet project objectives. Location study information can be seen in Figure 6 and results in Figure 8. In Figure 7, aerial imagery can be seen from the 2024 cropping season.

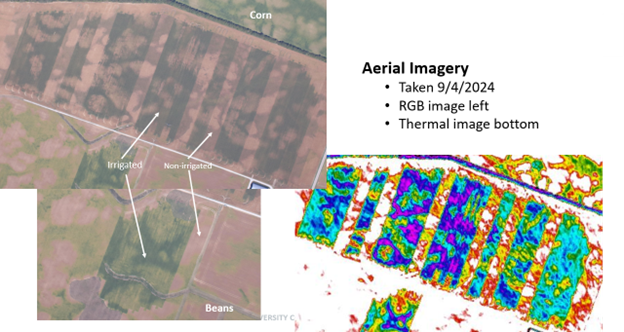

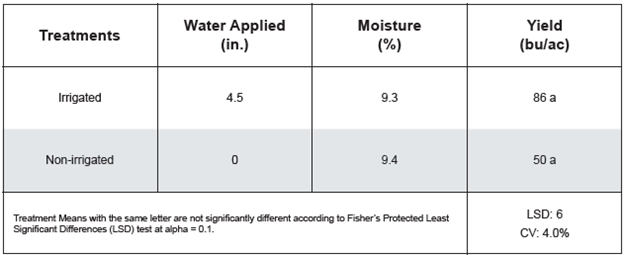
Field 8A at MCAC was in soybeans for the 2024 cropping season. Irrigation had a statistically significant effect on yield over non-irrigated. A total of 211 gallons of diesel was used to run the irrigator for this trial for 2024 cropping season across 11 acres. A total of 3,475 kWh was used to run the electric pumps, base station, and well for 2024 growing season across 11 acres. Location study information can be seen in Figure 9 and results in Figure 10. In Figure 7, aerial imagery can be seen from the 2024 cropping season.

Future Plans
During the next 12 months, we are planning for the HCRI operation at the two sites for cropping practices and irrigation for 2025 growing season. We will be aggregating weather data, agronomic data, plant samples, surface and ground water quality samples, and machine performance data for all years of the project with the current end date as spring of 2026. We are hoping to continue to perform testing with this technology and implementing the dry product skid for field operations for the 2025 growing and full-scale implementation across all studies in 2026. The results from the Iowa State portion of this funded project will also be reported in the future as well. There is a significant need to further develop programs for injecting macro and micronutrients in liquid and granular form for growers. The potential to significantly cut application rates exists with this technology. Also, implementing this technology with liquid livestock manure producers will change the paradigm of how manure is managed in the future.
Authors
Presenting & corresponding author
Andrew Klopfenstein, Senior Research Engineer, The Ohio State University, Klopfenstein.34@osu.edu
Additional authors
Justin Koch, Innovation Engineer, 360YieldCenter; Kapil Arora, Field Agricultural Engineer, Iowa State University; Daniel Anderson, Associate Professor, Iowa State University; Matthew Helmers, Professor, Iowa State University; Kelvin Leibold, Farm Management Specialist, Iowa State University; Alex Parsio, Research Engineer, The Ohio State University; Chris Tkach, Lecturer, The Ohio State University; Christopher Dean, Graduate Research Associate, The Ohio State University; Ramareo Venkatesh, Research Associate, The Ohio State University; Elizabeth Hawkins, Agronomics Systems Field Specialist, The Ohio State University; John Fulton, Professor, The Ohio State University; Scott Shearer, Professor and Chair, The Ohio State University
Additional Information
eFields On-Farm Research Publication 2023 and 2024 Editions – https://digitalag.osu.edu/efields
Acknowledgements
Natural Resources Conservation Service – Conservation Innovation Grant (NR223A750013G037)
Ohio Department of Agriculture – H2Ohio Grant
USDA, NRCS, 360YieldCenter, Beck’s Hybrids, Molly Caren Agricultural Center, Rooted Agri Services, Iowa State University, The Ohio State University
The authors are solely responsible for the content of these proceedings. The technical information does not necessarily reflect the official position of the sponsoring agencies or institutions represented by planning committee members, and inclusion and distribution herein does not constitute an endorsement of views expressed by the same. Printed materials included herein are not refereed publications. Citations should appear as follows. EXAMPLE: Authors. 2025. Title of presentation. Waste to Worth. Boise, ID. April 7-11, 2025. URL of this page. Accessed on: today’s date.
Using an interactive map exercise to help producers better manage their manure
Purpose
Time and time again, experience has taught us that many people learn by doing, not just from listening to presentations. The Nebraska Animal Manure Management Team has worked hard over the last six years to develop and expand what is now referred to as the Interactive Nutrient Management Decision-Making Exercise. This workshop will serve as a train-the-trainer event where attendees will:
-
- Discover how the exercise began and what it has grown to include
- Get familiar with the pieces and parts by helping set up the activity
- Experience a couple of the activities as participants
- Hear from others that have adapted the exercise and their experiences
- Brainstorm how the exercise can be used elsewhere or for other concepts
What Did We Do?
The Interactive Nutrient Management Decision-Making Exercise (mapping exercise) was developed by the Animal Manure Management Team at the University of Nebraska-Lincoln and University of Minnesota to engage participants during Manure Application Trainings. In Nebraska, these trainings previously relied heavily on PowerPoint and recorded presentations, but with many people being hands-on learners, an interactive exercise was proposed. In 2020, the original 6 activities were used for the afternoon portion, and it has since grown to the exercise it is today that is incorporated throughout the whole-day training.
It has been used not only for livestock producers but also crop producers. Parts of it have been modified to fit into workshops at conferences and, most recently, high school classrooms. Current expansion topics include spray drift to avoid sensitive areas and nitrogen management from all sources.
What Have We Learned?
Because many livestock producers in Nebraska are required to attend Land Application Training events every five years to maintain their Livestock Waste Control Facility permit, the winter 2024-2025 programming season for the Nebraska manure team offered an opportunity to ask participants how their operations have changed since the first time they had seen the Interactive Nutrient Management Decision-Making Exercise (in 2020). The team asked 3 questions specific to the exercise and changes on their operations and found the following results.
In general, participants are considering the topics taught during training more now than they were five years ago. The figure below indicates that 48% consider weather forecasts to decrease odor risk more or much more than they did prior to experiencing the Interactive Nutrient Management Decision-Making Exercise. Forty eight percent and 59% consider water quality and soil health impacts from manure more than five years ago, subsequently. While many participants already factored in transportation cost compared to nutrient value captured for a field, 59% reported that they consider it more or much more than they did, and 55% reported that they now considered the value of manure nutrients based on a field’s soil test more or much more.

We also asked participants to share with us how useful they felt the changes and expanded activities of the Interactive Nutrient Management Decision-Making Exercise were. All participants felt that the changes and expansion were useful with 52% indicating that they were very or extremely useful.

We also asked, “How do you expect your experience with the newer activities of the interactive nutrient management decision-making exercise will change your operation in the future?” and, among others, we received the following responses:
-
- “[we will] take more consideration to neighbors near application”
- “[we will make] better $ management decision[s] on manure application site[s]”
- “[the activity] makes us want to plan out better to get better results”
Future Plans
With so much success using this teaching tool, we would like to expand it to teach topics other than nutrient management. The Soil Health Nexus, a soil health workgroup in the north central region of the US, is in the process of developing an adaptation of this tool that will teach participants about the impacts of certain practices on soil health. Currently, progress has been made on activities focusing on tillage and the use of cover crops. Other planned activities include a focus on crop rotation and the use of the Soil Health Matrix, a tool developed by the Soil Health Nexus.
The Nebraska Animal Manure Management team, as part of a different grant, also has plans to create some activities focused on integrating livestock into cropping systems.
We also support using the base model of this exercise and adapting it for other practices and audiences outside of Nebraska.
Authors
Presenting & Corresponding author
Leslie Johnson, Animal Manure Management Extension Educator, University of Nebraska – Lincoln, leslie.johnson@unl.edu
Additional author
Amy Millmier Schmidt, Professor and Livestock Bioenvironmental Engineering Specialist, University of Nebraska-Lincoln;
Additional Information
Downloadable Curriculum: https://lpelc.org/interactive-nutrient-management-decision-making-exercise-curricula/
Acknowledgements
We would like to acknowledge all other contributors to the curriculum in the past including:
-
- Larry Howard, Rick Koelsch, Agnes Kurtzhals, Aaron Nygren, Agustin Olivio, Amber Patterson, Katie Pekarek, Amy Schmidt, Mike Sindelar, and Todd Whitney (University of Nebraska, Lincoln)
- Daryl Andersen, Tyler Benal, Will Brueggemann, Russ Oakland, and Bret Schomer (Lower Platte North NRD)
- Blythe McAfee and Tiffany O’Neill (Nebraska Department of Environment and Energy)
- Andy Scholting (Nutrient Advisors)
- Marie Krausnick, Dan Leininger (Upper Big Blue NRD)
- Chryseis Modderman (University of Minnesota)
- Nutrient Advisors
- Settje Agri Services Eng.
- Ward Laboratories Inc.
The authors are solely responsible for the content of these proceedings. The technical information does not necessarily reflect the official position of the sponsoring agencies or institutions represented by planning committee members, and inclusion and distribution herein does not constitute an endorsement of views expressed by the same. Printed materials included herein are not refereed publications. Citations should appear as follows. EXAMPLE: Authors. 2025. Title of presentation. Waste to Worth. Boise, ID. April 7-11, 2025. URL of this page. Accessed on: today’s date.
Economic feasibility of dairy manure and food waste co-digestion at small, medium, and large farms
Purpose
Anaerobic digestion (AD) of dairy manure with and without food waste has mainly been implemented on a large scale in the US. The installed cost of these systems have economies of scale, and operations and maintenance costs need to be outweighed by adequate revenues from accepting food waste and/or producing energy, as well as reducing greenhouse gases (GHG). Scaling down AD systems is now technically feasible even on a micro-scale, but economic feasibility is still largely a challenge at small scales.
Local markets with competitive value structures for AD energy output and GHG reduction are needed to facilitate successful small and moderate scale AD systems. Analysis of energy values and consideration of food waste co-digestion with manure, as a way to expand revenues needed for economic feasibility at various scales, can help farmers and policymakers navigate opportunities.
What Did We Do?
We investigated the economic feasibility conditions of small, medium, and large AD systems processing dairy manure from 300 cows, 1000 cows, and 2,000 cows, respectively, in combination with varying amounts of food waste. The Cornell Manure-based Anaerobic Digester Simulation tool was further developed and then utilized to model the mesophilic, vessel-type AD of various food wastes and amounts in combination with varying dairy cow manure volumes to assess performance and associated economics. The breakeven capital cost of the full project was computed for each scenario (nine per dairy farm size) of manure to food waste ratio, tip fee revenue, energy output and revenue value. These were compared to estimated project costs based on multiple case studies to evaluate whether or not the breakeven cost was high enough to be considered an economically viable project.
What Have We Learned?
Key results from modeling these scenarios included that an AD to biomethane system can be economically feasible for a 300-cow dairy (300 lactating cow equivalents) only when food waste is co-digested in an equal volume with the manure and when tip fees reach $20 per ton and biomethane is valued at $25 per million BTU (MMBTU) or more. Biomethane sell price data collected from our collaborator, Energy Vision, was found to be as high as $70 per MMBTU if sold in the California transportation market (manure only AD), and between $12 and $28 in voluntary markets.
Additionally, a dairy farm with 1,000 lactating cow equivalents (e.g., 725 milk cows and 650 heifers), was found to achieve economic feasibility with 25% or more of food waste ratio to manure co-digested as long as both tip fees and energy revenue were high ($40 per ton tip and $35 per MMBTU biomethane). When food waste ratios increased to half the digester’s feedstock, economic feasibility was achievable at more moderate rates. The economic feasibility of manure-only AD continues to be challenged at small and moderate scale, while the addition of food waste with manure enables significantly higher revenues from substantially more energy production and tipping fees.
Future Plans
This project included detailed analysis of a small-scale co-digestion application at Cornell’s smaller Teaching Dairy operation to evaluate available equipment and biogas utilization options. A preliminary design is developed, capital funding secured, and initial operating period research and extension defined. The project is scheduled to be completed later this calendar year and will be utilized for various food waste and manure anaerobic digestion to energy system research and educational programming.
Authors
Presenting & corresponding author
Lauren Ray, Sr. Extension Associate, Cornell University – PRO-DAIRY, LER25@cornell.edu
Additional author
Peter Wright, Agricultural Engineer, Cornell University
Additional Information
https://cals.cornell.edu/pro-dairy/our-expertise/environmental-systems/manure-energy-systems
Acknowledgements
Funding was provided by the New York Farm Viability Initiative.
The authors are solely responsible for the content of these proceedings. The technical information does not necessarily reflect the official position of the sponsoring agencies or institutions represented by planning committee members, and inclusion and distribution herein does not constitute an endorsement of views expressed by the same. Printed materials included herein are not refereed publications. Citations should appear as follows. EXAMPLE: Authors. 2025. Title of presentation. Waste to Worth. Boise, ID. April 7-11, 2025. URL of this page. Accessed on: today’s date.
From Lecture to Hands-On Learning: Engaging Iowa’s Manure Applicators Through Active Certification Programs
Purpose
The Iowa Manure Applicator Certification program has transitioned from a traditional lecture-based format to a multimodal learning approach that integrates lectures, discussion, and hands-on activities. This shift was implemented to create more engaging and memorable training experiences, fostering discussion and peer-to-peer knowledge sharing while improving knowledge retention and practical skill application.
Hands-on learning has been widely recognized as an effective educational strategy. Research indicates that individuals retain more information through active engagement rather than passive listening. However, developing these engaged learning opportunities requires additional time and commitment from educators and a willingness from participants to fully engage in the learning process. Our goal was to transform the training environment from passive listening to an interactive space where participants could explore activities, facilitate discussions, and share personal experiences within groups.
What Did We Do?
To achieve this transformation, we restructured the program to incorporate interactive activities designed to bring real-world challenges into the classroom. Instead of serving solely as lecturers, facilitators became discussion leaders, encouraging participants to actively engage with the material. Starting in approximately 2014, we started adding one module to training based on fostering discussion and participant interaction. As the training occurs annually, with livestock farmers or commercial manure applicators required to attend annually, different modules were created each year with at least a three-year break before an existing module is used again.
Some of the hands-on activities integrated into the program include:
-
- Carousel Exercise – Applicators rotate through stations, responding to questions on environmental impacts and operational challenges, sparking peer-to-peer discussions.
- Spill Response Scenario – Groups rank and discuss response steps to manure spills, often incorporating real-world examples shared by applicators and insights from Iowa DNR regulators.
- Load Loss Competition – Model trucks are used to visually demonstrate best practices for material containment.
- Stockpiling Locations – Hands-on exercises with topographic, soil, and aerial imagery to develop regulatory knowledge and practical application skills.
- Application Rate Calibration – Three simulated manures (bed pack [wetted straw], open lot [wetted sand], and turkey litter [wetted wood shavings]) were supplied to each group and a plastic tarp. Each group was asked to apply a prescribed manure application and then to estimate the application rate of other groups. The actual application rate was calculated based on the weight added to the tarp and compared to group estimates.
- DOT Compliance Activity – Participants perform checklist inspections on model trucks to identify vehicle issues and understand road rules.
- Video-Based Farm Walkthrough – Applicators observe an Iowa DNR site inspection via video before using Google Maps and a farm description to evaluate livestock production sites for compliance readiness.
- Biosecurity Bench – Glow germ was placed on at a simulated barn entry and producers went through a Danish style entry. At the end we evaluated how much glow germ made it to the clean side of the entry.
- Manure Transport Route Selection – Participants were divided into groups and given a map and worksheet. The map identified the location of the farm with manure and the field to which manure was to be applied. Groups were required to select a route from farm to field with the worksheet providing talking points such as travel time, neighbors, and bridge considerations.

Each of these activities was designed to promote critical thinking in manure management and spill prevention while allowing facilitators to assess current knowledge levels among participants.
What Have We Learned?
While some participants and facilitators initially approached this transition with skepticism, feedback has been positive. Evaluations suggest that these engaged learning techniques have resulted in increased participant investment, improved knowledge retention, and greater willingness to discuss challenges and ask questions.
Facilitators also report stronger engagement with applicators, who now feel more comfortable sharing experiences, discussing obstacles, and applying learned concepts in real-world situations. Additionally, peer-to-peer learning has emerged as a significant benefit, with applicators contributing valuable insights that complement the formal curriculum.
Data obtained from the Iowa Department of Natural Resources Hazardous Material Release Database (https://programs.iowadnr.gov/hazardousspills/Reports/EPCManureRelease.aspx) was used to track total incidents of manure releases and surface water impacts from these releases. Within this report, incidents are broken down by species (Hog, cattle, or poultry, by facility type (open lot, confinement), and if they occurred from the facility, because of land application, or during manure transport. A summary of total events is provided in Figure 2. A before and after analysis using 2012 as the break point indicated a statistically lower number of spills (29.9 ± 9.6 compared to 49.9 ± 6.4 spills) after 2014 (p<0.001). However, the number of water quality impacts from spills remained unchanged (10.9 ± 4.6 compared to 10.0 ± 4.8). A breakpoint regression analysis was used to evaluate if the occurrence of spills has changed with time (Figure 2). The breakpoint year was set at 2013 (the year before our first active learning activity was implemented) and results indicated that before 2013 the occurrence of spills was constant with time, while after 2013 we have been decreasing by 3.1 spills per year. Similarly, for water quality impacts the breakpoint year was set at 2013 with results indicating that before 2013 impacts on water (spills reaching a surface water) were constant with time, while after 2013 impacts have been decreasing by 0.3 incidences per year. While other changes certainty played a role in the reduction of manure spills and water impacts (increased adoption of flow meters and automated flow shutoff systems, a change from tanks to umbilical application to reduce road traffic, and regulatory interventions) our program reviews and spill impact assessment suggest the Iowa Manure Applicator training played a role in helping improve industry performance.

Future Plans
We plan to continue refining the program by incorporating additional interactive elements and expanding hands-on learning opportunities. Future initiatives may include:
-
- Enhancing real-world application exercises by integrating on-farm training opportunities.
- Collecting and analyzing long-term data to assess the impact of training on manure management practices and environmental outcomes.
- Exploring digital and remote learning tools to reach a broader audience while maintaining interactive engagement.
Authors
Presenting & corresponding author
Daniel Andersen, Associate Professor, Iowa State University, Dsa@iastate.edu
Additional authors
Rachel Kennedy, Iowa State University
Melissa McEnany, Iowa State University
Tony Mensing, Iowa State University
Kapil Aurora, Iowa State University
Kris Kohl, Iowa State University
Additional Information
@drmanure
https://www.facebook.com/IowaManure/
https://www.extension.iastate.edu/immag/commercial-manure-applicators
Acknowledgements
Iowa DNR
The authors are solely responsible for the content of these proceedings. The technical information does not necessarily reflect the official position of the sponsoring agencies or institutions represented by planning committee members, and inclusion and distribution herein does not constitute an endorsement of views expressed by the same. Printed materials included herein are not refereed publications. Citations should appear as follows. EXAMPLE: Authors. 2025. Title of presentation. Waste to Worth. Boise, ID. April 7-11, 2025. URL of this page. Accessed on: today’s date.