Currently, all the Bay states are working to achieve nutrient reduction goals from various pollution sources. Significant reductions in phosphorus pollution from agriculture, particularly with respect to phosphorus losses from land application of manure are needed to support a healthy aquatic ecosystem. Producers in high-density animal agricultural production areas such as Lancaster County region of Pennsylvania, the Delmarva Peninsula, and the Shenandoah Valley region of Virginia, need viable alternatives to local land application in order to meet nutrient reduction goals.
Field demonstrations will be monitored to determine whether the technologies are environmental beneficial, and economically and technically feasible. Specific measures of performance include: reliability and heat distribution, in-house air quality, avoided propane or electricity use, costs to install and maintain, fertilizer and economic value of ash or biochar produced, air emissions, and fate of poultry litter nutrients. Technology evaluation results will be shared on a clearinghouse website developed in partnership with eXtension.
The Farm Manure to Energy Initiative is also supporting efforts to develop markets for nutrient rich ash and biochar co-products. Field trials using nutrient rich ash and biochar from poultry litter thermochemical processes for fresh market vegetable production are currently underway at Virginia Tech’s Eastern Shore Agricultural Research and Experiment Station.
Purpose
The Farm Manure to Energy Initiative is a collaborative effort to evaluate the technical, environmental, and economic feasibility of farm-scale manure to energy technologies in an effort to expand management and revenue-generating opportunities for excess manure nutrients in concentrated animal production regions of the Chesapeake Bay watershed.
What Did We Do?
The project team went through a comprehensive review process and identified three farm-scale, manure to energy technologies that we think have the potential to generate new revenue streams and provide alternatives to local land application of excess manure nutrients. Installation and performance evaluation of two of these technologies on four host farms in the Chesapeake Bay region are underway. Partners have also completed a survey of financing options for farm-scale technology deployment and published a comprehensive financing resources guide for farmers in the Chesapeake Bay region.
What Have We Learned?
To date, we have not identified any manure to energy technologies that also provide alternatives to local land application of excess manure nutrients for liquid manures. Thermochemical manure to energy technologies using poultry litter as a fuel source seem to show the most promise for offering opportunities to export excess nutrients from phosphorus hotspots in the Chesapeake Bay region. Producing heat for poultry houses is the most readily available energy capture option. We did not identify any vendors with a proven approach to producing electricity via farm-scale, thermochemical manure to energy technologies. With respect to the fate of poultry litter nutrients, preliminary air emissions data indicates that most poultry litter nitrogen (greater than 98%) is converted to non-reactive nitrogen in the thermochemical process. Phosphorus and potash are preserved in the ash or biochar coproducts. Preliminary field trial results indicate that phosphorus in ash and biochar is bioavailable and can be used as a replacement for commercial phosphorus fertilizer, but bioavailability varied according to the thermochemical process.
Future Plans
We are currenty in the process of installing and measuring the performance of farm-scale demonstrations in the Chesapeake Bay region. We are collaborating with the Livestock and Poultry Environmental Learning Center to develop a clearinghouse website for thermochemical farm-scale manure to energy technologies that will be hosted on the eXtension website. Performance data from our projects will be shared on this website, which can also be used as a platform to share information about the performance of other farm-scale, thermochemical technology installations around the U.S. Technical training events using farm demonstrations as an educational platform will be hosted during the later half of the project. Additional field and row crop trials to demonstrate the fertilizer value of the concentrated nutrient coproducts are also planned using ash from farm demonstrations.
Authors
Jane Corson-Lassiter, USDA NRCS, Jane.Lassiter@va.usda.gov; Kristen Hughes Evans, Executive Director, Sustainable Chesapeake
Additional partners in the Farm Manure to Energy Initiative include: Farm Pilot Project Coordination, Inc., University of Maryland Center for Environmental Studies, University of Maryland Environmental Finance Center, Virginia Cooperative Extension, Lancaster County Conservation District, the Virginia Tech Eastern Shore Agricultural Research and Extension Center, National Fish and Wildlife Foundation, Chesapeake Bay Funders Network, Chesapeake Bay Commission, and International Biochar Institute.
Funding for this project is provided by a grant from the USDA Conservation Innovation Grant program, the National Fish and Wildlife Foundation via the U.S. EPA Innovative Nutrient and Sediment Reduction Program, the Chesapeake Bay Funders Network, as well as technology vendors and host farmers participating in the technology demonstrations.
The authors are solely responsible for the content of these proceedings. The technical information does not necessarily reflect the official position of the sponsoring agencies or institutions represented by planning committee members, and inclusion and distribution herein does not constitute an endorsement of views expressed by the same. Printed materials included herein are not refereed publications. Citations should appear as follows. EXAMPLE: Authors. 2013. Title of presentation. Waste to Worth: Spreading Science and Solutions. Denver, CO. April 1-5, 2013. URL of this page. Accessed on: today’s date.
* Presentation slides are available at the bottom of the page.
For more than a decade, the potential to earn revenue from climate-saving activities in agriculture has been touted throughout farm-related industries. This presentation will assume a basic knowledge of the concept of carbon markets as a kind of ecosystem service market. The focus will instead be put on current market opportunities and the importance of learning from past mistakes. Included in the discussion will be carbon offset opportunities for methane capture from manure digesters and composting and nitrous oxide reduction from controls on nitrogen fertilization. Participants will learn about voluntary and compliance market opportunities and the value of offsets versus transactions costs in today’s markets. Sources of market information will also be discussed.
Topics:
Ecosystem services markets: Carbon credits and more.
Types of offsets relevant to livestock and crop producers (e.g., methane and nitrous oxide).
Rules of the road: How to read the key parts of project protocols.
Once and future markets: Consider the differences between voluntary and compliance markets.
Show us the money: Have any producers really made money from carbon markets?
Purpose
During the past decade, the potential to earn revenue from greenhouse gas reductions in agriculture, especially from anaerobic digestion projects, generated some enthusiasm for this emerging ecosystem market. In 2005, dairies in Washington and Minnesota received the first carbon credit payments for their digesters through the Chicago Climate Exchange (CCX), a pilot cap-and-trade market established in 2003. With the failure of the 111th Congress to complete passage of a national cap-and-trade law in the summer of 2010, the CCX closed shop. What has happened since that time? What is the potential today for livestock producers to benefit from carbon markets or carbon pricing? We look at current markets and summarize the opportunities.
What Did We Do?
The Washington State University (WSU) Energy Program monitors technology, policy and market developments about anaerobic digestion as part of its land-grant mission to support industry and agriculture in Washington state. Because of the potential value of digesters to dairy producers, we follow developments in a wide range of existing and potential ecosystem markets, including renewable energy and fuels, carbon/GHGs, nutrients, and water. Preparation for this presentation included surveys of academic and popular literature, interviews with project developers and market insiders, and analysis of the participation in carbon trading by existing livestock digester projects in the U.S.
What Have We Learned?
The existing landscape of livestock anaerobic digestion projects illustrates three major types or models of carbon market finance: utility-based programs, voluntary carbon markets and compliance-based cap-and-trade markets.
Utility-Based Opportunities
Vermont is home to at least 15 operational dairy-based digesters. Only two digesters serve farms with more than 2,000 cows. Of the balance, about half are below and half above 1,000 cows. All of the Vermont digesters produce renewable electricity and participate in one or more utility-based incentive programs. One example is the Vermont’s Sustainably Priced Energy Enterprise Development (SPEED) program, which establishes standard offer contracts between utilities and renewable energy project developers. The goal of the SPEED program is to support in-state production of renewable power from hydro, solar PV, wind, biomass, landfill gas and farm methane with an overall portfolio target of 20 percent by 2017.
A key mechanism of the program is the long-term (20-year) Standard Offer contract and default pricing for the different types of renewable power. Default prices were calculated to allow developers to recover their costs with a positive return on investment. The default prices established for the first two rounds of farm methane projects were $0.16/kWh and $0.14/kWh, respectively. This compares to an average retail price of $0.146/kWh for electricity in the state. The default prices do not account for the environmental attributes of the green power for farm methane projects.
Many of the Vermont digesters participate in the Cow Power Program, established by the former Central Vermont Public Service (CVPS), now a part of Green Mountain Power, in 2004. The Cow Power Program offers customers the opportunity to purchase the environmental attributes (renewable energy and GHG reduction) from participating dairy digester projects at a rate of $0.04/kWh. This value was passed along to the suppliers of the dairy-based green power.
These two Vermont programs continue to operate in tandem and provide maximum benefit to Vermont’s diary digester projects. By one estimate, customers participating through the Cow Power program have provided to dairy digester operators more than $3.5 million in value for the environmental attributes created in the past eight years.
Other examples of this type of type of utility-based standard offer or incentive pricing for farm power can be found in North Carolina and Wisconsin.
Voluntary Carbon Offsets Opportunities
Voluntary carbon markets are built on decisions by utilities, corporations, and other businesses to offset their carbon footprint impacts through the purchase of third-party verified carbon credits. While the voluntary carbon market has suffered ups and downs, especially during the recent economic downturn, corporations continue to respond to pressures such as corporate stewardship policies or carbon disclosure programs that require accounting for environmental and greenhouse gas impacts.
The voluntary market is inhabited by both nonprofit and for-profit organizations that bring sellers and buyers together. The types and value of offsets are more varied, depending on the appetites and budgets of the buyers.
For example, the voluntary carbon market has been a preferred option for Washington-based Farm Power, which has agreements with The Carbon Trust (Portland, OR) and Native Energy (Burlington, VT) for carbon credits generated from the capture and destruction of methane from its farm digester projects in Washington state. Both The Carbon Trust and Native Energy use designated registries and protocols, such as the Carbon Action Registry (CAR) or Verified Carbon Standard (VCS), as the vehicle through which credits are registered, verified, and eventually retired on behalf of their customers.
The Climate Trust – Retires registered carbon offsets on behalf of at least five Oregon-based utilities that are required by state law to offset the GHG impacts that occur from installing new power plants in the state. The Trust also sources offsets for the Smart Energy program created by NW Natural as an opportunity for customers to support production of “carbon-neutral” natural gas through farm-based biodigesters.
Native Energy – Has a diverse base of individual and business customers. They source carbon offsets for a wide range of large, environmentally conscious businesses, such as eBay, Stonyfield Farm, Brita, and Effect Partners, who provided some funding up front for offsets from Farm Power’s Rainier Biogas project. Offset values vary widely depending on demand, supply, and the “value” of the project’s story. In a few cases, offset values may loosely track the prices for compliance-grade carbon offsets with a discount for funding provided in advance of project implementation.
Compliance Cap-and-Trade Offsets Opportunities
Finally, the compliance market opportunity refers to cap-and-trade programs established by state governments to reduce GHG pollution. These are formal regulatory systems. The government establishes caps on GHGs for targeted sources and issues permits or allowances that are distributed, sold, or auctioned to regulated entities for each ton of emissions they generate. Allowances are typically tradable instruments, so entities can easily manage their allowance needs and accounts. The goal of cap-and-trade systems is to use market-based mechanisms to achieve pollution reductions at the lowest possible cost and with the least disruption to the economy.
Systems might also allow covered entities to use offsets generated voluntarily by non-covered entities to meet some portion of their emission reduction target. Allowed offsets are generated using approved protocols, verified by approved third-party verifiers, and registered/sold through approved registries.
Two domestic cap-and-trade programs survived the past decade and are in operation today—the Regional Greenhouse Gas Initiative (RGGI), which involves nine Northeastern states, and the California market, established by Assembly Bill 32 (AB 32) and administered by the California Air Resources Board (CARB). Each of these systems operates under its own sets of rules.
The table below highlights features of these two market approaches.
Regional Greenhouse Gas Initiative (RGGI)
AB 32 – California Market
Nine states: Connecticut, Delaware, Maine, Maryland, Massachusetts, New Hampshire, New York, Rhode Island, and Vermont
California only (may establish a market connection with Ontario, Canada)
Covers the electricity sector: 200 power plants
Covers power and industrial entities that generate more than 25,000 metric tons of CO2e annually; will expand to include the transportation fuel sector in 2015
Allowances based on U.S. short tons of CO2
Allowances based on metric tons of CO2
Allowances are auctioned
Allowances are auctioned, with a minimum floor price of $10/MtCO2e
Offsets are very limited – few types, very strict rules, only 3% of compliance allowed
Offsets are allowed in four categories: livestock methane, forestry, urban forestry, and ozone-depleting substances; entities may use offsets for up to 8% of their compliance obligation
Current auction prices: ~ $2.00
Current auction prices: ~$13.50; offset values are estimated to lag allowance prices by about 25%
Among farm digester project developers, interest in the California market is guarded. Agricultural methane capture and destruction is one of just four approved offset categories. The demand for these offsets could become strong, and the rules allow projects from any state to participate. On the other hand, the costs for monitoring equipment can be significant, $15,000 or more for start up, with similar sums every year for verification and registration. These monitoring and transaction costs will tend to favor projects with larger livestock numbers (1,500+ dairy animal units, or AUs). To date, 60 existing digester projects have listed with the Climate Action Registry—a first step to participation in the California market. Of these projects, 36 have registered more than 800,000 verified carbon credits.
Conclusions:
Values for carbon (i.e., GHG reductions) can be observed in the marketplace and measured in terms of market goodwill or as prices for environmental attributes or carbon credits from voluntary and compliance markets.
Developers of smaller farm digester projects (<1,500 AUs) may find their best value through utility-based incentive programs or through participation in voluntary carbon markets.
Developers of larger farm digester projects (>1,500 AUs) should explore the potential costs and benefits of registering to participate as an offset project in the California carbon market.
Future Plans
The WSU Energy Program will continue to monitor market developments related to this topic and encourage livestock producers to consider methane capture and anaerobic digestion as means to control odors, manage nutrients, and produce valuable biogas resources.
Authors
Jim Jensen, Sr. Bioenergy and Alternative Fuel Specialist, Washington State University Energy Program jensenj@energy.wsu.edu
The authors are solely responsible for the content of these proceedings. The technical information does not necessarily reflect the official position of the sponsoring agencies or institutions represented by planning committee members, and inclusion and distribution herein does not constitute an endorsement of views expressed by the same. Printed materials included herein are not refereed publications. Citations should appear as follows. EXAMPLE: Authors. 2013. Title of presentation. Waste to Worth: Spreading Science and Solutions. Denver, CO. April 1-5, 2013. URL of this page. Accessed on: today’s date.
We conducted a field study on corn to evaluate the effect of liquid dairy manure applied pre-plant (injection or surface broadcast with immediate or 3-day disk incorporation) or sidedressed at 6-leaf stage (injected or surface-applied) on emission of NH3 and N2O. Manure was applied at a rate of 6500 gal/acre, which supplied an average of 150 lb/acre of total N and 65 lb/acre of NH4-N. Ammonia emission was measured for 3 days after manure application using the dynamic chamber/equilibrium concentration technique, and N2O flux was quantified using the static chamber method at intervals of 3 to 14 days throughout the season. Ammonia-N losses were typically 30 to 50 lb/acre from pre-plant surface application, most of the loss occurring in the first 6 to 12 hours after application. Emission rates were reduced 60-80% by quick incorporation and over 90% by injection. Losses of N2O were relatively low (1 lb/acre or less annually), but pronounced peaks of N2O flux occurred from either pre-plant or sidedress injected manure in different years. Results show that NH3 emission from manure can be reduced substantially by injection or quick incorporation, but there may be some tradeoff with N2O flux from injection.
Why Study Land Application Emissions of Ammonia and Nitrous Oxide?
Figure 1. Injection equipment used for pre-plant application (top) and sidedress application (bottom) of liquid dairy manure.
Manure is a valuable source of nitrogen (N) for crop production, but gaseous losses of manure N as ammonia (NH3) and nitrous oxide (N2O) reduce the amount of N available to the crop and, therefore, its economic value as fertilizer. These N losses can also adversely affect air quality, contribute to eutrophication of surface waters via atmospheric deposition, and increase greenhouse gas emission. And the decreased available N in manure reduces the N:P ratio and can lead to a more rapid build-up of P in the soil for a given amount of available N. The most common approach to controlling NH3 volatilization from manure is to incorporate it into the soil with tillage or subsurface injection, which can reduce losses by 50 to over 90% compared to surface application (Jokela and Meisinger, 2008). Injecting into a growing corn crop at sidedress time offers another window of time for manure application (Ball-Coelho et al., 2006). While amounts of N lost as N2O are usually small compared to NH3, even low emissions can contribute to the greenhouse effect because N2O is about 300 times as potent as carbon dioxide in its effect on global warming (USEPA, 2010). We carried out a 4-year field experiment to evaluate the effect of dairy manure application method and timing and time of incorporation on a) corn yield, b) fertilizer N credits, c) ammonia losses, and) nitrous oxide emissions.
What Did We Do?
Figure 2. Average (2009-2011) NH3-N emission rates as affected by method and timing of manure application.
This field research was conducted at the Univ. of Wisconsin/USDA Agricultural Research Station in Marshfield, WI, on predominantly Withee silt loam (Aquic glossudalf), a somewhat poorly drained soil with 0 to 2% slope. Dairy manure was applied either at pre-plant (mid- to late May) or sidedress time (5-6-leaf stage). Pre-plant treatments were either injected with an S-tine injector (15-inch spacing; Fig. 1) or incorporated with a tandem disk immediately after manure application (< 1 hour), 1-day later, or 3 days later. All plots were chisel plowed 3 to 5 days after application. Sidedress manure applications were either injected with an S-tine injector (30-inch spacing) or surface applied (Fig. 1). Fertilizer N was applied to separate plots at pre-plant at rates of 0, 40, 80, 120, 160, and 200 lb/acre as urea and incorporated with a disk. Liquid dairy manure (average 14% solids) was applied at a target rate of 6,500 gal/acre. Manure supplied an average of 158 lb total N and 62 lb NH4-N per acre, but rates varied across years and application times.
Ammonia emission was measured following pre-plant and sidedress manure applications in 2009-2011 with the dynamic chamber/equilibrium concentration technique (Svensson, 1994). Measurement started immediately after manure application and continued through the third day. Ammonia measurement ended just before disking of the 3-day incorporation treatment, so the 3-day treatment represents surface-applied manure. Nitrous oxide was measured using the static, vented chamber technique following the GRACEnet protocol (Parkin and Venterea, 2010). Measurement began two days after pre-plant manure application and continued approximately weekly into October.
What Have We Learned?
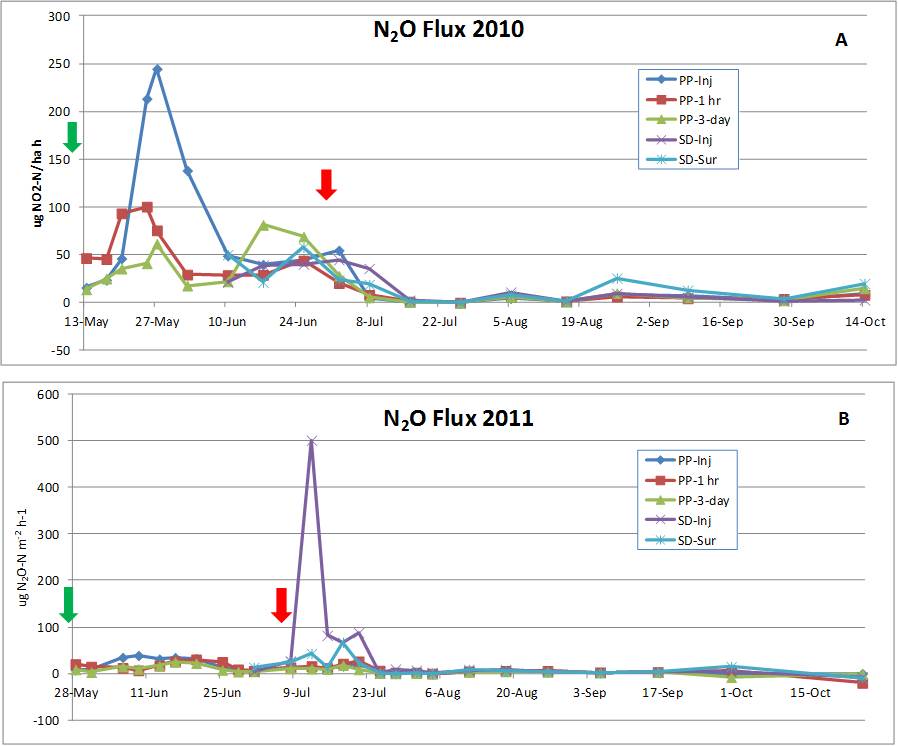
Figure 3. Nitrous oxide (N2O) flux as affected by method and timing of dairy manure application from May to October of 2010 (A) and 2011 (B). Arrows show times of manure application. Note differences in scale for 2010 and 2011.
The 3-year average annual NH3 emission rate from surface applied (3-day incorporation) manure was relatively high immediately following application but declined rapidly after the first several hours to quite low levels (Fig. 2). Cumulative NH3-N loss over the full measurement period averaged over 40 lb/acre from surface application but was reduced by 75% with immediate disking and over 90% by injection. Ammonia losses varied somewhat by year, but patterns over time and reductions by incorporation were similar. The pattern of ammonia loss, 75% of the total loss in the first 6 to 12 hours, emphasizes the importance of prompt incorporation to reduce losses and conserve N for crop use.
Nitrous oxide flux was quite low for most manure treatments during most of the May to October period in both years (Fig. 3). However, there were some increases in N2O flux after manure application, and pronounced peaks of N2O emission from the injection treatment at either pre-plant (2010) or sidedress (2011) time. Greater emission from injection compared to other treatments may have occurred because injection of liquid manure places manure in a relatively concentrated band below the surface, creating anaerobic (lacking in oxygen) conditions. Nitrous oxide is produced by denitrification, a microbial process that is facilitated by anaerobic conditions. Reasons for the difference between 2010 and 2011 are not readily obvious, but are probably a result of different soil moisture and temperature conditions.
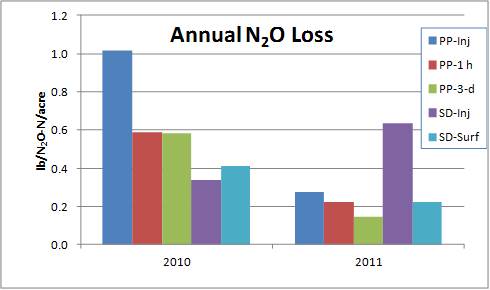
Figure 4. Annual (May-Oct.) loss of N2O as affected by method and timing of liquid dairy manure application. 2010 and 2011.
Based on these results, injection of liquid dairy manure resulted in opposite effects on NH3 and N2O emission, suggesting a trade-off between the two gaseous N loss pathways. However, the total annual N losses from N2O emissions (1 lb/acre or less; Fig. 4) were only a fraction of those from ammonia volatilization, so under the conditions of this study N2O emission is not an economically important loss. As noted earlier, however, N2O is a potent greenhouse gas, so even small amounts can contribute to the potential for global climate change. The dramatic reduction in NH3 loss from injection, though, may at least partially balance out the increased N2O because 1% of volatilized N is assumed to be converted to N2O (IPCC, 2010). Immediate disk incorporation was almost as effective as injection for controlling NH3 loss and, on average, resulted in less N2O emission than injection. But the separate field operation must be done promptly after manure application to be effective. A possible alternative is to use sweep injectors or other direct incorporation methods that place manure over a larger volume of soil and/or create more mixing with soil, thus creating conditions less conducive to denitrification and N2O loss.
Manure application timing and method/time to incorporation significantly affected grain yield in 2009, 2010, and 2012 and silage yield in 2012. Pre-plant injection produced greater yields than one or more of the broadcast treatments in 2009 (grain) and 2012 (grain and silage). Overall, yield effects of application and incorporation timing were variable from year to year, probably because of differences in weather and soil conditions and actual manure N rates applied. The fertilizer N equivalence of manure was calculated by comparing the yield achieved from each manure treatment to the yield response function from fertilizer N. Fertilizer N equivalence values were quite variable by year, but 4-year averages expressed as percent of total manure N applied were 52% for injection (pre-plant and sidedress), 37% for 1-hour or 1-day incorporation, and 34% for 3-day incorporation. So, when expressed as a percent of total manure N applied, N availability generally decreased as time to incorporation increased, which reflects the amounts of measured NH3 loss.
In summary, ammonia volatilization losses increased as the time to incorporation of manure increased. Injection of manure resulted in the lowest amount of NH3 volatilization, but higher N2O emissions. In this study, reducing the large NH3 losses by injecting manure provided more environmental benefit compared to the small increase in N2O emissions. In addition, injection or immediate incorporation resulted, on average, in higher fertilizer N value of manure for corn production. The decreased need for commercial fertilizer N could potentially result in greater profitability and a smaller carbon footprint.
Future Plans
We have started other research to evaluate yield response, N cycling, and emission of NH3 and N2O from various low-disturbance manure application methods in silage corn and perennial forage systems.
Authors
Bill Jokela, Research Soil Scientist, USDA-ARS, Dairy Forage Reserch Center, Marshfield, WI, bill.jokela@ars.usda.gov
Carrie Laboski, Assoc. Professor, Dept. of Soil Science, Univ. of Wisconsin
Todd Andraski, Researcher, Dept. of Soil Science, Univ. of Wisconsin
Additional Information
Ball Coelho, B.R., R.C. Roy, and A.J. Bruin. 2006. Nitrogen recovery and partitioning with different rates and methods of sidedressed manure. Soil Sci. Soc. Am. J. 70:464–473.
Intergovernmental Panel on Climate Change (IPCC). 2006 IPCC Guidelines for National Greenhouse Gas Inventories, vol. 4, Agriculture, Forestry and Other Land Use, edited by S. Eggleston et al., Inst. for Global Environ. Strategies, Hayama, Japan.
The authors gratefully acknowledge Matt Volenec and Ashley Braun for excellent technical assistance in conducting this research. Funding was provided, in part, by the USDA-Agricultural Research Service and the Wisconsin Corn Promotion Board.
The authors are solely responsible for the content of these proceedings. The technical information does not necessarily reflect the official position of the sponsoring agencies or institutions represented by planning committee members, and inclusion and distribution herein does not constitute an endorsement of views expressed by the same. Printed materials included herein are not refereed publications. Citations should appear as follows. EXAMPLE: Authors. 2013. Title of presentation. Waste to Worth: Spreading Science and Solutions. Denver, CO. April 1-5, 2013. URL of this page. Accessed on: today’s date.
Why Study the Interaction Between Energy and Nutrients for Digestion?
To improve the energy production and revenue generation, many farm digester operators are including off-farm feedstocks in the blend. Off-farm feedstocks are raw materials with high carbon concentrations that can be degraded anaerobically. Common off-farm feedstocks include food service or retail waste, food processing byproducts, residuals from biofuels production and FOG (fat, oil & grease) resulting from food preparation. Typically, off-farm feedstocks have a higher energy potential when compared to manure. Manures generally have biogas potential in the range of 280 to 500 L of biogas/kg of VS, compared to off-farm feedstocks which can range from 300 to 1,300 L of biogas/kg of VS [1]. In addition to the increased biogas production, revenue can also be generated from tipping fees collected for feedstock brought onto a farm. The tipping fee is typically comparable to the cost of disposing of the material at a landfill or wastewater treatment plant.
The purpose of this ongoing project is to evaluate the biogas potential and impact on nutrient management of off-farm feedstocks for anaerobic digestion.
What Did We Do?
The Anaerobic Digestion Research and Education Center (ADREC) has carried out hundreds of biogas methane potential tests (BMP’s) over the past 5 years. The purpose of the BMP is to evaluate if a feedstock is anaerobically degradable and predict the biogas production under ideal conditions. As part of the biogas testing, many feedstocks were also characterized for their nutrient composition.
What Have We Learned?
While off-farm feedstocks do offer opportunities to improve the profitability of anaerobic digestion systems, operators must also consider the costs associated with bring material onto the farm. Water contained in off-farm feedstock contributes to the manure volume and adds cost during land application. Nutrients contained in feedstocks need to be measured and considered in the context of nutrient management planning. In addition, the regulatory and record keeping requirements associated with off-farm feedstock should also be factored into any cost-benefit analysis.
Future Plans
ADREC is planning to continue the BMP evaluations as part its normal fee for service activities.
The authors are solely responsible for the content of these proceedings. The technical information does not necessarily reflect the official position of the sponsoring agencies or institutions represented by planning committee members, and inclusion and distribution herein does not constitute an endorsement of views expressed by the same. Printed materials included herein are not refereed publications. Citations should appear as follows. EXAMPLE: Authors. 2013. Title of presentation. Waste to Worth: Spreading Science and Solutions. Denver, CO. April 1-5, 2013. URL of this page. Accessed on: today’s date.
* Presentation slides are available at the bottom of the page.
Abstract
Self-scraping system in hog confinement building.
Animal manure is often utilized by the American agriculture industry as fertilizer without considering the potential energy production. It is well established that on-farm anaerobic digestion (AD) can be effective in providing energy, reducing greenhouse gas emissions, and controlling air and water pollutions. Knowledge of the ADs on biogas production, digested and stored manure nutrients, and air emissions must reach parties of interest. A modular, pilot-scale, mesophilic AD system is being installed for the new swine finishing facility at University of Missouri-Columbia Research Farm.
The new AD design utilizes three insulated, reinforced fiber-glass tanks of 2500-gallon in size, which are commercially available. One tank is designed for feedstock storage and mixing, and the other two tanks are for digestion. The dual-tank set up provides research flexibility as either single stage with two-stream parallel replication or dual-stage single-stream experiments. The design employs small biogas (generated by the AD) boilers for heating the digester tanks and system building. It also features a feedstock-digestate heat-exchanger for heat reclamation to reduce net energy input; which will be critical to the small and mid-size AD systems not generating electricity (no waste-heat from engines).
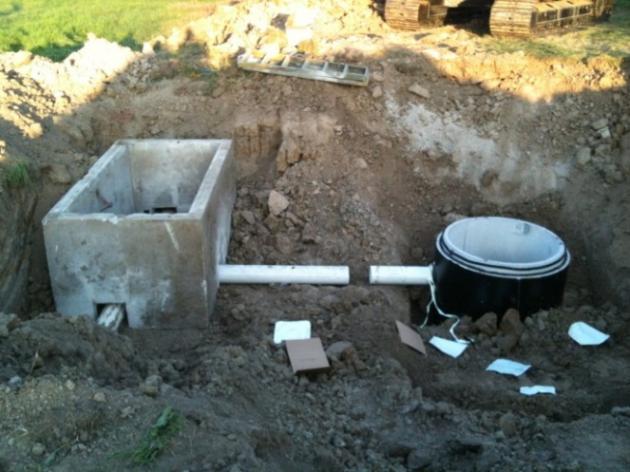
Valve control box (under construction). This allows extra manure and effluent to be discharged directly to the lagoon or to pump fresh manure directed back to the digester.
The system also includes a geothermal heat exchanger for biogas cooling to collect condensate in the biogas along with a small iron sponge to reduce H2S concentrations which improves the biogas quality. Excess biogas will be burned in boiler and the heat produced will be dissipated through a dual purpose radiator. The radiator provides building heat in winter and releases heat outside in summer. The goals of this project are to demonstrate AD for small and mid-size swine productions, quantify and characterize manure nutrient changes due to AD and storage, and develop baseline emission factors for raw and digested manure. This paper reports the design, construction and implementation of the AD system.
Why Study Small-Scale Anaerobic Digestion?
The purpose of this project is to establish a pilot scale, on-farm anaerobic digester (AD) that demonstrates and evaluates the potential energy production, manure management, and overall economic viability of such systems. This research will provide invaluable information for small to medium sized swine farms seeking viable energy alternatives, practical manure management practices and air quality improvements.
What Did We Do?
Current digester system enclosed in greenhouse.
Construction began in the Fall of 2012, at the University of Missouri-Columbia’s Swine Teaching and Research Farm. This modular, pilot-scale, mesophilic AD system is being constructed next to a four-room swine finishing research barn. Each of the finishing room has individual deep-pit storage, with a pull-plug system for draining the manure to the lagoon. Manure scraper systems are installed in two of the rooms to more frequently collect the manure. The AD system is comprised of three insulated, reinforced fiber-glass tanks, each with a capacity of 2500-gallons. The first tank is designed for feedstock storage and pre-mixing, while the other two are for digestion. The dual tank set up allows flexibility for researchers to conduct experiments either with a single stage, two-stream parallel replication or dual-stage single-stream digestion process. The system employs a biogas (generated by AD) boiler for heating the digestion tanks to maintain continuity. A 3,000 gallon biogas bladder storage unit stores the biogas for a few hours. A feedstock-digestate heat exchanger is designed for heat reclamation to increase net energy output; which will be critical to a small to mid-size AD systems that do not generate electricity (no waste-heat from biogas engines). The boilers also supply heat to the AD housing through radiators, while the excess biogas will be flared off.
What Have We Learned?
Designing and implementing an AD system is complex and time consuming. It is very important to involve a good engineering or technical support team. If the barn is not designed to accommodate an AD system, significant consideration is needed to manage the manure collection and transport, and to maintain manure freshness and solids content. Project management is critical to consider planning and coorperation between the farm personnel and management, utility and construction companies, and the engineering support firm.
Future Plans
Pilot test will be conducted to examine and fine-tune the system. The AD system is designed for research and demonstration purposes. Submitted proposals include plans for studying the improved efficiency due to better design and heat-exchangers, effects of feedstock, co-digestion, feedstock pre-treatment on biogas production, and characterizing greenhouse gas emissions from untreated manure and AD-treated manure.
Authors
Brandon Harvey, Research Assistant, Agricultural Systems Management, University of Missouri bchfzf@mail.missouri.edu
Teng Lim, Assistant Professor, Agriculture Systems Management, University of Missouri. Kevin Rohrer, Engineer, Martin Machinery, LLC.
The authors are solely responsible for the content of these proceedings. The technical information does not necessarily reflect the official position of the sponsoring agencies or institutions represented by planning committee members, and inclusion and distribution herein does not constitute an endorsement of views expressed by the same. Printed materials included herein are not refereed publications. Citations should appear as follows. EXAMPLE: Authors. 2013. Title of presentation. Waste to Worth: Spreading Science and Solutions. Denver, CO. April 1-5, 2013. URL of this page. Accessed on: today’s date.
Colorado is the second highest producer of high solids cattle waste (HSCW) in the United States. Despite the available resources, Colorado currently has only one operational anaerobic digester treating manure (AgSTAR EPA 2011), which is located at a hog farm in Lamar. Arid climate and limited water resources in Colorado render the implementation of high water demanding conventional AD processes. Studies to date have proposed high solids AD systems capable of digesting organic solid waste (OSW) not more than 40% total solids (TS). Lab tests have shown that HSCW produced in Greeley (Colorado) has an average of 89.4% TS. Multi-stage leach bed reactor (MSLBR) system proposed in the current study is capable of handling HSCW of up to 90% TS.
What Did We Do?
Hydrolysis is carried out in a trickle flow leach bed reactor (TFLBR) and methanogenesis can be carried out in a high rate anaerobic digester (HRAD) like an upflow anaerobic sludge blanket reactor or a fixed film reactor. The objective of this research is to evaluate and optimize the performance of the TFLBR. The system was operated as a batch process and the organic leaching potential of a single pass TFLBR configuration was evaluated. The organic leaching potential was measured in terms of chemical oxygen demand (COD).
Three series’ of reactor experiments were carried out in total. Each subsequent experiment was based on the results on the previously conducted experiment. First set of reactor experiments included three TFLBRs (triplicate) loaded with HSCW. The difficulty encountered during the operation of this experiment was that the flow rate of water through the TFLBR slowed down over time and eventually dropped to zero within the first 24 hrs. This caused water build-up on top of the manure bed, resulting in the failure of hydrolysis. Second set of reactor experiments included six TFLBRs (two sets of triplicates). One set of triplicate was loaded with HSCW and the other set of triplicate was loaded with HSCW bulked with straw (5% by mass) to improve the porosity through the reactor. A layer of fine sand was added on top of the manure bed to facilitate water dispersion through the reactor.
The third set of reactor experiments included the comparison between nutrient dosed and non-nutrient dosed reactors (each carried out in triplicates). The idea behind dosing nutrients to an operational TFLBR was to check if the reactors were nutrient limited during the digestion process. Composite sampling technique was adopted so as to capture the exact leaching potential from each of the reactors.
What Have We Learned?
The first set of reactor experiments helped in identifying the clogging issues in operational TFLBRs handling HSCW. The second set of reactor experiments validated the use of fine sand as a better alternative to improve hydraulic flow when compared to the use of bulking agents. The third set of reactor experiments indicated that the addition of nutrient solution to a single-pass TFLBR operation is essential in improving the overall system yield. Leachate collection by composited sampling method instead of the instantaneous sample method improved the system efficiency by approximately 50%. The average TS reductions in the non-nutrient dosed and nutrient dosed TFLBRs were 23.18% and 22.67% respectively. The non-nutrient dosed TFLBRs underwent approximately 66.32% of COD reduction and the nutrient dosed TFLBRs underwent approximately 73.51% of COD reduction due to COD leaching during hydrolysis, over the period of six weeks. Biochemical methane potential (BCMP) test results indicate high biogas yields from the weekly composited leachate from the reactor experiments proving successful system operation. Approximately 0.43 L CH4/g COD is produced from the leachate collected from the non-nutrient dosed TFLBRs and 0.57 L CH4/g COD is produced from the leachate collected from the nutrient dosed TFLBRs.
Future Plans
The proposed MSLBR system recommends TFLBRs operating under leachate recirculation. The addition of nutrient solution in a leachate recirculated TFLBR would not be unnecessary since the nutrients in the system would be conserved. The success of hydraulic conductivity and leaching quality in a leachate recirculated TFLBR is unknown. More research is required to completely understand the operation and success of the MSLBR system treating HSCW. Pilot scale reactor experiments should be conducted to monitor the operation of the TFLBRs under leachate recirculation.
Authors
Asma Hanif, Graduate Student in Civil & Environmental Engineering, Colorado State University, asmahanif1988@gmail.com
Dr. Sybil Sharvelle, Assistant Professor in Civil & Environmental Engineering, Colorado State University, Sybil.Sharvelle@colostate.edu
The authors are solely responsible for the content of these proceedings. The technical information does not necessarily reflect the official position of the sponsoring agencies or institutions represented by planning committee members, and inclusion and distribution herein does not constitute an endorsement of views expressed by the same. Printed materials included herein are not refereed publications. Citations should appear as follows. EXAMPLE: Authors. 2013. Title of presentation. Waste to Worth: Spreading Science and Solutions. Denver, CO. April 1-5, 2013. URL of this page. Accessed on: today’s date.
The American Veterinary Medical Association (AVMA) offers several resources to its members and the public regarding various disposal issues encountered by the veterinary community and animal owners. With its veterinary medical expertise, the veterinary profession can be a valuable resource for clients, the general public, regulators, and other stakeholders on carcass and other animal waste disposal issues, especially those involving potential health risks to other animals or the public. The purpose in developing these resources is to further increase awareness by the veterinary profession and its stakeholders of the value, potential hazards, and legal restrictions concerning disposal of animal waste and carcasses.
The AVMA advocates safe and environmentally responsible disposal of animal carcasses, whether on an individual animal basis or during mass mortality events. As such, the AVMA supports increased research and education towards the development of appropriate methods and guidelines for animal carcass disposal.
Animal Carcass Risk in Natural Disasters
Consistent with current scientific literature and the conclusions of the Pan American Health Organization (PAHO), the AVMA recognizes that animals that die from injuries, including massive animal deaths in cases of natural disasters, generally do not represent a health hazard for humans. The presence of dead bodies that result from a disaster, without the presence of another risk factor, is not the cause for the spread of infectious diseases. (1PAHO Manual, Ch 3, Conclusions; p. 81)
1 Management of Dead Bodies in Disaster Situations, Disaster Manuals and Guidelines Series, number 5. Pan American Health Organization, Area on Emergency Preparedness and Disaster Relief, and the World Health Organization, Department for Health Action in Crisis. Washington, DC, 2004.
Animal Agriculture Waste Management
The AVMA supports the basic premises of current federal and state legislation and regulations enacted to prevent negative environmental impacts from wastes generated by terrestrial or aquatic animal productions. Veterinarians should be aware of the value, potential hazards, and legal restrictions concerning animal waste.
Therefore the AVMA supports the following:
Education, outreach, and extension programs to assist producers in meeting or exceeding current federal and state requirements. This includes aid in establishing and implementing nutrient management plans as well as design and construction of effective waste management facilities to prevent contamination of the environment.
Science based research on animal waste management systems and procedures to allow animal waste materials to be utilized as nutrient sources for sustainable agriculture systems.
Scientific studies of the impact of pathogens and chemicals from animal/human waste sources on the environment.
Additionally, the AVMA has developed the microsite, www.avma.org/wastedisposal. Sections of the microsite addressing topics such as “Federal Regulations of Waste Disposal,” “State-based Waste Disposal Resources,” and “AVMA Policies Relevant to Waste Disposal,” are accessible by the general public. Specific “Clinical Resources” pages, such as “Animal Carcass Disposal,” “Animal Waste Disposal,” “Recordkeeping,” and more are accessible only by AVMA members. On a similar note and because of its expertise, the Association was consulted during the development of the Veterinary Compliance Assistance (VetCA) website (www.vetca.org) by the National Center for Manufacturing Sciences under the National Compliance Assistance Centers program. Funding for this latter project has been provided by the U.S. Environmental Protection Agency.
In addition to the pharmaceutical disposal information within the aforementioned resources, the AVMA has partnered with the National Sea Grant Office (NSGO), Office of Oceanic and Atmospheric Research, National Oceanic and Atmospheric Administration (NOAA), U.S. Department of Commerce to combine efforts and develop a joint outreach and educational campaign for veterinary clients regarding proper pharmaceutical disposal. Information and products associated with the collaborative effort are available at www.avma.org/unwantedmeds.
The “Green Veterinary Practices” microsite has also been developed by the AVMA. The web pages provide AVMA members and the public information on sustainable practices. Not only does the site discuss what the AVMA is doing, it also provides resources for integrating eco-friendly features into veterinary practices as well as opportunities for including eco-friendly practices in facility designs. The microsite is available at https://www.avma.org/green-veterinary-practices
In addition to policy and resource development, the AMVA is active in advocacy. Related to waste issues, the Association has weighed in on Federal Register items such as Docket Number [EPA-HQ-OW-2011-0188], the National Pollutant Discharge Elimination System (NPDES) Concentrated Animal Feeding Operation (CAFO) Reporting Rule and Docket Number [EPA-OW-2011-0466], Draft Recreational Water Quality Criteria and Request for Scientific Views. To see additional topics as well as the AVMA’s comments, please visit https://www.avma.org/advocacy/national-advocacy. In 2012, the AVMA joined the Agriculture and Food Research Initiative (AFRI) Coalition urging Congress to support the $325 million for the AFRI in the President’s Fiscal year 2013 budget proposal. To view all of the AVMA’s advocacy information, please click on “Advocacy” from the AVMA’s home page, www.avma.org.
What Have We Learned?
Integrative efforts of multiple disciplines and stakeholders are needed to better enhance the science of waste management as well as to help bridge the gaps between such science and sociopolitical opinions.
Future Plans
As stated in its policies, the AVMA will continue to advocate for safe and environmentally responsible disposal of animal carcasses as well as support:
Education, outreach, and extension programs to assist producers in meeting or exceeding current federal and state requirements
Science based research on animal waste management systems and procedures to allow animal waste materials to be utilized as nutrient sources for sustainable agriculture systems.
Scientific studies of the impact of pathogens and chemicals from animal/human waste sources on the environment.
Authors
Kristi Henderson, DVM, Assistant Director, Scientific Activities Division, American Veterinary Medical Association khenderson@avma.org
The authors are solely responsible for the content of these proceedings. The technical information does not necessarily reflect the official position of the sponsoring agencies or institutions represented by planning committee members, and inclusion and distribution herein does not constitute an endorsement of views expressed by the same. Printed materials included herein are not refereed publications. Citations should appear as follows. EXAMPLE: Authors. 2013. Title of presentation. Waste to Worth: Spreading Science and Solutions. Denver, CO. April 1-5, 2013. URL of this page. Accessed on: today’s date.
* Presentation slides are available at the bottom of the page.
Ammonia and odor emissions from land application of liquid dairy manure, and costs associated with manure land application methods are serious concerns for dairy owners, regulators, academic, and the general public. Odor and ammonia samples from agricultural fields receiving liquid dairy manure applied by surface broadcast and subsurface injection methods were collected and analyzed. Costs associated with both of the manure application methods were estimated. The test results showed that subsurface injection reduced both the odor and ammonia emissions compared with surface broadcast; therefore, applying liquid dairy manure by subsurface injection could be recommended as one of the best management practices to control ammonia and odor emissions. The estimated costs associated with subsurface injection were higher than surface broadcast. However the higher costs could be partially compensated by the higher nitrogen fertilizer value captured in the soil by the deep injection method.
Why Study Air Emissions from Dairy Farms?
A floating self-propelled mixing pump and a remote controller (yellow)
Agriculture is the single most important economic sector in Idaho. Dairy production currently stands as the single largest agricultural pursuit in Idaho. Currently, Idaho ranks as the third largest milk production state in the US. Idaho has roughly 550 dairy operations with 580,000 milk cows. Over 70% of milk cows are located in the Magic Valley in southern Idaho (Idaho Department of Agriculture-Bureau of Dairying, 1/22/2013). A number of dairies in the Magic Valley use flushing systems resulting in huge amount of lagoon water which is applied to crop lands near the lagoons via irrigation systems during the crop growing seasons. The volatilization of ammonia (NH3) from the irrigated lands and lagoons is not only a loss of valuable nitrogen (N), but also causes air pollution. Concentrated dairy production in a limited area such as the Magic Valley has caused air and water quality concerns. Controlling odor and capturing N in dairy manure are big challenges facing the southern Idaho dairy industry.
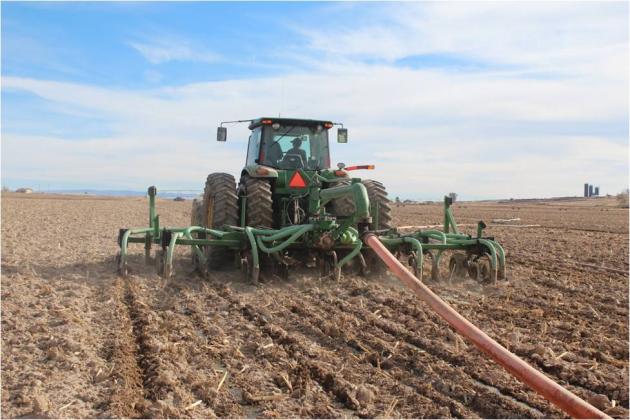
Direct injection incorporates manure directly beneath the soil surface and thus minimizes odor and NH3 emissions during application. Injecting manure decreases soluble phosphorus (P) and N in runoff relative to surface application. Some common types of direct injection applications are liquid tankers with injectors and drag-hose systems with injectors. Manure can be successfully injected in both conventional tillage and non-till systems with currently available equipment. The manure direct injection has been proven in other regions, such as the Midwest, to effectively manage odors and manure nutrients. The purpose of this research was to demonstrate, evaluate, and encourage the widespread adoption of the manure direct injection method in southern Idaho for mitigating odors and managing manure nutrients.
Subsurface injection with drag hose system
What Did We Do?
A manure application field day was held on October 31, 2012 on a dairy in Buhl, Idaho, to demonstrate and evaluate dairy manure land application via a drag-hose system and manure mixing equipment. The dairy had approximately 3,500 milking cows managed in a free-stall and open-lot mix set-up, with about 60% of the cows housed in free stalls. Waste is flushed from lanes running under the feeding alleys and from the milking parlor. The wastewater passes through solids removal equipment and basins and then into three lagoons in series. Manure used for this demonstration study was from the last lagoon, which had about 9 million gallons of manure at the beginning of the demonstration field day and its sludge had been not cleaned for 5 years.
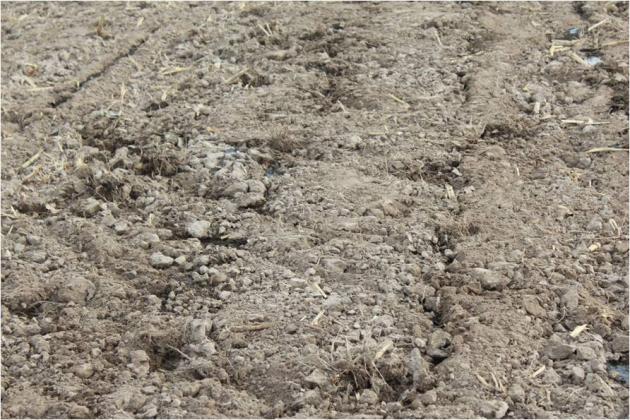
Soil after manure subsurface injection
The on-farm manure application trials conducted at two sites were comprised of two manure application methods: surface broadcast and subsurface injection. At each of the sites, a square plot of approximately 3,600 m2 in the western portion of the site was used for surface broadcast and the rest of the land was used for subsurface injection. The western portion of the site was chosen because the prevailing winds were from the north during the test period. The previous crop at the two sites was corn; both sites had been disked after harvest.
The manure lagoon was agitated before and during application with a floating mixing pump. Manure was pumped from the lagoon directly to the application field via drag hoses. The two manure application methods were demonstrated with the same equipment. Subsurface injection placed manure behind the shank in a band approximately 20 cm (8 inches) deep. Surface broadcast was realized by lifting the shanks above ground so manure was applied on the soil surface. Manure was applied from east to west and back again until the site was finished. The equipment shanks were lifted only when the equipment was in the designated 3,600 m2 square plot for surface application. After manure application in the site, three towers, each 1.5 m high, were placed in a north-to-south orientation with approximately 15 m spacing. The middle tower was placed at the center of the manure surface applied plot. Three towers were placed in the manure subsurface injected field parallel to the ones in the manure surface broadcasted plot and approximately 200 m apart to avoid or minimize cross-contamination between the two manure application methods.
Passive NH3 samplers (Ogawa & Co. USA Inc., Pompano Beach, FL) were installed on each tower at a height of 0.5 and 1 m to determine the NH3 concentration at each location. Ammonia samplers were changed approximately every 24 hours over a two-day period after manure application. Right after collection of NH3 samplers in field, samplers were placed into airtight containers and then shipped back to the U-Idaho Twin Falls Waste Management Laboratory where the NH3 sampler filters were carefully removed from the samplers and transferred into 15-mL centrifuge tubes. Five mL of 1 M KCI was added to each of the centrifuge tubes to extract NH3 trapped in the filters. The extractant was transported to the USDA Northwest Irrigation and Soils Research Laboratory (NWISRL) located in Kimberly, Idaho where it was analyzed for NH4-N using a flow-injection analysis system (Quickchem 8500, Lachat Instruments, Milwaukee, WI). Background concentrations of NH3 were determined by placing three towers 50 m upwind (north) of the site following the same procedure described previously. Concentrations from passive samplers are time-average concentrations for the amount of time the sampler was exposed to the air and were calculated with the following equation:
In this, [NH3-N]air is the concentration of NH3-N in the air, [NH4-N]extractant is the concentration of NH4-N in the extractant, and 31.1 cm3/min is a constant used to calculated diffusion to the trap (Roadman et al., 2003; Leytem et al., 2009). Details regarding the design and calculation of NH3 concentrations can be found in Roadman et al. (2003) and Leytem et al. (2009).
Air samples were collected from the first test site right after manure application using Tedlar bags. One air sample was collected at 1 m above ground from each of the three towers located in the surface broadcast plot, subsurface injection, and background, respectively. A total of nine air samples were collected and then sent via UPS over-night service to Iowa State University Olfactometry Laboratory for odor analysis. The nine air samples were analyzed within 24 hours based on ASTM E679-04 (ASTM, 2004).
For each test site, a grab sample (about 1 L) of liquid manure was collected and transported to a commercial lab (Stukenholtz Laboratory, Inc., located in Twin Falls, Idaho) for pH and total nitrogen analysis. The manure pH, total N, and calculated total N application rates are shown in Table 1. The liquid manure application rate was approximately 20,000 gallons per acre on both the test sites.
Table 1. Manure pH and total N concentrations and application rates of total N at the two test sites
Site and Application Method
Manure pH
Manure total N concentration (mg/L)
Manure total N Application Rate (kg/acre)
Site 1
7.4
3433
257
Site 2
7.3
3519
265
A soil temperature probe with data logger (HOBO U23 Pro v2 2x external temperature data logger-U23-003) was placed 3 cm below the soil surface to record soil temperature data in 15-min increments. Wind speed, temperature, and relative humidity data were obtained from local Buhl Airport, located six miles from the test sites, due to failure of the mobile weather station set on the test sites. The ambient weather conditions and soil temperature at the test sites over the test period are shown in Table 2.
Table 2. Ambient weather conditions and soil temperature at the test sites
Site 1
Site 2
Item
Day 1
Day 2
Day 1
Day 2
Average wind speed, m/s
5.0
4.2
4.2
3.1
Air temperature, average(minimum, maximum),˚F
61 (42, 78)
49 (45, 63)
49 (45, 63)
47 (38, 61)
Average relative humidity, %
28
53
53
51
Soil temperature, average(minimum, maximum), ˚F
50.9 (51.1, 56.1)
47.3 (51.1, 51.2)
46.5 (51.5, 52.1)
66.7 (51.6, 69.1)
Cost analysis was carried out for four different manure land application systems as shown in the “What Have We Learned?” section below. Cost calculations are based on 500 hours annual use for the tractor and 200 hours annual use for the injection system. Tractor operator labor is figured at $11.70/hour, diesel is figured at $4.00/gallon. Equipment costs were determined using the MACHCOST program from the University of Idaho’s department of Agricultural Economics and Rural Sociology. The program is available on the AERS web page at https://www.uidaho.edu/cals/idaho-agbiz/resources/tools. Equipment data was provided by John Smith at Smith Equipment Co. Rupert, ID 83350. Some machinery data was taken from “Costs of Owning and Operating Farm Machinery in the Pacific Northwest” PNW 346 available on line at: https://www.extension.uidaho.edu/publishing/pdf/PNW/PNW0346/PNW0346.html.
What Have We Learned?
Odor results from test site 1
T-test for Odor showed there was no significant difference between the background and subsurface injection (P=0.41), there was significant difference between the background and surface broadcast (P=0.03), and P value was 0.08 for the t-test of mean difference between the subsurface injection and surface broadcast. The field day attendees felt there was significant difference in odor perception between the subsurface injection and surface broadcast methods.
Test site 1
First day ammonia sample results from test site 1.
Second day ammonia sample results from test site 1.
The NH3 concentration data from test site 1 showed significant difference between surface broadcast and subsurface injection based on P<0.05. The NH3 concentration data from test site 1 showed 82% and 64% reduction in NH3 concentration for first and second sampling day, respectively when liquid dairy manure was applied by subsurface injection vs. surface broadcast.
Test site 2
First day ammonia sample results from test site 2.
Second day ammonia sample results from test site 2.
The NH3 concentration data from test site 2 showed significant difference between surface broadcast and subsurface injection based on P<0.05. There were 64% and 41% decrease in NH3 concentration for first and second sampling day, respectively when manure was applied by subsurface injection compared with surface broadcast.
The NH3 concentration data from both the test sites showed lower NH3 concentration in the air from the subsurface injected soil vs. surface applied land which means higher nitrogen fertilizer value captured in the soil by the subsurface injection method.
Cost analysis results:
*Fuel and Lubricant Costs are assigned to the Power Unit.
The above fact sheet summarizes probable costs of operation for a 7,400 gallon tank with a 2,000 gpm discharge rate and a 15 foot wide broadcast unit. A 180 PTO HP tractor is needed to pull this unit at an average ground speed of 8 mph. Up to 10 acres per hour can be covered with the unit. The tank is discharged in approximately 4 minutes. Time and equipment to refill the tank is not included in these calculations.
*Fuel and Lubricant Costs are assigned to the Power Unit.
The above fact sheet summarizes probable costs of operation for a 7,400 gallon tank with a 2,000 gpm discharge rate and a 12 foot wide broadcast unit. A 215 PTO HP tractor is needed to pull this unit at an average ground speed of 7 mph. Up to 7 acres per hour can be covered with the unit. The tank is discharged in approximately 4 minutes. Time and equipment to refill the tank is not included in these calculations.
*Fuel and Lubricant Costs are assigned to the Power Unit.
The above fact sheet summarizes probable costs of operation for a 7,400 gallon tank with a 2,000 gpm discharge rate and a 12 foot wide broadcast unit. A 225 PTO HP tractor is needed to pull this unit at an average ground speed of 7 mph. Up to 7 acres per hour can be covered with the unit. The tank is discharged in approximately 4 minutes. Time and equipment to refill the tank is not included in these calculations.
*Fuel and Lubricant Costs are assigned to the Power Unit.
The above fact sheet summarizes probable costs of operation for a system utilizing 5,280 FT of 8 inch hose and 1,320 FT of 5 inch hose. The pump unit capacity is 1,500 gpm to a 16 foot knife injection unit. A 250 PTO HP tractor is needed for the injection unit operating at 75% field efficiency and at an average ground speed of 3.5 mph. The lagoon pump is a 270 HP unit and operating efficiency assumed at 70%. Beyond 2 miles a booster pump would be necessary. Up to 4.75 acres per hour can be covered with the unit. Operation is continuous as no tank refill is needed.
Based on the estimated costs above, the subsurface injection method has higher costs mainly due to the need of larger tractor and lower operating speed. However, we did not include the time and equipment costs associated with refilling the tank for the tank application system. Due to the short time to discharge the tank on the tank broadcast and tank injection systems additional equipment to refill the tank in a timely fashion would be desirable. This would increase the investment in equipment and also would reduce the number of acres that could be covered per hour due to down time while the tank is refilled.
In summary, subsurface injection can reduce both the odor and NH3 emissions compared with surface broadcast; therefore, applying liquid dairy manure by subsurface injection could be recommended as one of the best management practices to control NH3 and odor emissions. The estimated costs associated with subsurface injection were higher than surface broadcast. However, the higher costs could be partially compensated by the higher nitrogen fertilizer value captured in the soil by the subsurface injection method.
Future Plans
We will finish development of educational videos to demonstrate the manure subsurface injection technique and disseminate results from this study to our stakeholders.
Authors
Lide Chen, Waste Management Engineer and Assistant Professor, Biological and Agricultural Engineering Department, University of Idaho lchen@uidaho.edu
Mario de Haro Marti, Extension Educator
Wilson Gray, District Extension Economist and Extension Professor
Howard Neibling, Extension Irrigation and Water Management Specialist and Associate Professor
Mireille Chahine, Extension Dairy Specialist and Associate Professor
Sai Krishna Reddy Yadanaparthi, Graduate student, University of Idaho
Acknowledgements
This project was supported by the USDA Natural Resource Conservation Service through a Conservation Innovation Grant. We would also like to thank Dr. April Leytem and Mr. Myles Miller (USDA Northwest Irrigation and Soils Research Laboratory (NWISRL) located in Kimberly, Idaho) for their help with analysis of ammonia samples.
The authors are solely responsible for the content of these proceedings. The technical information does not necessarily reflect the official position of the sponsoring agencies or institutions represented by planning committee members, and inclusion and distribution herein does not constitute an endorsement of views expressed by the same. Printed materials included herein are not refereed publications. Citations should appear as follows. EXAMPLE: Authors. 2013. Title of presentation. Waste to Worth: Spreading Science and Solutions. Denver, CO. April 1-5, 2013. URL of this page. Accessed on: today’s date.
This presentation will compare using litter as a replacement for LP gas for on-farm space heating with using litter to generate electricity. The comparison includes heating system efficiency, amount of LP off-set possible, value of plant nutrients in the litter, quantity and value of plant nutrients in the litter ash, impact of brokerage, and costs of producing the energy. It was concluded that using litter on-farm as a source of space heat and using the litter ash as fertilizer could provide a potential value of $48 per ton of litter. However, on-farm combustion of litter to produce electricity resulted in a loss of about – $3/ton of litter. Therefore, if a heating and ash management system can be implemented in a cost-effective manner use of litter to off-set 90% or more of the heating energy requirements would be the better of these two alternatives.
Why Is Energy Use Important in Poultry Production?
Modern poultry production requires substantial amounts of energy for space heating (propane/LP gas), ventilation, feed handling, and lighting. It was determined that annual LP gas consumption in broiler houses can range from 150 to 300 gallons of LP per 1000 square feet of floor space with an average of about 240 gal LP/1000 ft2 observed in South Carolina. Similarly, broiler production in South Carolina requires about 2326 kWh/1000 ft2 of house area. As a result, a 6-house broiler farm in SC uses about 30,240 gallons of LP and 293.076 kWh of electricity annually. The cost for energy for a 6-house farm is on the order of $57,456 per year for LP ($1.90/gal LP) and $35,169 per year for electricity ($0.12/kWh). Energy costs have more than doubled over the last decade and as a result producers are very interested in ways to reduce on-farm energy costs by using the energy contained in the litter. The objective of this study was to compare using litter as a replacement for LP gas for on-farm space heating with using litter to generate electricity.
What Did We Do?
Our analysis included heating system efficiency, amount of LP off-set possible, value of plant nutrients in the litter, quantity and value of plant nutrients in the litter ash, impact of brokerage, and costs of producing the energy.
What Have We Learned?
It was concluded that using litter on-farm as a source of space heat and using the litter ash as fertilizer could provide a potential value of $46 to $55 per ton of litter. However, on-farm combustion of litter to produce electricity resulted in a loss of about $3/ton of litter. Therefore, if a heating and ash management system can be implemented in a cost-effective manner use of litter to off-set 90% or more of the heating energy requirements would be the better of these two alternatives.
Future Plans
This information is being used in extension programs that target poultry producers.
Authors
Dr. John P. Chastain, Professor and Extension Agricultural Engineer, School of Agricultural, Forestry, and Environmental Sciences, Clemson University, jchstn@clemson.edu
Additional Information
Chastain, J.P., A. Coloma-del Valle, and K.P. Moore. 2012. Using Broiler Litter as an Energy Source: Energy Content and Ash Composition. Applied Engineering in Agriculture Vol 28(4):513-522.
Acknowledgements
Support was provided by the Confined Animal Manure Managers Program, Clemson Extension, Clemson University, Clemson, SC.
The authors are solely responsible for the content of these proceedings. The technical information does not necessarily reflect the official position of the sponsoring agencies or institutions represented by planning committee members, and inclusion and distribution herein does not constitute an endorsement of views expressed by the same. Printed materials included herein are not refereed publications. Citations should appear as follows. EXAMPLE: Authors. 2013. Title of presentation. Waste to Worth: Spreading Science and Solutions. Denver, CO. April 1-5, 2013. URL of this page. Accessed on: today’s date.
A review of the literature indicated that good quality biodiesel can be used in farm equipment at concentrations from 20% (B20) to 100% (B100) depending on air temperature and the design of the engine. Using biodiesel reduces emissions of carbon monoxide, sulfur containing pollutants that contribute to acid rain, unburned hydrocarbons, and particulates. Using B100 in a diesel engine can reduce fuel efficiency by about 8%, but had no other negative impacts when operated during warm weather. Using B20 to B50 has been shown to be sufficient to make loss of fuel efficiency inconsequential and allows operation of tractors in cold weather. The objectives of this study were to compare the use of soybeans and canola as a fuel crop for on-farm biodiesel production, and to determine the benefits of using animal manure as a source of fertilizer for on-farm fuel crop production. Related: Manure value & economics
What Did We Do?
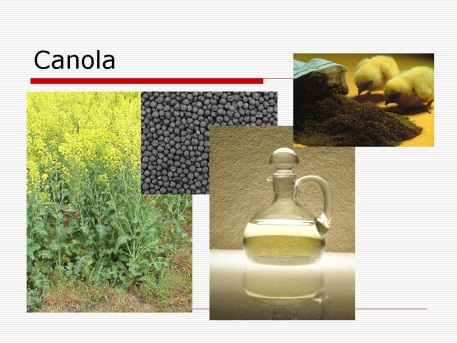
Canola can be used to produce high-quality oil for biodiesel production and high protein meal for animal feed.
Soybeans and canola are both oil seeds that can be used to make high-quality biodiesel. Soybeans are 19% oil and a single bushel will yield about 1.5 gallons of biodiesel. At a market price of $10 to $14 per bushel the soybean cost to produce a gallon of biodiesel can range from $6.67 to $9.33 per gallon. Or to state it another way, if the price of diesel is $4.20/gal making biodiesl on-farm would be like selling soybeans for only $6.30/bu. It was concluded that it would best to sell soybeans rather than use then for on-farm biodiesel production. Canola, or rape seed, contains 40% oil and will yield about 2.8 gal of biodiesel/bu. In the last few years, canola prices have increase from $5/bu to $10/bu. At a diesel price of $4.20/gal the value of the canola would be $11.76/bu which exceeds traditional prices of canola and is slightly higher than recent US prices. Therefore, canola was selected as the preferred crop for on-farm production of biodiesel in this study.
Few canaola buying stations are located in the Southeastern US and as a result canola is typically not grown in swine and poultry producing states such as South Carolina, North Carolina, and Georgia. Canola can be grown in the fall and winter months in a manner similar to wheat which adds to the appeal of using canola for on-farm biodiesel production in southern states.
A crop budget for canola production in the Southeastern US was used with current fertilizer prices to compare the cost to produce canola using purchased fertilizer versus using animal manure to provide all of the N, P2O5, and K2O needs. It was determined that the cost to produce a bushel of canola was about $6.24/bu if commercial fertilizer was used. However, using manure as the sole nutrient source lowered production costs to $3.47/bushel. The input cost to produce biodiesel from canola was determined to be $2.23 per gallon if fertilizer was purchased versus $1.24 per gallon if manure was used to produce canola
Canola meal is a valuable by-product with a protein content of about 33% (extracted by pressing without solvents) and can be used as a protein source in animal feeds. The value of the canola meal was assumed to be $234/ton and the meal production per acre was 0.75 tons. The value of canola meal was determined to be $1.25 per gallon biodiesel. The value of the meal was used as a production credit towards the cost of making biodiesel on-farm. This meal credit can only be realized if the meal is sold at market value or by using canola meal on-farm as a feed ingredient for livestock (e.g. beef or dairy cattle).
Using a moderate biodiesel production cost ($1.50/gal) the cost to make canola biodiesel on farm was $2.36/gal if fertilizer was purchased and $1.49/gal if manure was used as a fertilizer replacement. If the canola meal credit cannot be realized, on-farm biodiesel production cost was $3.61/gal if fertilizer was purchased, and $2.74/gal if manure was used.
What Have We Learned?
The results indicated that:
soybeans are too valuable to be used as a fuel crop,
canola can yield more fuel per acre than soybeans,
fertilizer costs can account for 44% of the cost of producing canola,
animal producers have a substantial advantage since manure can be used as a source of plant nutrients for canola,
obtaining fair market value for canola meal is an essential part of lowering the cost to produce biodiesel, and
making biodiesel for on-farm use or in a cooperative arrangement in a farming community appears to hold an opportunity for animal producers.
Future Plans
This information is being used in extension programs that target animal and row-crop producers.
Authors
Dr. John P. Chastain, Professor and Extension Agricultural Engineer, School of Agricultural, Forestry, and Environmental Sciences, Clemson University, jchstn@clemson.edu
Wilder Ferreira, Extension Economist, School of Agricultural, Forestry, and Environmental Sciences, Clemson University,email: wferrei@clemson.edu
Acknowledgements
Support was provided by the Confined Animal Manure Managers Program, Clemson Extension, Clemson University, Clemson, SC.
The authors are solely responsible for the content of these proceedings. The technical information does not necessarily reflect the official position of the sponsoring agencies or institutions represented by planning committee members, and inclusion and distribution herein does not constitute an endorsement of views expressed by the same. Printed materials included herein are not refereed publications. Citations should appear as follows. EXAMPLE: Authors. 2013. Title of presentation. Waste to Worth: Spreading Science and Solutions. Denver, CO. April 1-5, 2013. URL of this page. Accessed on: today’s date.
To provide the best experiences, we use technologies like cookies to store and/or access device information. Consenting to these technologies will allow us to process data such as browsing behavior or unique IDs on this site. Not consenting or withdrawing consent, may adversely affect certain features and functions.
Functional
Always active
The technical storage or access is strictly necessary for the legitimate purpose of enabling the use of a specific service explicitly requested by the subscriber or user, or for the sole purpose of carrying out the transmission of a communication over an electronic communications network.
Preferences
The technical storage or access is necessary for the legitimate purpose of storing preferences that are not requested by the subscriber or user.
Statistics
The technical storage or access that is used exclusively for statistical purposes.The technical storage or access that is used exclusively for anonymous statistical purposes. Without a subpoena, voluntary compliance on the part of your Internet Service Provider, or additional records from a third party, information stored or retrieved for this purpose alone cannot usually be used to identify you.
Marketing
The technical storage or access is required to create user profiles to send advertising, or to track the user on a website or across several websites for similar marketing purposes.