
This session brings together perspectives from the United States and Europe. Together, panelists will discuss current practices, policies, and emerging innovations across regions, offering attendees a valuable opportunity to better understand global approaches to manure management while also learning more about the upcoming RAMIRAN conference, 2027, in Italy. This presentation was originally broadcast on May 22, 2026. Continue reading “Global Manure Trends: U.S. and European Perspectives from RAMIRAN 2025”
NRCS Regenerative Pilot Program
This webinar will focus on the Natural Resources Conservation Service (NRCS) Regenerative Agriculture Pilot Program, a new conservation initiative aimed at helping farmers put their land back on a sustainable path forward. The discussion will highlight how the program is designed to support regenerative farming practices that rebuild soil health, strengthen farm resilience, and promote the production of healthier food. Webinar speakers will provide a general overview of the pilot program, including NRCS’s role in offering technical and financial assistance to producers, and discuss how the program fits within broader conservation and soil health goals. This presentation was originally broadcast on April 17, 2026. Continue reading “NRCS Regenerative Pilot Program”
A view from above – application of drones and remote sensing for air and water quality measures around livestock farms
Aerial photos of farms and farming practices are becoming easier to find and collect. But drones and satellites can provide more than pretty pictures. In this webinar, the three speakers will share applications of drones and remote sensing for air and water quality measures around livestock farms. Dirk Charlson will share his simple approach to collecting drone imagery, and the range of opportunities for analyzing images and mapping practices. Nesli Akdeniz has collected air quality measures in pasture systems with drones. Finally, Becca Muenich has used remote sensing to examine land application practices. While it may seem like these applications are flying by faster than we can see, the speakers will help ground us with their experience. This presentation was originally broadcast on December 12, 2025. Continue reading “A view from above – application of drones and remote sensing for air and water quality measures around livestock farms”
A Systems-Approach to Understanding the Nutrient Cycle Across the Pork Ecosystem
This webinar explores how an integrated, systems-based understanding of the nutrient cycle can drive more sustainable pork production. By examining both feed utilization within the animal and nutrient management beyond the barn, the discussion connects nutritional strategies and manure treatment technologies as key components of the pork ecosystem. Presenters will highlight advances in precision feeding, enzyme use, and feed processing that improve nutrient efficiency and reduce environmental impacts, as well as research optimizing zinc inclusion to balance performance and sustainability. This presentation was originally broadcast on November 14, 2025. Continue reading “A Systems-Approach to Understanding the Nutrient Cycle Across the Pork Ecosystem”
Mortality Management – From Routine to Catastrophic
This webinar will explore how mortality is part of livestock production, whether in the day-to-day on the farm or after a catastrophic disease or environmental disaster. Handling and disposal of mortality in a safe and efficient manner is critical for continuity of operations. In this webinar, the presenters will present on studies evaluating different techniques of mortality management and the lessons learned from each study This presentation was originally broadcast on October 10, 2025. Continue reading “Mortality Management – From Routine to Catastrophic”
Rethinking Manure Management with 360Rain: Expanding Application Windows and Improving Nutrient Use Efficiency
This webinar will explore how the 360Rain autonomous irrigation system is being used as a new tool for manure management. By enabling in-season manure application, 360Rain opens opportunities to better match nitrogen availability with crop uptake, reduce manure storage time (and associated methane emissions), and even provide supplemental irrigation. This presentation was originally broadcast on September 26, 2025. Continue reading “Rethinking Manure Management with 360Rain: Expanding Application Windows and Improving Nutrient Use Efficiency”
A USDA multi-location project monitoring ammonia deposition near animal production sites
Animals excrete a lot of nitrogen as they grow with a large fraction escaping into the air as ammonia. What happens to that ammonia, and can we predict how that excess nitrogen might be beneficial to nearby crop production? This webinar will present pilot-scale research for manure and food waste treatment. This presentation was originally broadcast on May 16, 2025. Continue reading “A USDA multi-location project monitoring ammonia deposition near animal production sites”
Ammonia and greenhouse gas emissions when chicken litter is added to beef pen surface material
Purpose
One of the big challenges in animal agricultural waste management is reduction of greenhouse gas (GHG) emissions. Pen surface material (PSM) from beef feedlots has been characterized for its GHG emission profile and research has now shifted to focus on emission-reducing treatments for pen surfaces. Chicken litter (CL) has a nutrient and microbial profile unique from beef manure which was hypothesized to cause a change in GHG emissions. This study was conducted to determine if the addition of CL to beef PSM would reduce methane (CH4), carbon dioxide (CO2), ammonia (NH3), and nitrous oxide (NO2) emissions.
What Did We Do?
A lab scale study was conducted in which 24 stainless steel pans (12.75 x 20.75 x 2.5 in, L x W x H) were filled with PSM (3000 g, control) that had been collected from USMARC feedlot in August. Twelve pans of PSM had chicken litter (20% wt/wt) added to the top of the pan and gently raked into the PSM. All pans had 1000 g of water added. All samples were kept in an environmentally controlled chamber at 25 C for 18 days and watered after each measurement to keep sample moisture consistent. Sample pH and loss in water were recorded throughout the experiment. Flux measurements of CH4, CO2, N2O and NH3 were measured on days 0, 1, 3, 6, 8, 10, 13, 15, and 18 using Thermo Scientific gas analyzers. Data was analyzed for statistical differences in emissions as a function of time (days), treatment (control vs chicken litter), and time*treatment. At the conclusion of emission measurements, samples were pooled and sent to a commercial lab for nutrient analysis.
What Have We Learned?
All measured gases showed significant changes over the time of the experiment (p < 0.05). Significant differences between treatments (p < 0.05) were recorded for N2O with a higher emission recorded for PSM+CL. Significant treatment* day interactions were observed for CH4, NH3, and N2O (p < 0.05). Methane and NH3 emissions peaked on day 1 and steadily decreased over the 18 days; N2O emissions steadily rose from day 0 to day 8 and then steadily decreased through day 18. Nutrient analysis determined PSM with chicken litter contained significantly higher levels of organic N, ammonium N, and total nitrogen. There was no significant difference of N2O in control vs treated samples. Chicken litter treated samples showed higher levels of P2O5, K2O, sulfur, calcium, magnesium, sodium, zinc, copper, boron, soluble salts, and organic matter. From this work, we conclude that addition of chicken litter to PSM did not favorably alter emissions of greenhouse gasses. Mixing the manures may be beneficial for land application to cropland or for composting.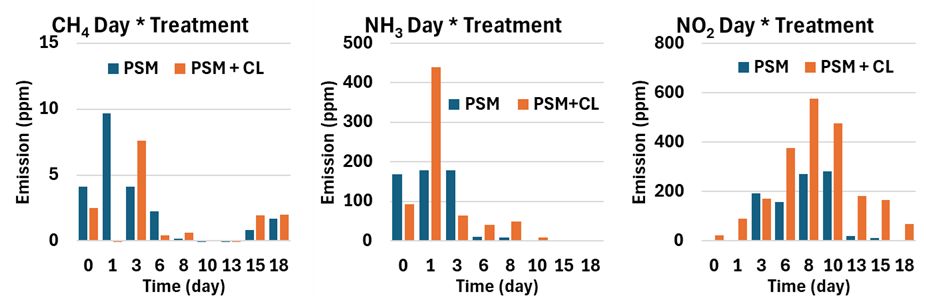
Future Plans
Future research will evaluate different sources of composted CL, the emission profile of CL, and consideration of how mixtures of PSM and CL impact nutrient retention and composting.
Authors
Presenting & corresponding author
Bobbi Stromer, Research Chemist, US Meat Animal Research Center, Bobbi.stromer@usda.gov
Additional authors
Mindy Spiehs, Research Nutritionist, US Meat Animal Research Center
Bryan Woodbury, Research Engineer, US Meat Animal Research Center
Additional Information
USDA is an equal opportunity provider and employer
Acknowledgements
The authors wish to thank Victor Gaunt for assistance with data collection
The authors are solely responsible for the content of these proceedings. The technical information does not necessarily reflect the official position of the sponsoring agencies or institutions represented by planning committee members, and inclusion and distribution herein does not constitute an endorsement of views expressed by the same. Printed materials included herein are not refereed publications. Citations should appear as follows. EXAMPLE: Authors. 2025. Title of presentation. Waste to Worth. Boise, ID. April 7–11, 2025. URL of this page. Accessed on: today’s date.
Can Manure Application Offset Tillage Impact on Soil Health Metrics in Organic Systems?
Purpose
Organic farming systems rely on internal, biologically mediated processes that can provide plants essential nutrients and suppress pests and disease. While reliance on soil biology to produce healthy plants is at the heart of the soil health concept, little research has been conducted in certified organic systems. Organic growers in Idaho and elsewhere need greater access to information on building soil health to enhance long-term productivity and sustainability on their farms. The overall goal of this project was to provide tools and targets to guide soil management during the transition to organic operation, thereby increasing soil health and internal function of certified organic systems.
Specifically, we assessed how key soil health indicators and soil organisms changed under combinations of three different tillage and nutrient management strategies during the transition to organic farming.
What Did We Do?
Replicated plots were established at two sites each in two growing regions of Idaho (North and South), to determine the impact of different levels of tillage and organic matter additions on soil health indicators and crop growth during the organic transition phase. Both sites in Northern Idaho, GDF and SSF, were located near Moscow while both sites in Southern Idaho, KF and TF, were in Twin Falls County. All sites can be broadly characterized as having silt loam soils. However, Northern Idaho is rainfed with 27 inches of rainfall per year while Southern Idaho receives an average of 8 inches of precipitation. The sites in Southern Idaho were irrigated while those in Norther Idaho were not.
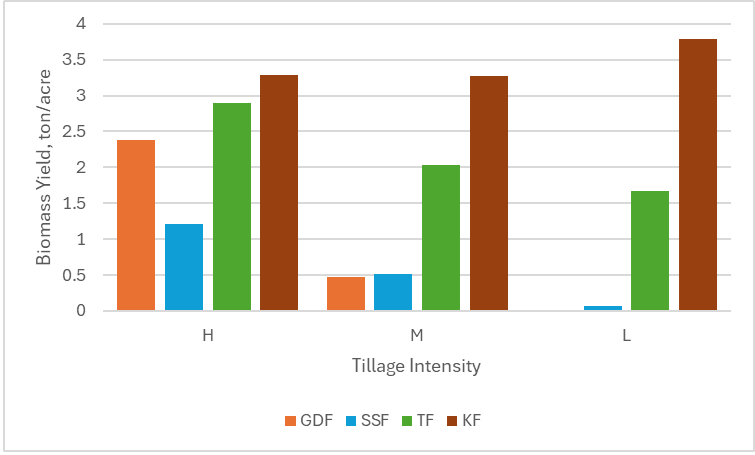
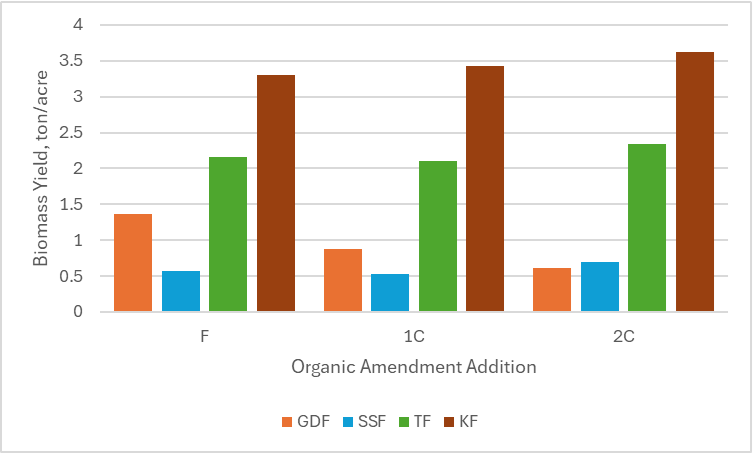
For all sites, alfalfa was established in year one and maintained for three years before it was terminated then feed barley was planted. For the two sites in Northern Idaho, alfalfa did not establish and was replanted in year 2. Each site had three levels of disturbance (tillage): high, medium, and low and three levels of organic additions: high, medium, and low for a total of nine plots per site (Figure 1). Treatment combinations were not replicated within site but instead replicated across sites (4 sites total). High tillage intensity included several passes of a rototiller and/or chisel plow with harrow. Medium intensity included one pass of a rototiller and/or chisel plow; while the low intensity only had harrow. Organic amendments were added every year; the medium rate of organic addition was designed to provide crop uptake of phosphorus for alfalfa and nitrogen for barley while the high rate was doubled. The low rate was bone meal (phosphorus) or blood meal (nitrogen) to meet crop uptake of the alfalfa and barley, respectively.
Yield was measured via hand sampling at all sites in September 2024. A wide range of soil physical, chemical, and biological soil health indicators were assessed in June 2024. Due to space limitations, only active carbon, also known as POxC, will be reported here. POxC is generally considered an indicator that is sensitive to management changes, especially those that increase soil carbon. It provides a quicker response than soil organic matter because POxC only indicates a small fraction of the soil carbon pool.

What Have We Learned?
In Northern Idaho, upon harvest, total above ground biomass of spring barley was nearly double at GDF (1.72 tons/acre) compared to SSF (0.91 tons/acre) (Figure 2). Across both Northern Idaho sites, higher barley yield was associated with higher tillage with one of the sites having no harvestable barley in the low tillage treatment due to high weed and volunteer alfalfa pressure. Barley yields in Southern Idaho were higher than in Northern Idaho; KF had average yields of 3.45 tons/acre with TF averaging 2.20 tons/acre. Yields in Southern Idaho were the highest in the high tillage plots and lowest in the medium tillage. Organic amendment addition made little difference compared to tillage intensity for yields (Figure 3).
In terms of soil health indicators, POxC averaged higher at GDF plots (833.19 mg/kg soil) when compared to SSF plots (452.95 mg/kg soil). POxC was substantially lower in Southern Idaho than in Northern Idaho; plots at KF averaged 331.46 mg/kg soil while the TF site averaged 404.35 mg/kg soil. POxC decreased with depth across all sites. In Northern Idaho, there were no consistent trends for tillage or fertilizer across both sites. Treatment effects of tillage and fertilizer application depended on location. For example, GDF plots had an inverse relationship of POxC levels and increasing tillage. At SS, higher levels of POxC were associated with higher levels of tillage. Unlike Northern Idaho, POxC increased with decreasing tillage intensity at both sites in Southern Idaho. Across both Southern Idaho sites, POxC averaged 390.17 mg/kg soil in the lowest tillage intensity, 372.68 mg/kg soil for medium tillage intensity, and 340.87 mg/kg soil in the highest tillage intensity. There was no consistent effect of organic matter addition, however.
Future Plans
We are still analyzing data from this four-year study for other soil health indicators, such as the , earthworm species, and soil infiltration rates. This robust data set (over a dozen indicators total) will help guide which indicators of soil health are most suitable for organically managed systems.
Authors
Presenting & corresponding author
Linda Schott, Assistant Professor and Extension Specialist, University of Idaho, Lschott@uidaho.edu
Additional authors
Kendall Kahl, Assistant Professor and Extension Specialist, University of Idaho
Jodi Johnson-Maynard, Department Head and Professor, University of Georgia
Glen Stevens, Research Technician, University of Idaho
Ed Lewis, Professor, University of Idaho
Additional Information
Soil Health | University of Idaho Extension
Acknowledgements
Dan Temen, Will Romano, Kevin Kruger, Cami Ditton
The authors are solely responsible for the content of these proceedings. The technical information does not necessarily reflect the official position of the sponsoring agencies or institutions represented by planning committee members, and inclusion and distribution herein does not constitute an endorsement of views expressed by the same. Printed materials included herein are not refereed publications. Citations should appear as follows. EXAMPLE: Authors. 2025. Title of presentation. Waste to Worth. Boise, ID. April 7-11, 2025. URL of this page. Accessed on: today’s date.
EcoManure: A Machine Learning Framework for Nitrogen Level Prediction and Classification of Sustainable Manure Waste Management
Purpose
Agricultural waste, including animal manures, can be a source of environmental pollution if not handled properly (Maji et al., 2020) due to nitrogen leaching into water systems and methane emissions. While electronic sensors and spectroscopic devices can give measurements for nitrogen content, the costs can be prohibitive, with regular calibration and deviations from defined composition levels in manures. To address these challenges, we developed EcoManure, as a machine learning framework to predict nitrogen content and classify the type of manure. By incorporating historical and real-time data, EcoManure affords a competitive edge for enhanced accuracy and lowered dependency on expensive sensors in aiding more sustainable decision-making on waste management.
What Did We Do?
To handle the complex tasks of predicting nitrogen levels and classifying manure, we started by putting together a complete set of data that included key agricultural factors. We used ManureDB – National Database of Manure Nutrient Content and Other Characteristics (1998–2023), a publicly available dataset from the USDA Ag Data Commons. The dataset comprehensively listed the different types of animals, geographical locations, moisture content, total solids percentage, and the treatment methods for the manure, as well as its chemistry and physical characteristics like pH, level of organic matter, concentration of nutrients (Nitrogen, Phosphorus, Potassium), and trace constituents like Calcium, Magnesium, and Zinc. After this dataset was constructed, the cleaning procedures were carried out, which included dealing with missing values, encoding categorical variables, and applying feature engineering for better accuracy of the model with its predictions. The set was divided into 80% for training and the rest 20% for testing.
| Metric | Value |
|---|---|
| Number of Training Samples | 360,000 |
| Number of Testing Samples | 90,000 |
| Classification Accuracy | 0.50 |
| Precision | 0.86 |
| Recall | 0.14 |
| F1-Score | 0.71 |
We estimate the total nitrogen content from manure characteristics using a Random Forest Regressor during the predictive modeling phase. As shown in Table 1, this regression model was fine-tuned and validated using standard metrics such as mean squared error (MSE) and R² to address the accuracy issue in nitrogen prediction. Additionally, we evaluated the model’s performance using MSE (Mean Squared Error) and MAE (Mean Absolute Error), where lower values of both MSE and MAE indicate better prediction accuracy. Simultaneously, a Random Forest Classifier was constructed to predict different types of manure, allowing the differentiation between based on their fundamental compositional attributes. The performance of the classifier was evaluated on accuracy metrics to test its reliability in practical application as shown in table 2 and the visual representation in Figure 1 verifies the dependence of actual values and predicted values. The performance matrix includes Classification Accuracy, which measures the overall percentage of correct predictions, Precision, which shows how many predicted positive results are correct, Recall, which indicates how many actual positives were identified, and the F1 Score, which balances precision and recall into a single metric. We also created a friendly machine learning framework (Chlingaryan, Sukkarieh, & Whelan, 2018; Jordan & Mitchell, 2015) interface for easy predictions and classifications. This would allow farmers, scientists and other stakeholders like policymakers to input their relevant details of the manure and provide swift responses about its nitrogen content and type, thus leading to better sustainable decisions in farming.
| Metric | Value |
|---|---|
| Number of Training Samples | 360,000 |
| Number of Testing Samples | 90,000 |
| Classification Accuracy | 92% |
| Precision | 90% |
| Recall | 91% |
| F1-Score | 90.5% |

Figure 1: Comparison of Actual and Predicted Nitrogen LevelsWhat Have We Learned?According to our experimental findings, EcoManure accounts for 86% of the variability for the nitrogen content predictions in manure samples. Also, the system has an exceptionally high classification accuracy for manure types with close to 92%. These results demonstrate that machine learning can serve as a powerful alternative to expensive sensors and spectroscopic devices. AS a result, it provides accurate and cost-effective predictions.
Future Plans
Our future plan involves upgrading it to incorporate additional factors affecting the environment and manure treatment. As additional predictive variables, we will analyze temperature, humidity, and probable microorganisms’ composition. This will improve the accuracy of our model. Furthermore, sensor technology will enable continuous monitoring and real-time data collection, greatly enhancing our understanding of the manure’s state. This approach allows for timely modifications as needed. In conclusion, we aim to advance the field of precision agriculture and contribute towards environmental sustainability with a focus on intelligent waste management built on machine learning algorithms.
Authors
Presenting & corresponding author
Kallol Naha, PhD Candidate, Computer Science, University of Idaho, naha7197@vandals.uidaho.edu
Additional author
Hasan Jamil, Associate Professor, Computer Science, University of Idaho
Additional Information
Chlingaryan, A., Sukkarieh, S., & Whelan, B. (2018). Machine learning approaches for crop yield prediction and nitrogen status estimation in precision agriculture: A review. Computers and Electronics in Agriculture, 151, 61–69.
Maji, S., Dwivedi, D. H., Singh, N., Kishor, S., & Gond, M. (2020). Agricultural waste: Its impact on environment and management approaches. Emerging Eco-Friendly Green Technologies for Wastewater Treatment, 329–351.
Jordan, M. I., & Mitchell, T. M. (2015). Machine learning: Trends, perspectives, and prospects. Science, 349(6245), 255–260.
USDA. (2023). ManureDB – National Database of Manure Nutrient Content and Other Characteristics (1998–2023). USDA Ag Data Commons. Available at: https://agdatacommons.nal.usda.gov/articles/dataset/ManureDB_-National_database_of_manure_nutrient_content_and_other_characteristics_1998-_2023/26031256?file=47165362
Acknowledgements
This research was funded by the USDA Sustainable Agricultural Systems Initiative through the Idaho Sustainable Agriculture Initiative for Dairy (ISAID) grant (Award No. 2020-69012-31871).
The authors are solely responsible for the content of these proceedings. The technical information does not necessarily reflect the official position of the sponsoring agencies or institutions represented by planning committee members, and inclusion and distribution herein does not constitute an endorsement of views expressed by the same. Printed materials included herein are not refereed publications. Citations should appear as follows. EXAMPLE: Authors. 2025. Title of presentation. Waste to Worth. Boise, ID. April 7-11, 2025. URL of this page. Accessed on: today’s date.