The “Circular Bioeconomy” seems to be everywhere these days. The American Society of Biological and Agricultural Engineers (ASABE) created a Circular Bioeconomy Systems Institute. The Water Environment Federation (WEF) sponsored a Circular Water Economy Summit. I’m on an email list called “In the Loop with EPA: Circular Economy Updates”. Even my old alma mater, the University of Arkansas, announced a position for an Assistant Professor in Engineering for the Circular Economy.
In the midst of all this, I am sensing a backlash from my colleagues. There is a rising attitude of, “isn’t this just a new name for what we’ve been doing all along?” True, but the Circular Bioeconomy is a bona fide environmental concept, one rooted in a process evolving for at least four and a half billion years on planet earth – Nature itself. We Waste to Worth folks should embrace the Circular Bioeconomy. We should proudly say, “This is what I do.”
What Did We Do?
So, what is the Circular Bioeconomy?
Here lies the problem. The terms “circular economy” and “bioeconomy” are interpreted by different groups to mean different things, leading to confusion and cynicism. Perhaps the clearest way to define the Circular Bioeconomy is to state what it is not. A circular bioeconomy is not a linear “take-make-waste” economy based on extraction of limited resources. The Circular Bioeconomy is an aspiration, a transition to a nature-based economy centered on sustainability.
What Have We Learned?
How can we explain what we do in the Circular Bioeconomy to the public we serve?
Most of the people attending this conference already work in “the bioeconomy” — either in agriculture, forestry, fisheries, or natural resource conservation. The place to start is with circularity. The universe you and I inhabit works in cycles. The second law of thermodynamics is “water flows downhill.” The law of nature is “energy flows and materials circulate.”
Translating this simple concept can get complicated quickly. There are numerous qualitative descriptors for various aspects of circularity, and an attempt to quantify circularity is in its infancy.
Future Plans
So, take a step back and focus on the central truth. What is true for the water cycle, is true for nutrient cycles, is true for agriculture, is true for the power grid, and these are all interconnected.
Plants use solar energy and transpire water vapor to the atmosphere. Energy is released through condensation. Rain falls on the earth and rivers flow to the sea. Water vapor travels on prevailing winds…
Soil microorganisms use energy contained in organic matter for growth. Microorganisms release nutrients for crops to grow. Crops are eaten by livestock and poultry. Animals of all species produce manure rich in organic matter and nutrients…
round and round …
sustainably.
Presenting and Corresponding author
Douglas W. Hamilton, Ph.D., P.E., Associate Professor and Waste Management Specialist, Oklahoma State University, dhamilt@okstate.edu
North Dakota was impacted by the 2022 Highly Pathogenic Avian Influenza (HPAI) outbreak. Responders to the HPAI outbreak included the North Dakota Department of Agriculture, North Dakota Department of Environmental Quality, USDA Animal and Plant Health Inspection Service (APHIS), North Dakota State University (NDSU) Veterinary Diagnostic Laboratory, NDSU Extension, county emergency managers and veterinarians. Many responders were new employees and were not involved in response efforts during the 2015 HPAI outbreak, including 62% of county Extension agents. The lack of experience and knowledge resulted in a significant amount of time and effort spent determining the appropriate agencies to contact, defining agency roles, developing educational resources, and creating an awareness of biosecurity and procedures used in active cases. Additionally, limited attention was given to stress management or mental health and well-being during this period of heightened stress for personnel involved in response.
What Did We Do?
NDSU Extension received a 2023 USDA APHIS National Animal Disease Preparedness and Response Program grant to train professionals on how to safely respond to an animal disease outbreak or mass livestock mortalities. Training topics included:
An overview of animal diseases
Continuity of business planning
Personal protective equipment and decontamination
Incident command systems, local response roles and impact assessment
Humane endings
Carcass disposal site selection and methods
Stress management and responding to stressed people
Effective communication in high stress situations
A response simulation exercise.
The curriculum was developed over a 5-month period and was previewed by 25 attendees during the North Dakota Veterinary Medical Association’s Annual Winter Conference. A total of 11 attendees responded to a survey of which 100% agreed the training increased their confidence in responding to a foreign animal disease (FAD), while 91% indicated the materials presented were appropriate for those responding to an animal disease outbreak at the local level. All topic areas were rated as either moderately useful or very useful. Suggested improvements to the curriculum were made over the next 4 months until the first full training.
The one and a half day training events were held in person at the NDSU Carrington Research Extension Center (CREC) in June and September 2024. The training format included classroom, group work, demonstrations and hands-on activities. Each participant received a kit which contained personal protective equipment. A table-top exercise at the end of the training tied in all topics presented and provided time for groups to share experiences with response efforts.
Participants of the Emergency Response Preparedness for Foreign Animal Diseases and Mass Livestock Mortalities in North Dakota training viewed a non-disease mortality compost site. NDSU photo.
Emergency Response Preparedness for Foreign Animal Diseases and Mass Livestock Mortalities in North Dakota training participants practice donning PPE during hands-on portion of training. NDSU photo.
Participants of the Emergency Response Preparedness for Foreign Animal Diseases and Mass Livestock Mortalities in North Dakota training received Glo-Germ on their gloves as they exited the people movers to doff PPE. They rubbed it on their hands and then up and down their PPE. The Glo-Germ was used as a tool to aid in visual “contamination”. A black light was used after doffing was complete to spot any signs of “contamination”. NDSU photo. The NDSU Extension does not endorse commercial products or companies even though reference may be made to tradenames, trademarks or service names.
What Have We Learned?
In post-event evaluations of training participants, all respondents (57) indicated that the training increased their confidence and ability in responding to an animal disease or mass livestock mortality event. Additionally, 96% of respondents indicated they planned to make changes to be better prepared and better able to respond to animal diseases or mass livestock mortalities because of their participation in the training. Responses also indicated 93% improved their ability to provide support to individuals in high stress situations.
“One of the best trainings I’ve ever attended. Please make sure new ANR [agriculture and natural resources] agents attend this in the future.
“This was a great training and appreciate all the work put into it! It was good to understand the chain of command and know that many other offices would be working with a producer in a situation involving a FAD.”
“I appreciated the number of different professions represented at this meeting and their unique perspectives for this type of emergency response.”
“It was a great learning experience. The information was very useful and will be put to use if an event occurs. We EM’s [emergency managers] don’t normally deal directly with the emotional responses but we are resources for finding avenues for emotional support, which is great to know that there are people to reach out to in the animal industry. Overall, it was great to network with others and have more tools in the toolbox for when the situation occurs. GREAT JOB to everyone involved!!”
Six-month follow-up evaluation data from the first training session indicated that 91% of respondents (12) felt their community is better prepared for and able to respond to an animal disease or mass livestock mortality. Of these respondents, 45% took action to be more prepared for an animal disease or mass livestock mortality. Additionally, the training was successful in building relationships between responders in the state with 55% collaborating with individuals they connected with at the training to better prepare their communities to respond to an animal disease or mass livestock mortality. The six-month follow-up evaluation for the second training session will be administered in March 2025 and these proceedings will be updated with the information.
As part of the six-month evaluation, respondents were asked if they had taken actions to prepare for an animal disease or mass livestock mortality. Comments to date included:
“Put together a list of resources, working on a response plan, informed stakeholders on the process and procedures involved.”
“Monitoring of animal diseases in state and working with local producers and County Extension Agent.”
“I have been more diligent about collecting names of producers or contacts needed if any outbreak would occur.”
Future Plans
Based on feedback from participants, an online discussion and a one-day table-top training are being planned. A follow-up one-hour online discussion session for all training participants will occur in February 2025. A day-long tabletop training is being planned for September 2025. This training will be for Extension agents and emergency managers. The goal of this training is to continue to increase preparedness and response capacity at the local level through the development of skills and relationships.
Authors
Presenting & corresponding author
Mary A. Keena, Extension Specialist, North Dakota State University, mary.keena@ndsu.edu
Additional authors
Miranda Meehan, Ph.D., Associate Professor, Livestock Environmental Stewardship Specialist and Disaster Education Coordinator, North Dakota State University; Carolyn Hammer, DVM, Ph.D., Professor, Associate Dean of College of Agriculture, Food Systems and Natural Resources, North Dakota State University; Heidi Pecoraro, DVM, Ph.D., DACVP, Director, Veterinary Diagnostic Laboratory, North Dakota State University; Sean Brotherson, Ph.D., Professor and Family Science Specialist, North Dakota State University; Ethan Andress, DVM, State Veterinarian, ND Department of Agriculture; Jodi Bruns, M. Ed., Leadership and Civic Engagement Specialist, North Dakota State University; Adriana Drusini, Extension Program Coordinator, Farm and Ranch Stress, North Dakota State University; Marty Haroldson, Program Manager, Division of Water Quality, ND Department of Environmental Quality; Angela Johnson, Farm and Ranch Safety Coordinator, North Dakota State University; Margo Kunz, DVM, Assistant State Veterinarian, ND Department of Agriculture; Julianne Racine, Extension Agent, Agriculture and Natural Resources, LaMoure County, North Dakota State University; Karl Rockeman, P.E., Director, Division of Water Quality, ND Department of Environmental Quality; Jan Stankiewicz, MS, MPH cert., Community Health and Nutrition Specialist & Tribal Liaison, North Dakota State University; Rachel Strommen, Environmental Scientist, ND Department of Environmental Quality; and Kent Theurer, Emergency Management Specialist, ND Department of Agriculture.
Additional Information
Twenty-one new Extension publications in either English or Spanish will be created from this project. Completed to-date include:
The USDA Animal and Plant Health Inspection Service National Animal Disease Preparedness and Response Program funded this project. Project ID: ND01.22.
Special thank you to our support staff members, Myrna Friedt, Linda Schuster, Stephanie Sculthorp-Skrei and Lynne Voglewede as well as the NDSU Agriculture Communications department for all of the time and effort you put into these trainings and materials.
The authors are solely responsible for the content of these proceedings. The technical information does not necessarily reflect the official position of the sponsoring agencies or institutions represented by planning committee members, and inclusion and distribution herein does not constitute an endorsement of views expressed by the same. Printed materials included herein are not refereed publications. Citations should appear as follows. EXAMPLE: Authors. 2025. Title of presentation. Waste to Worth. Boise, ID. April 7-11, 2025. URL of this page. Accessed on: today’s date.
This research aims to determine the effectiveness of cover crops (CCs) to improving nutrient uptake and soil health in a corn silage-cover crop system. Nutrient accumulation in soils from years of dairy manure or compost applications has increased the level of soil nutrients, creating environmental concerns. The study tests the feasibility and performance of different management strategies using CCs to mine nutrients from agricultural soils and reduce the negative environmental impact of manure or compost application.
What Did We Do?
In one study, two CC mixes (low height or tall) were inter-seeded (dual cropping) with corn silage at two different dates, near the corn planting date and later in the vegetative development. Two post-harvesting management strategies were used by either keeping the CC during the next season or terminating the CC in the spring, before the next corn silage planting. The control had no CC, only the corn silage. In an additional study, a fall CC mix was planted after corn silage harvest (double cropping). Different management strategies were used, including harvesting the CC, simulated grazing, green manuring the CC, and control with no CC. Both studies received the same amount of dairy manure compost annually, plus synthetic fertilizers. All other parameters, including corn planting and harvesting times and irrigation, were the same for both studies and all treatments. Weed management was adjusted using mowing as a method on plots with CCs, and herbicide on plots with no CCs.
What Have We Learned?
This study will continue for two more years. The first year of data collection was 2021. The inter-seeding (dual cropping) study results show very few significant differences in soil analysis comparing CC treatments. There were, however, statistically significant differences between some treatments and the control. This situation indicates that having an actively growing CC influences the soil nutrients and nutrient uptake compared to not having any CC when growing corn silage. The short CC mixes, either planted near the corn planting date or later during the corn vegetative development, tend to have the highest increase in soil OM, especially under reduced or no-till conditions, and reducing soil nitrates, ammonium, and total nitrogen. This can be explained by the better growth of the low mixes that continued growing after the corn silage harvest, compared with the high mixes that were harvested with the corn and rarely regrew after harvesting. CC establishment and growth was a challenge each year due to the corn silage shade. The low CC mix was the only one that was not terminated and continued to grow until after planting the corn silage the following spring. This treatment has proven challenging due to the aggressive CC regrowth and low growth of the corn with the CC competition, even when using strip tillage.
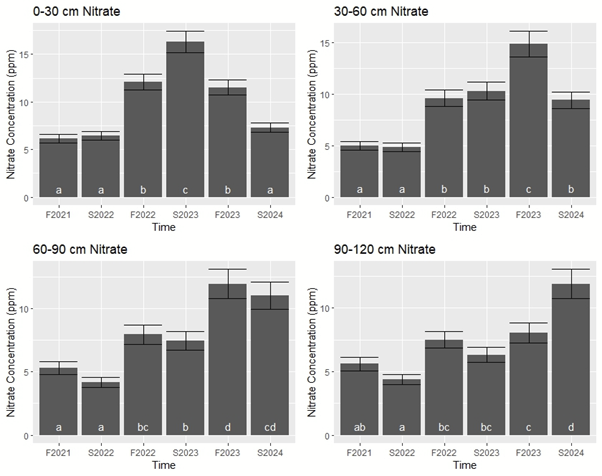
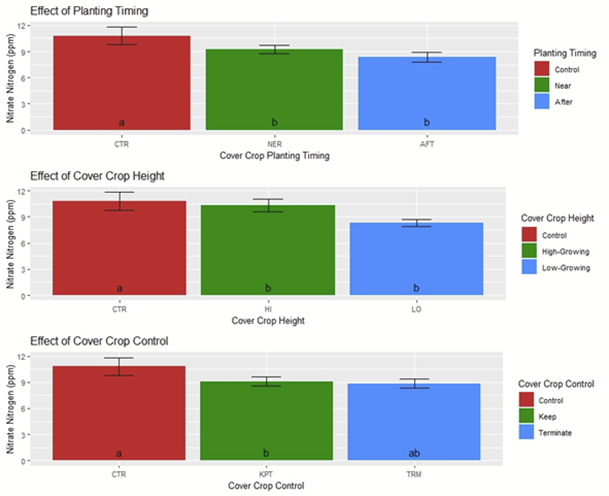
In most years, the previous season CC needed to be terminated to allow for the corn to grow and to reduce weed pressure before replanting the CC again. Soil phosphorous (P) did not show significant differences across treatments and control on the surface level. Phosphorus levels kept increasing during the study, indicating that the application rate far exceeded the crop uptake. In the case of nitrogen, even when CC showed increased nitrogen (N) uptake for all N species, nitrates have accumulated in soils, especially at lower depths, indicating leaching processes in all treatments and much more in the control (Figure 1). Cover crops can uptake some of the excess nitrogen, especially on the soil top layer, reducing the impact of N leaching (Figure 2). Under nutrient overapplication conditions, CCs that have not developed to their full potential cannot handle all the nutrients’ load, thus leaching can still occur. Overall, inter-seeding CC may have a positive impact on nutrient management when managed properly. This positive effect may be complex to quantify when comparing different CC practices with lower-than-ideal CC growth and under nutrient-overapplication conditions.
The second trial with double cropping with a single fall CC mix after harvesting the corn silage was more successful in most years in growing much more CC mass than the inter-seeding CC. The greatest differential was present only for a short period in spring before harvesting or terminating the CC for corn planting. Weed management during the corn growing season was simplified in the double (fall) cropping system. Results on the impact of fall CC and the different treatments compared to the control have not been fully analyzed.
Figure 1. Soil NO3-N estimated marginal means at 0-30 cm, 30-60 cm, 60-90 cm, and 90-100 cm depths across all sampling points in an inter-seeding corn silage-cove crop system receiving annual applications of dairy compost and synthetic fertilizer.
Figure 2. Estimated marginal means of soil nitrate at 0-30 cm depth by CC planting timing, CC height, and CC vs control in an inter-seeding corn silage-cove crop system receiving annual applications of dairy compost and synthetic fertilizer.
Future Plans
There is additional data to analyze in both studies, including other soil chemical parameters, corn silage and CC yields, and feed quality. In the last year, moisture sensors were installed in some plots, measuring and recording soil moisture and temperature at different depths up to three feet. This moisture data at various depths could be correlated with nitrate values and other soil chemical parameters data to determine nutrient leaching, irrigation efficiency, and what role CC may play. Two additional seasons of data will be included to the dataset.
Authors
Presenting & corresponding author
Mario E. de Haro-Martí, Professor and Extension Educator, University of Idaho, mdeharo@uidaho.edu
Additional authors
Linda Schott, Assistant Professor, Extension Specialist, University of Idaho
Miguel Mena, MS Graduate Student, SWS Department, University of Idaho
Steven Hines, Professor and Extension Educator, University of Idaho
Anthony S. Simerlink, Assistant Professor and Extension Educator, University of Idaho
Clarence Robison, Research Support Scientist, University of Idaho
The research team thanks the USDA-ARS Kimberly, ID personnel for their support with machinery and assistance with this project.
Funding for this project was provided by a USDA-NIFA Sustainable Agriculture Systems (SAS) grant #2020-69012-31871.
The authors are solely responsible for the content of these proceedings. The technical information does not necessarily reflect the official position of the sponsoring agencies or institutions represented by planning committee members, and inclusion and distribution herein does not constitute an endorsement of views expressed by the same. Printed materials included herein are not refereed publications. Citations should appear as follows. EXAMPLE: Authors. 2025. Title of presentation. Waste to Worth. Boise, ID. April 7-11, 2025. URL of this page. Accessed on: today’s date.
This collaborative project between The Ohio State University, Iowa State University, and 360YieldCenter intends to demonstrate the in-season application of commercial and animal nutrient sources and water application as a unified strategy to reduce nutrient losses while improving profitability with increased grain yields. A new and innovative high-clearance robotic irrigator (HCRI) is being used to apply liquid-phase nutrients in-season beyond all stages of row crops. Replicated strip trials of Fall, Spring, and in-season application will occur using the HCRI (e.g., 360 RAIN Robotic Irrigator, Figure 1). The in-season application consists of traditional N and P application rates as well as reduced rates to take advantage of better matching nutrient availability to crop needs during the growing season. Data were collected to verify nitrate-nitrogen leaching loss using liquid swine manure as a nutrient source in Iowa, while total and dissolved reactive phosphorus losses with both runoff and leaching using commercially available nutrients were collected in in Ohio. Secondly, as climate shifts result in water scarcity during critical crop growth stages, robotic irrigation water applications will be used to meet the crop needs. Higher crop yields are anticipated via precision water management.
Figure 1: 360 RAIN Unit (HCRI)
What Did We Do?
OSU is conducting two field demonstrations, one with a focus on water quality, and a second for comparison of nutrient management practices. The HCRI is being utilized to apply commercial fertilizer in-season via dilution in irrigation water with up to 12 applications per growing season (effective 4.5 in. of precipitation season dependent). Nutrient injection rates (N and P) are scaled to plant nutrient uptake and irrigator pass intervals. Both sites are farmed in accordance with existing crop rotation and standard practices.
Beck’s Hybrid Site (West 1A) – The Beck’s Hybrid site (78 ac) is subdivided in accordance with the sub-watershed boundaries and managed with two treatments: 1) conventional commercial fertilizer application in accordance with the Tri-State Fertilizer recommendations, and 2) in-season nutrient management (N and P) using the HCRI and Tri-State Fertilizer Recommendations with the exception nutrient application matching with plant nutrient uptake rates as judged by growing degree days (GDD). This site is instrumented as a paired watershed for surface water and subsurface tile drainage. Further, these watersheds are monitored for precipitation, flow, and water quality (nitrate, nitrite, total phosphorus and DRP).
Molly Caren Agricultural Center (MCAC) Site 1 (Field 7) – Field demonstrations at this site (140 ac) are laid-out in a randomized complete block design (RCBD) strip trial design with treatments that include: 1) commercial fertilizer application (N and P) in accordance with the Tri-State Fertilizer recommendations, 2) in-season nutrient management (N and P) using the HCRI and Tri-State Recommendations with the exception nutrient application matched with crop nutrient uptake rates based on growth stages as determined by GDD, and 3) in-season nutrient management (N and P) using the HCRI and 67.7% Tri-State recommend application rates matched with crop nutrient uptake rates based on growth stages (GDD). Strip trials are 160 ft. in width and approximately 1,170 ft. in length (4.3 ac treatments) with eight replicates.
MCAC Site 2 (Field 8A) – Field demonstration site used to test HCRI and “sandbox” for other RCBD trials outside of NRCS CIG grant to discovery and planning for future projects. This site varies depending on studies each year, but trials are completed via RCBD strips.
Data Collection and Analysis – Demonstration sites are grid sampled each season on a 1-ac grid (Beck’s) and within treatments (MCAC site) to monitor soil fertility levels. Soil moisture and temperature in situ sensors (CropX) are placed in both study locations (three per treatment, 15 total sensors). Tissue samples are collected by treatment type to assess nutrient uptake at three stages of crop growth. Harvested crops are scaled by treatment to ensure yield monitor accuracy. Remote sensing imagery (RGB, ADVI and thermal) is collected 10 or more times during the growing season to evaluate crop growth and development. Data is analyzed using RCBD procedures in SAS.
Water Quality Assessment – Surface and subsurface (tile) monitoring capacity was established in 2016 at the Beck’s Hybrid Site. Two isolated subareas within a single production field were identified and the surface and subsurface pathways were instrumented with control volumes and automated sampling equipment. Surface runoff sites were equipped with H-flumes while compound weirs were installed at each of the subsurface (tile) outlets. Each sampling point (two surface and two subsurface) is equipped with an automated water quality sampler and programmed to collect periodic samples during discharge events. Once collected, samples will be analyzed for N and P. An on-site weather station provides weather parameters. Water samples are collected weekly from the field plots during periods of drainage and follow the same ISU protocol for NO3–N. Dissolved reactive phosphorus (DRP) and digested (total phosphorous) samples are analyzed using ascorbic acid reduction method.
What Have We Learned?
2023 Results
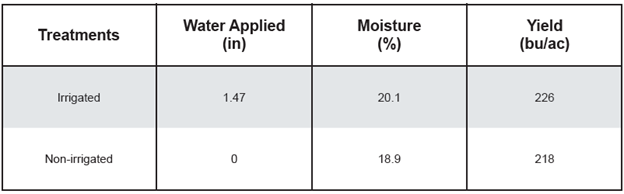
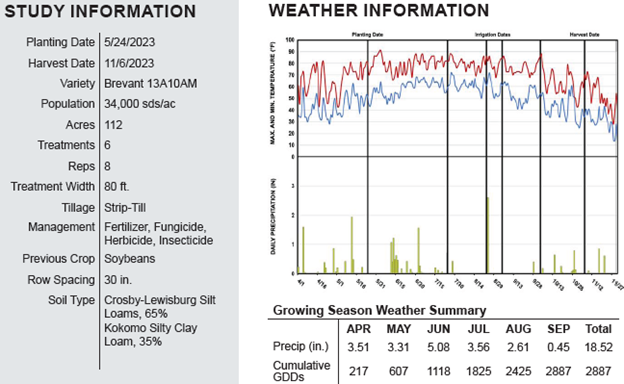
At the Beck’s Hybrid location field West 1A was planted to corn for the 2023 cropping season. There was an 8.0 bu/ac difference between irrigated and non-irrigated treatments. Nitrogen was injected using the rain unit and put on crop for the first application and use of the rain machine. Not having the rain unit in June made a significant difference in this study. The results of this location from 2023 should be taken lightly as complete implementation was not done until August. Location study information can be seen in Figure 2 and results in Figure 3.
Figure 2: Study information for Beck’s Hybrid location in 2023 cropping season.Figure 3: Results for Beck’s Hybrid field location in 2023.
In 2023, field 7 at MCAC was in soybeans and had no irrigation completed for this growing season.
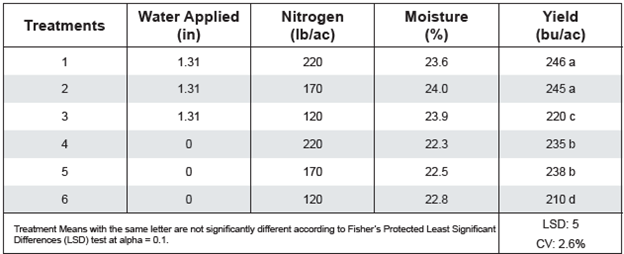
Field 8A at MCAC was in corn for the 2023 cropping season. Irrigation had a statistically significant effect on yield over all treatments. Nitrogen had statistical significance from 120 versus 170 and 220 units on nitrogen treatments. The 170 units of nitrogen was the optimal amount of nitrogen for all treatments. Not having the irrigator installed in early June caused there to be less yield in irrigated treatments. The results of this location from 2023 should be taken lightly as complete implementation was not done until August. Location study information can be seen in Figure 4 and results in Figure 5.
Figure 4: Study information for MCAC 8A location in 2023 cropping season.Figure 5: Results for MCAC 8A field location in 2023.
2024 Results
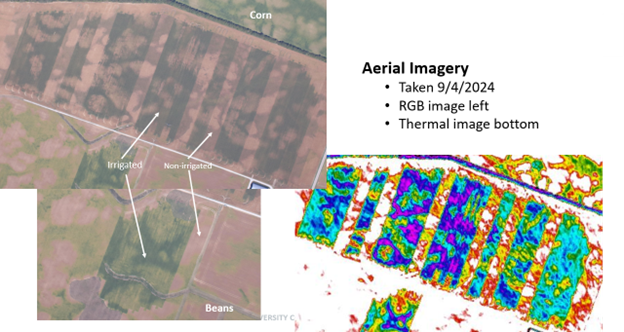
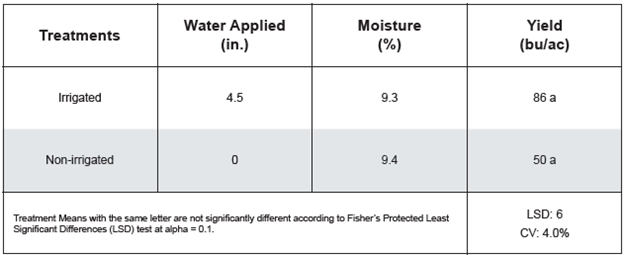
Field 7 at MCAC was in corn for the 2024 cropping season. Irrigation had a statistically significant effect on yield over all treatments. There was a 48 bu/ac between irrigated two-thirds nutrients and non-irrigated and 44 bu/ac between irrigated and non-irrigated for the 2024 growing season. A total of 773 gallons of diesel was used to run the irrigator for this trial for 2024 cropping season across 71 acres. A total of 25,739 kWh was used to run the electric pumps, base station, and well for 2024 growing season across 71 acres. These are the initial results that were published in efields and further results will continue to be analyzed to meet all project objectives. This data will be used to help in evaluating HCRI versus traditional crop production and management practices to meet project objectives. Location study information can be seen in Figure 6 and results in Figure 8. In Figure 7, aerial imagery can be seen from the 2024 cropping season.
Figure 6: Study information for MCAC 7 location in 2024 cropping season.Figure 7: Aerial imagery of field 7 (Top l) and field 8A (Bottom left) from 2024 cropping season.Figure 8: Results for MCAC 7 field location in 2024.
Field 8A at MCAC was in soybeans for the 2024 cropping season. Irrigation had a statistically significant effect on yield over non-irrigated. A total of 211 gallons of diesel was used to run the irrigator for this trial for 2024 cropping season across 11 acres. A total of 3,475 kWh was used to run the electric pumps, base station, and well for 2024 growing season across 11 acres. Location study information can be seen in Figure 9 and results in Figure 10. In Figure 7, aerial imagery can be seen from the 2024 cropping season.
Figure 9: Study information for MCAC 8A location in 2024 cropping season.Figure 10: Results for MCAC 8A field location in 2024.
Future Plans
During the next 12 months, we are planning for the HCRI operation at the two sites for cropping practices and irrigation for 2025 growing season. We will be aggregating weather data, agronomic data, plant samples, surface and ground water quality samples, and machine performance data for all years of the project with the current end date as spring of 2026. We are hoping to continue to perform testing with this technology and implementing the dry product skid for field operations for the 2025 growing and full-scale implementation across all studies in 2026. The results from the Iowa State portion of this funded project will also be reported in the future as well. There is a significant need to further develop programs for injecting macro and micronutrients in liquid and granular form for growers. The potential to significantly cut application rates exists with this technology. Also, implementing this technology with liquid livestock manure producers will change the paradigm of how manure is managed in the future.
Authors
Presenting & corresponding author
Andrew Klopfenstein, Senior Research Engineer, The Ohio State University, Klopfenstein.34@osu.edu
Additional authors
Justin Koch, Innovation Engineer, 360YieldCenter; Kapil Arora, Field Agricultural Engineer, Iowa State University; Daniel Anderson, Associate Professor, Iowa State University; Matthew Helmers, Professor, Iowa State University; Kelvin Leibold, Farm Management Specialist, Iowa State University; Alex Parsio, Research Engineer, The Ohio State University; Chris Tkach, Lecturer, The Ohio State University; Christopher Dean, Graduate Research Associate, The Ohio State University; Ramareo Venkatesh, Research Associate, The Ohio State University; Elizabeth Hawkins, Agronomics Systems Field Specialist, The Ohio State University; John Fulton, Professor, The Ohio State University; Scott Shearer, Professor and Chair, The Ohio State University
Natural Resources Conservation Service – Conservation Innovation Grant (NR223A750013G037)
Ohio Department of Agriculture – H2Ohio Grant
USDA, NRCS, 360YieldCenter, Beck’s Hybrids, Molly Caren Agricultural Center, Rooted Agri Services, Iowa State University, The Ohio State University
The authors are solely responsible for the content of these proceedings. The technical information does not necessarily reflect the official position of the sponsoring agencies or institutions represented by planning committee members, and inclusion and distribution herein does not constitute an endorsement of views expressed by the same. Printed materials included herein are not refereed publications. Citations should appear as follows. EXAMPLE: Authors. 2025. Title of presentation. Waste to Worth. Boise, ID. April 7-11, 2025. URL of this page. Accessed on: today’s date.
Most farms are on a continuous journey of environmental stewardship. This journey includes voluntary and regulatory pathways (e.g., programs, regulations) and checkpoints (e.g., certifications, production goals). Industry initiatives like the Net Zero Initiative (US Dairy) and Pork Cares (National Pork Board) provide goals that serve as destination descriptions, motivating collective action amongst their farms. However, industry initiatives do not dictate which mitigation actions can serve as the route. Every farm has a unique starting point in the present, and there are many pathways for the future that can be illuminated, shaped and supported by advisors.
This workshop was designed to provide the advisor community insights on opportunities to support the industries’ sustainability commitments through data, methods, and tools related to mitigation adoption. The desired outcome was to accelerate adoption by strengthening a community of support for sustainability initiative practices.
What Did We Do?
This workshop used multiple formats to engage participants in discussion and ideation, recognizing there is a need not only for purposeful planning, but also for quick action. There were brief introductions to a suite of tools and resources that support on-farm decision-making, and opportunities for crowd-sourcing additional material. Collective discussions charted networks and roles for advisors to support farmers in the implementation process for select scenarios. Activities considered both one-on-one advisor-advisee relationships, as well as the role of advisors within a broader network of actors involved in sustainability initiatives. The workshop culminated in identifying basic, finite steps for the promotion of action.
What Have We Learned?
The workshop content supports advisors for all types of livestock farms, but draws heavily from experiences in the swine and dairy industries. In extension work, we observed that advisors can serve as connectors, motivators, and informers. We noticed that exploring options for mitigation pathways can require a variety of advisor services.
Summary of Workshop Findings
Following the workshop, an accessible guide of resources to support participants and LPELC community members was compiled, available here:
This workshop is supported by Multistate Project S1074 – Fostering Technologies, Metrics, and Behaviors for Sustainable Advances in Animal Agriculture. This workshop benefitted from supporting materials provided by National Pork Board and the National Milk Producers Federation Farmers Assuring Responsible Management Program.
The authors are solely responsible for the content of these proceedings. The technical information does not necessarily reflect the official position of the sponsoring agencies or institutions represented by planning committee members, and inclusion and distribution herein does not constitute an endorsement of views expressed by the same. Printed materials included herein are not refereed publications. Citations should appear as follows. EXAMPLE: Authors. 2025. Title of presentation. Waste to Worth. Boise, ID. April 7-11, 2025. URL of this page. Accessed on: today’s date.
Environmental assessments are core to sustainability initiatives in several livestock sectors. For example, the Farmers Assuring Responsible Management Environmental Stewardship Program and the National Pork Board’s On-Farm Sustainability Reports support dairy and swine farms, respectively, in documenting baselines and improving environmental performance. Although many farms have a long history of environmental stewardship, farms may have limited experience in quantifying and communicating about farm environmental performance. In these cases, an environmental stewardship assessment or other evaluation can be an opportunity to learn about sustainability metrics and discuss their farm impacts. Farms, advisors, processors, and other stakeholders share responsibility in conducting and responding to environmental assessments. Uniquely, advisors and educators can build value in environmental assessment processes by assisting stakeholders in interpreting and communicating results.
What Did We Do?
To improve the translation from assessments to action, we designed a cross-institutional extension program for farmers and advisors in 2023. This W2W workshop shared key findings from this extension program by immersing participants in similar activities. The workshop included two parts. In Part I “Understanding environmental assessment models,” participants discussed fictional assessment results–reviewing inputs, then outputs, then discussing unknowns to the calculation processes. In Part II “Your role in assessment processes,” participants developed an action plan for incorporating environmental assessments into their own advising and professional work through facilitator-guided ideation activities. In summary, our workshop sought to empower participants to: 1) accurately interpret and explain the results of an environmental assessment; 2) develop strategies for incorporating environmental assessment results into their professional activities; 3) build confidence in initiating and leading discussions on environmental sustainability assessments.
What Have We Learned?
In brief, based on the perspectives of farmers and advisors in our Fall 2023 focus groups, an advisor can recognize:
Environmental assessments and reports can be relatively simple;
Assessments will not capture all the specifics for every farm;
Assessments enumerate key environmental indicators (greenhouse gases and energy consumption), and this can help processors and retailers sell more animal products;
More support, beyond an assessment, is needed to inform on-farm decision-making.
These acknowledgments are a starting point to establish a common understanding between advisors and others involved in environmental assessment processes.
Summary of Workshop Findings
This workshop generated ideas that we collected into a summary document to distribute to the broader community of Livestock and Poultry Environmental educators and advisors, available below:
We thank Midwest Dairy for supporting the original work. Additionally, we are grateful to participants in these focus groups and surveys for sharing their experiences. This workshop benefitted from supporting materials provided by National Pork Board and the National Milk Producers Federation Farmers Assuring Responsible Management Program.
The authors are solely responsible for the content of these proceedings. The technical information does not necessarily reflect the official position of the sponsoring agencies or institutions represented by planning committee members, and inclusion and distribution herein does not constitute an endorsement of views expressed by the same. Printed materials included herein are not refereed publications. Citations should appear as follows. EXAMPLE: Authors. 2025. Title of presentation. Waste to Worth. Boise, ID. April 7-11, 2025. URL of this page. Accessed on: today’s date.
California’s San Joaquin Valley (SJV) has uniquely “wicked” problems with nitrogen (N) management as it is a highly productive agricultural region where many communities rely on nitrate-contaminated groundwater for drinking. Some of this N loading is attributed to manure from dairies whose N output often exceeds the requirement of forage N, resulting in surplus manure N. The counties in the SJV have the worst groundwater quality and represent the 8 highest dairy populations. But, they also make up 7 of the 10 counties with the highest fertilizer inputs which also contributes to groundwater degradation. There is no doubt that California dairies contribute to N loading, but they also hold unique potential to utilize their surplus manure N to replace a portion of the 550,000 tons of N fertilizer applied to California’s diverse agricultural production. If appropriate measures are taken, the California dairy industry is well positioned to improve water quality in California by limiting its own excess N application while simultaneously replacing its neighbors’ synthetic inputs. The purpose of this preliminary manureshed analysis is to: 1) identify where surplus manure may become a primary N resource in California and 2) quantify its potential to reduce synthetic fertilizer inputs.
Past manureshed analyses have demonstrated manure’s potential to address crop nutrient requirements while acknowledging difficulties with pathogens, lack of spatially available data for CAFOs, and unpredictable manure nutrient variability within and across facilities. A California manureshed is uniquely challenging because of its large proportion of human-consumed crops and surplus dairy manure, which has a low value-to-mass ratio. However, there has been a concerted effort from government entities and the dairy industry to properly account for dairy manure properties to understand the potential expansion of a dairy manure market. Part of this effort has led to reporting requirements, leading to an abundance of facility-level data including location and N generated. These data can be analyzed to understand the economic and environmental potential of using dairy manure beyond its current practices.
What Did We Do?
We applied past manureshed approaches with California-specific data to understand available dairy manure and crop N need in 2021, which was the most recent crop data available to the authors at the time of publishing these proceedings.
To account for N generated on each dairy, we used the herd data from the California Dairy & Livestock Database (CADD), compiled by the California Air Resources Board. We assumed a milk cow produced 70 lbs of milk a day and, per the ASABE standard, that resulted in 0.92 lbs N per milk cow per day. A calf, dry cow, and heifer were assumed to produce 0.14, 0.5, and 0.26 lbs N per animal per day, respectively.
To calculate recoverable plant available N (PAN) (Figure 1) from manure generated on-farm, we assumed that 30% was lost to ammonia before any land application (Chang et al. 2006) and that manure was 21% organic matter (with 30% of that becoming plant available) and 79% inorganic (NH4+). Of the inorganic fraction available for land application, we assumed that 40% was lost to leaching, volatilization, or denitrification (Chang et al. 2006). We acknowledge that these assumptions about manure handling and, therefore, N forms and transformations are highly variable depending on local conditions, but we feel confident that this represents an accepted target “average” as described by Chang et al. 2006. This paper is a result of an expert panel review and informed California’s current regulatory framework for dairies. We also highlight that our “recoverable” manure only includes that year’s plant available portion and does not account for organic N from previous manure applications that may be contributing to actual available N.
Figure 1: Assumptions to calculate recoverable plant available N
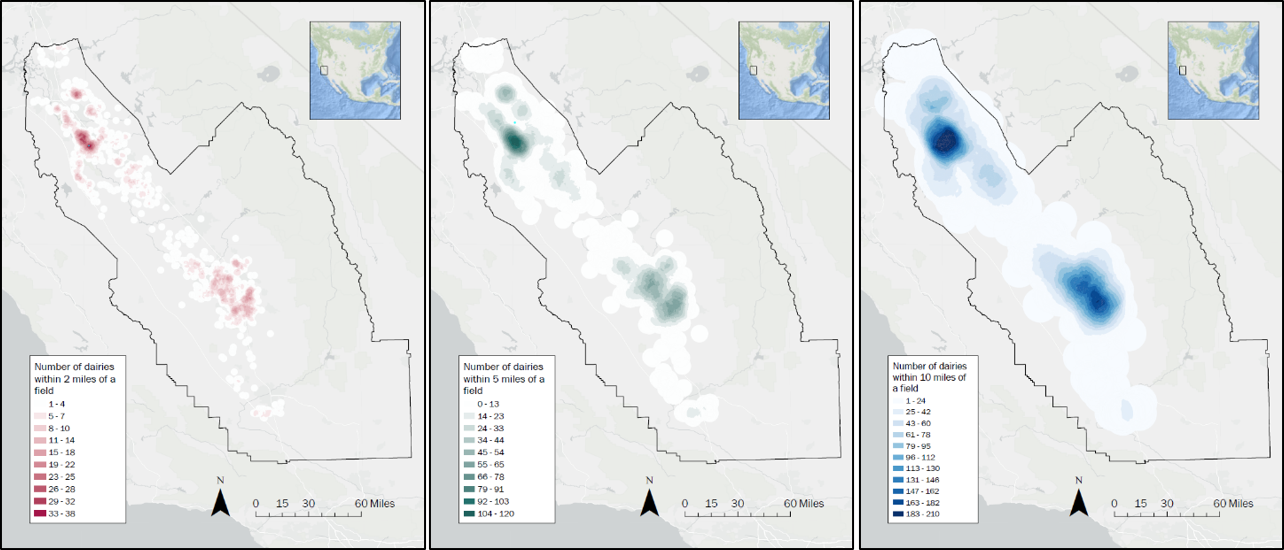
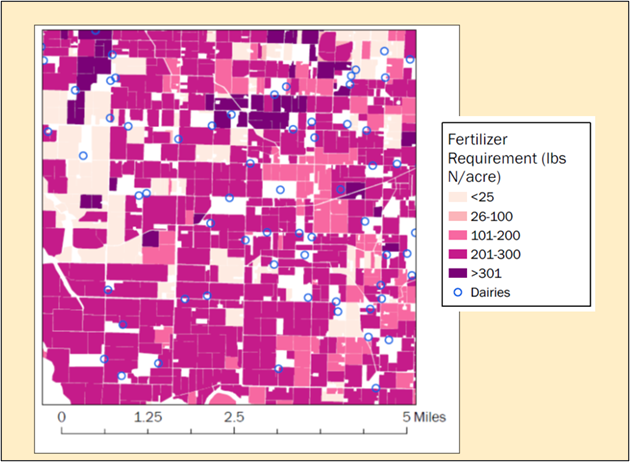
For crop N needs, we first identified farm boundaries and crops grown (up to 4 per year) based on LandIQ data and fertilizer N requirements from the California Crop Fertilization Guidelines and average county yields from USDA NASS. We assigned each LandIQ polygon a value for fertilizer N required (Figure 2). We summed N fertilizer requirements for all land polygons that were within 2, 5, and 10 miles of each dairy. A polygon was considered within a specified distance of a dairy based on the distance from any edge of the field to the latitude/longitude provided in the CADD database. Finally, all fertilizer requirements were multiplied by 1.16 to account for a 60% efficiency for manure and a 70% efficiency for fertilizer.
To determine (hypothetically) allocated manure to nearby fields, we used the Ford Fulkerson algorithm to maximize flow. This algorithm was necessary because there are areas with significant concentration of dairies (Figure 3). Therefore, if a dairy is within 2 (or 5 or 10) miles of a field, it would be competing with other dairies to supply the demand. There would be several combinations possible for each dairy (could access multiple fields) and each field (accessible by multiple dairies) (Figure 4). The algorithm maximized the amount of manure used, and prioritized forage fields (wheat/corn/grass). We assumed that a field could supply manure from multiple dairies and that a dairy could supply manure to multiple fields.
Figure 2: (Left) Recoverable Plant Available Nitrogen generated by dairy facility. (Right) N fertilizer requirement by polygon (lbs/acre) for 2021 (up to 4 crops in one year). Calculated via LandIQ (crop classification) and FREP (fertilizer recommendations, mostly pre-plant).Figure 3: Number of dairies within 2, 5, or 10 miles of a field.Figure 4: 5-by-5 mile area with dairies and field boundaries (actual data, chosen arbitrarily).
What Have We Learned?
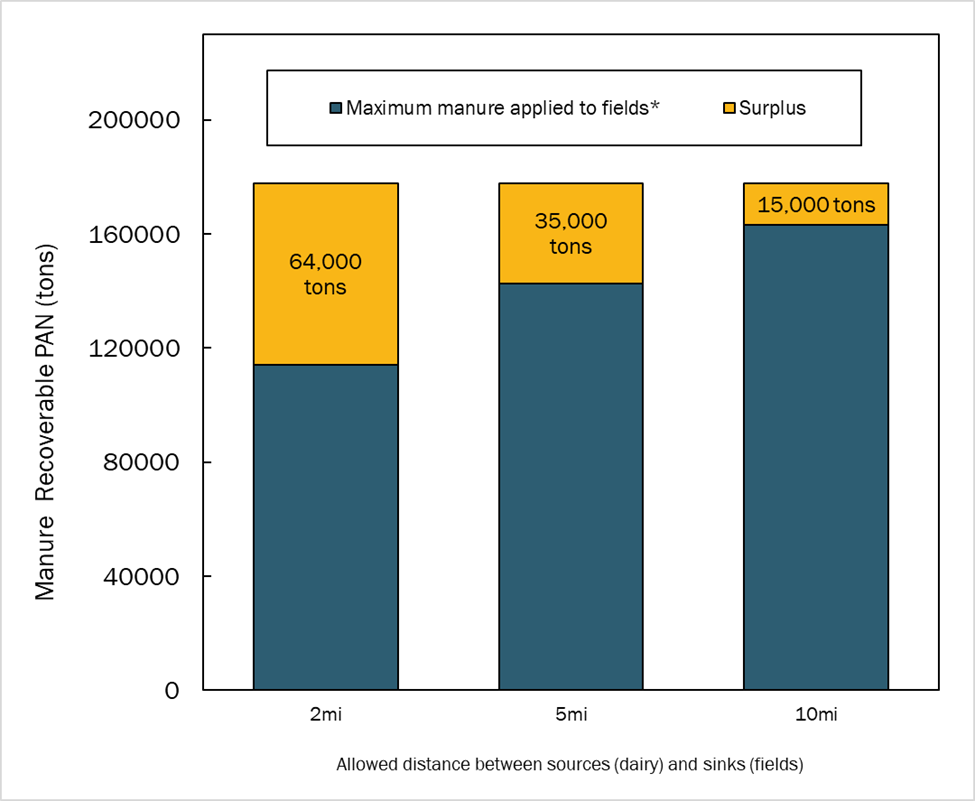
Total manure N generated was 298,000 tons, and we estimate that 178,000 tons of that was plant available N (Figure 4). It should be noted that our assumptions about N loss are aligned with ambitious environmental goals and resulted in much higher recovery rates compared to NuGIS. We also make a blanket assumption about relative organic / inorganic forms. In our hypothetical exercise where this manure could be applied to all fields (prioritizing forage first) within 2 miles of dairies, 114,000 tons were allocated, leaving 64,000 tons of surplus manure N. If the boundary were expanded to 5 miles, 143,000 tons could be allocated leaving 35,000 tons of surplus manure N. Surplus manure N was only 15,000 tons if manure could be applied up to 10 miles away from dairies where 163,000 tons were applied. Note that these simulations assume that manure can be applied to any crop (including human-consumed ones), which is not currently realistic.
Figure 5: Recoverable PAN (tons) summed over 8 counties for the 2021 crop year. *Maximum manure applied to fields is hypothetical and based on the Ford Fulkerson Algorithm where the goal was to maximize flow of manure to fields from dairies within 2, 5, or 10 miles from the field’s edge.
The amount of manure available for application varied by county. In Tulare, there was still a surplus N of 10,500 tons when assuming manure could be applied to all acreage within 10 miles of a dairy (Figure 6). However, in 3 counties (Fresno, San Joaquin, Madera), all hypothetical fertilizer N requirement could be met by applying manure within just 5 miles. Merced, Stanislaus, and Kern had fertilizer requirements met by expanding the allowed distance traveled to 10 miles. The crop types that were fulfilled by manure also differed by county (Figure 7, aggregated by county of field receiving manure).
Figure 6: Recoverable nitrogen (tons) summed by 8 counties for the 2021 crop year. *Maximum manure applied to fields is hypothetical and based on the Ford Fulkerson Algorithm where the goal was to maximize flow of manure to fields from dairies within 2, 5, or 10 miles from the edge.Figure 7: Nitrogen fertilizer requirement fulfilled by manure*, categorized by crop. *Maximum manure applied to fields is hypothetical and based on the Ford Fulkerson Algorithm where the goal was to maximize flow of manure to fields from dairies within 2, 5, or 10 miles from the edge.
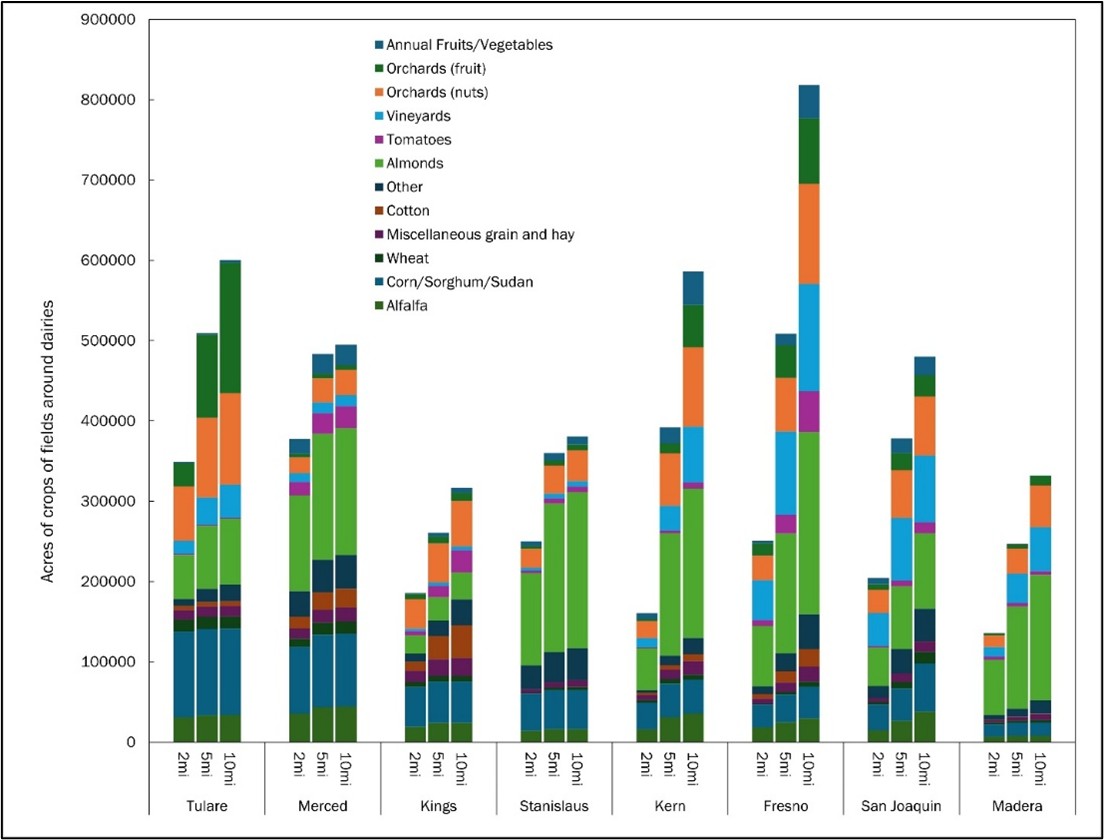
The California agricultural landscape, with many fruits and vegetables that go directly to human consumption, makes our hypothetical application rate currently unviable. For example, the only dairy forage crops with substantial acreage that are currently eligible for raw manure application are wheat, alfalfa (which does not receive N), and corn. These make up between 18-44% of area within 2 miles of a dairy, and increasing the distance from a dairy up to 10 miles decreases the percentage of crops that are forage (Figure 8). In other words, the farther away from a dairy, the more likely land use is classified as a crop that would be flagged for pathogen concerns. This highlights that to effectively use manure in the SJV, there will need to be a concerted effort to address logistical issues associated with human-consumed crops. However, these crops are generally high value, and some commodities are concentrated within a county (Figure 7).
Figure 8: Crop acreage of fields around dairies. Fields were included if their edge was within 2, 5, or 10 miles of a dairy.
Future Plans
This phase of the manureshed analysis was intended to demonstrate the potential for manure to reduce fertilizer inputs; however, its practical applications are limited. In the next phase, we hope to improve our analysis by accounting for more details of manure, such as solid vs. liquid (for improved predictions of N content/transformation/transportability) and phosphorus and potassium concentration/stoichiometry. We will work with commodity groups, with a focus on those within 10 miles of dairies, to understand the current level of interest and obstacles for integrating different manure products into their cropping systems. These improvements to our methodology will result in a quantification of environmental and economic opportunity to increase the likelihood of a circular economy by expanding the use of dairy manure.
Authors
Presenting & corresponding author
Emily R Waring, Agricultural Practice Impact Analyst, Sustainable Conservation, ewaring@suscon.org
Additional authors
Ryan Flaherty, Senior Director of Circular Economies, Sustainable Conservation
Sarah Castle, Senior Scientist, Sustainable Conservation
John Cardoza, Project Director, Sustainable Conservation
The authors are solely responsible for the content of these proceedings. The technical information does not necessarily reflect the official position of the sponsoring agencies or institutions represented by planning committee members, and inclusion and distribution herein does not constitute an endorsement of views expressed by the same. Printed materials included herein are not refereed publications. Citations should appear as follows. EXAMPLE: Authors. 2025. Title of presentation. Waste to Worth. Boise, ID. April 7-11, 2025. URL of this page. Accessed on: today’s date.
Circular agriculture is a farming strategy designed to minimize inputs and environmental impact by improving soil health, reducing waste, and reusing materials. In the context of livestock production and manure management, circularity emphasizes nutrient recycling, minimizing environmental losses, and balancing nutrient inflows and outflows to sustain agricultural systems. These priorities have long been a focus of Extension efforts across livestock-intensive regions.
This work examines the role of Extension in defining, branding, and messaging circularity within manure management. Our objective is to highlight past progress, explore future opportunities, and establish consistent messaging across farmers, industry, and the public. Through multiple analyses, we demonstrate how minor alterations in messaging can tailor information to address different audience concerns.
What Did We Do?
To evaluate the evolution of manure management and its role in circular agriculture, we conducted several analyses:
Historical Nutrient Flow & Circularity Metrics
Using historical data, we traced changes in nutrient use efficiency due to advancements in cropping systems, manure handling, and livestock genetics.
Findings illustrate continuous improvement in livestock production systems and highlight key drivers of efficiency.
Improvements were attributed to livestock performance, crop performance, and manure management, helping identify areas requiring greater emphasis for future progress.
Nutrient Separation vs. Direct Manure Application
We compared traditional manure application with nutrient separation techniques to assess their impact on nutrient circularity and economic viability. Nutrient separation could include solid liquid separation systems, but ideally will be based on systems that target partitioning of N and P, to better focus on how nutrient flows are impacted.
Comparing Manure & Municipal Waste Management
By comparing manure management practices with municipal waste handling systems, we examined how these comparisons shape public perception.
Extension’s role includes bridging the gap between agricultural decision-making and a public that is increasingly disconnected from farming, requiring clear, relatable messaging.
What Have We Learned?
The analysis highlights several key takeaways:
Livestock & Crop Improvements Have Driven Nutrient Use Gains – While significant progress has been made, additional focus on manure management is needed to accelerate circularity.
Decision Tools Can Be Re-Branded – Farmers and industry stakeholders can benefit from repurposed decision-support tools that incorporate circularity metrics to inform practical manure management choices.
Public Understanding Requires Clear Communication – Agricultural waste and manure management must be explained in ways that connect with non-farm audiences, emphasizing environmental and health benefits.
Multimodal Messaging Enhances Engagement – Using a combination of visual graphics, infographics, and multimedia content, Extension can effectively communicate circularity’s value to diverse audiences.
Future Plans
To strengthen Extension’s role in promoting circularity in manure management, future efforts will focus on:
Developing targeted messaging for farmers, industry professionals, and the general public to improve adoption of circular manure management practices.
Creating practical decision-support tools that incorporate circularity metrics to assist in manure management planning.
Enhancing outreach efforts through multimedia resources, including infographics, videos, and interactive educational tools.
Strengthening connections between manure management and broader sustainability discussions by aligning messaging with climate resilience, water quality, and regenerative agriculture initiatives.
Authors
Presenting & Corresponding author
Daniel Andersen, Associate Professor, Iowa State University, Dsa@iastate.edu
The authors are solely responsible for the content of these proceedings. The technical information does not necessarily reflect the official position of the sponsoring agencies or institutions represented by planning committee members, and inclusion and distribution herein does not constitute an endorsement of views expressed by the same. Printed materials included herein are not refereed publications. Citations should appear as follows. EXAMPLE: Authors. 2025. Title of presentation. Waste to Worth. Boise, ID. April 7–11, 2025. URL of this page. Accessed on: today’s date.
Livestock producers and meat processors are facing ever evolving challenges when it comes to waste management. Increasing levels of regulation continue to challenge producers, including Washington State’s recently established Organics Management law which sets Methane reduction goals for landfills. This has led many landfills in the state to begin turning away organic material like offal and animal carcasses. Meanwhile climate change is increasing the frequency and intensity of catastrophic animal mortality events, driving the urgent need for solutions to build resources and infrastructure to manage large animal losses.
The Awful Offal group serves as the primary inter-agency effort for addressing policy barriers and problem-solving acute and ongoing animal waste disposal scenarios. The group and its members also participate in state-wide catastrophic mortality preparedness planning. This presentation aims to engage participants with real-world examples of successes and challenges this group has faced through its inception.
What Did We Do?
The Awful Offal work group meets regularly to update members on specific cases or trends in their respective programs. Over years of collaboration, we have been able to identify gaps, provide training and create resources to address some of the largest challenges the state faces with animal carcass management. This has taken shape in the form of offal focused composting workshops, market studies, and countless hours providing resources and technical assistance to operators in need.
What Have We Learned?
We have learned much since this group’s inception, one thing that routinely comes up is that Washington’s diverse climate is going to require an equally diverse set of solutions for tackling this challenge. Composting is a viable and environmentally responsible option for many but also comes with its own unique needs and challenges. Many small meat processors have described the switch from sending material to landfill to composting onsite as “running a second business.” If you also consider many commercial composting operations do not accept this material, we must recognize that no single solution will solve this issue state-wide.
Future Plans
Through robust technical assistance and economic incentives, Washington State Department of Agriculture (WSDA) plans to lead a State-wide effort to promote adoption of on and off-farm composting as a waste management strategy. WSDA also intends to conduct an in-depth economic and market analysis to identify the specific regional needs and barriers so to further determine how the State can best support additional infrastructure, fund pilot projects and develop resources.
Authors
Presenting author
AJ Mulder, Nutrient Management Specialist, Washington State Department of Agriculture, aj.mulder@agr.wa.gov
Acknowledgements
I would like to acknowledge all the members of the Awful Offal work group, including my colleagues at Washington State Department of Agriculture, Department of Ecology, Washington State University, Department of Health, Department of Fish and Wildlife, USDA and all our industry partners whose input and cooperation this work would be impossible without.
The authors are solely responsible for the content of these proceedings. The technical information does not necessarily reflect the official position of the sponsoring agencies or institutions represented by planning committee members, and inclusion and distribution herein does not constitute an endorsement of views expressed by the same. Printed materials included herein are not refereed publications. Citations should appear as follows. EXAMPLE: Authors. 2025. Title of presentation. Waste to Worth. Boise, ID. April 7–11, 2025. URL of this page. Accessed on: today’s date.
As large dairies move into western Minnesota, a consistent supply of manure is available that was not historically present. These dairies are using a new technology to separate solids from liquids in the manure, and the impact on nutrient availability in this region’s climate and soil types is unknown. Understanding this is particularly important for sugarbeet growers in the region as late season N availability in the soil affects sugar content of the crop (high late season soil nitrate levels typical result in reduced sugar production). Where in the crop rotation should this manure be applied to maximize the beneficial properties while minimizing risk?
What Did We Do?
A three-year crop rotation including sugarbeet, corn, and soybean was set up at two locations (west central and northwestern Minnesota) with each crop present each year (Figure 1) and then rotated accordingly in subsequent years. Two rates of liquid separated dairy manure from a nearby commercial dairy were applied in the first year (in the fall prior to planting of each crop) and compared with standard synthetic fertilizer-only practices (fertilizers were applied each spring prior to planting). The two manure application rates were approximately 15,000 gallons per acre, which supplied approximately 195 pounds first-year available nitrogen per acre, or approximately 10,000 gallons per acre, which supplied approximately 150 pounds of first year available nitrogen per acre. In following years, only commercial fertilizer was applied according to soil test phosphorus and potassium levels or state nitrogen guidelines, considering manure nitrogen credits if applicable, for each crop. At the end of each growing season, yield was determined for each crop. Sugarbeet was also evaluated for sugar content and quality.
Figure 1. Aerial photograph taken in July 2021 of the plot setup with each crop labeled. Each crop was replicated four times in a randomized complete block design.
What Have We Learned?
The manured treatments typically resulted in similar or higher yields than synthetic- fertilizer-only for corn and sugarbeet during all three years of the rotation. For soybean, yields were significantly decreased by manure application at one site in the first year and generally unaffected at the second site. In the second and third years, there were no differences in soybean yield across nutrient treatments.
Future Plans
This study was conducted in two fields that did not have a recent history of manure application. Since we know that manure is the “gift that keeps on giving”, we want to repeat this study to see if there are long-term effects of nitrogen release from repeated applications of manure. Thus, manure was applied after the third growing season of the rotation and the rotation will begin again at both sites.
Authors
Presenting & corresponding author
Melissa L. Wilson, Associate Professor and Extension Specialist, University of Minnesota, mlw@umn.edu
Additional Information
Search for manure research: https://www.sbreb.org/research/
Acknowledgements
Thanks to the Sugarbeet Research and Education Board of Minnesota and North Dakota for funding this work.
The authors are solely responsible for the content of these proceedings. The technical information does not necessarily reflect the official position of the sponsoring agencies or institutions represented by planning committee members, and inclusion and distribution herein does not constitute an endorsement of views expressed by the same. Printed materials included herein are not refereed publications. Citations should appear as follows. EXAMPLE: Authors. 2025. Title of presentation. Waste to Worth. Boise, ID. April 7–11, 2025. URL of this page. Accessed on: today’s date.
Manage Cookie Consent
To provide the best experiences, we use technologies like cookies to store and/or access device information. Consenting to these technologies will allow us to process data such as browsing behavior or unique IDs on this site. Not consenting or withdrawing consent, may adversely affect certain features and functions.
Functional
Always active
The technical storage or access is strictly necessary for the legitimate purpose of enabling the use of a specific service explicitly requested by the subscriber or user, or for the sole purpose of carrying out the transmission of a communication over an electronic communications network.
Preferences
The technical storage or access is necessary for the legitimate purpose of storing preferences that are not requested by the subscriber or user.
Statistics
The technical storage or access that is used exclusively for statistical purposes.The technical storage or access that is used exclusively for anonymous statistical purposes. Without a subpoena, voluntary compliance on the part of your Internet Service Provider, or additional records from a third party, information stored or retrieved for this purpose alone cannot usually be used to identify you.
Marketing
The technical storage or access is required to create user profiles to send advertising, or to track the user on a website or across several websites for similar marketing purposes.