
This webinar explores how an integrated, systems-based understanding of the nutrient cycle can drive more sustainable pork production. By examining both feed utilization within the animal and nutrient management beyond the barn, the discussion connects nutritional strategies and manure treatment technologies as key components of the pork ecosystem. Presenters will highlight advances in precision feeding, enzyme use, and feed processing that improve nutrient efficiency and reduce environmental impacts, as well as research optimizing zinc inclusion to balance performance and sustainability. This presentation was originally broadcast on November 14, 2025. Continue reading “A Systems-Approach to Understanding the Nutrient Cycle Across the Pork Ecosystem”
Distillers grains impact on feedlot pen surface material
Purpose
Distillers grains (DGs) have been heavily researched as a diet additive for cattle since the early 2000s. Research has considered the nutritional value, optimization, and even how it impacts odors and greenhouse gases emitted from the surface of the pens that house cattle fed these diets. However, no work has been conducted to determine if there are changes in pen surface material properties after exposure to manure from diets containing DGs. Recent conversations with producers highlighted changes in pen surface characteristics such as significant loss in material and inability to maintain mounds in the pen. after DGs were fed for prolonged periods. Research has shown that manure from distillers diets contain excess proteins which we hypothesized could cause interruptions in soil particle interactions thus leading to a loss in integrity of the pen surface. The purpose of this work was to investigate if excess excreted protein in urine was the cause of changes in the properties of pen surface material.
What Did We Do?
This work was comprised of a large-scale study at a feedlot and a lab-scale study. In the feedlot study, cattle were fed either control (no DGs), wet DGs (40%) or dry DGs (40%) for 180 days. Once cattle were finished and removed from their pens, pen surface material (PSM) was collected from 4 general locations within each pen: behind the apron, on top of the mound, the side of the mound and the bottom of the pen. Samples from each pen with the same treatment were pooled into one single composite to represent each of the treatments. Samples were divided into two sets and analyzed by a commercial laboratory as either soil or manure. Soil analysis included pH, soluble salts, organic matter, nitrate nitrogen, potassium, sulfate, zinc, copper, calcium, sum of cations, % saturation of calcium and magnesium, and Mehlich-III phosphorus. Manure analysis included organic nitrogen, ammonium nitrogen, nitrate, phosphorus, potassium, sulfur, calcium, magnesium, sodium, zinc, iron, manganese, copper, boron, soluble salts pH, and moisture
For the lab-scale study, PSM was collected from a feedlot that does not feed DGs. Material was dried, ground, and sieved. Synthetic urine was added daily to bottles containing 300 g of PSM for 3 weeks to simulate prolonged addition of urine to feedlot pen surface. Samples were then shaken for 30 minutes and left at room temperature unsealed overnight. Synthetic urine contained either 0, 8, 16, or 32% additional protein. At the end of the study, samples were dried and sent to a commercial lab to be tested as soil in which the same properties listed above were again reported.
What Have We Learned?
In the feedlot study, differences (p < 0.05) in soluble salts were observed between all three treatments. Differences (p<0.05) were observed between the control and DGs diets for soluble salts, organic matter, potassium, sulfate, magnesium saturation, Mehlich P, pH, ammonium nitrogen, organic N, total N, phosphate, total phosphorus, and sulfur.
For the lab-scale study, properties in which differences (p<0.05) were measured between the control and treatments include: nitrate N, cation exchange capacity, magnesium, sodium, zinc, calcium saturation and magnesium saturation. Analysis which resulted in differences (p < 0.05) between control and all three added protein treatments include Mehlich P, potassium, calcium, and copper. No significant differences were determined between the control and the treatments for zeta potential and conductivity. Results of the feedlot study compared to the lab scale study suggest that changes in PSM are not solely caused by excess soluble protein excretion.
Future Plans
The lab scale study will be used to determine if fiber has any contribution to the observed changes in PSM properties. The results of this study will help us determine how best to manage feedlot pens when varying forms and concentrations of DGs are fed to the cattle. It may also provide insight into potential pen surface amendments that may be used to mitigate the negative effects of feeding DGs to cattle.
Authors
Corresponding author
Bobbi Stromer, Research Chemist, US Meat Animal Research Center, Bobbi.stromer@usda.gov
Additional authors
Mindy Spiehs, Research Nutritionist, US Meat Animal Research Center
Bryan Woodbury, Research Engineer, US Meat Animal Research Center
Additional Information
USDA is an equal opportunity provider and employer
Acknowledgements
The authors wish to thank Victor Gaunt for assistance with data collection.
The authors are solely responsible for the content of these proceedings. The technical information does not necessarily reflect the official position of the sponsoring agencies or institutions represented by planning committee members, and inclusion and distribution herein does not constitute an endorsement of views expressed by the same. Printed materials included herein are not refereed publications. Citations should appear as follows. EXAMPLE: Authors. 2025. Title of presentation. Waste to Worth. Boise, ID. April 7–11, 2025. URL of this page. Accessed on: today’s date.
The Circular Bioeconomy
Purpose
The “Circular Bioeconomy” seems to be everywhere these days. The American Society of Biological and Agricultural Engineers (ASABE) created a Circular Bioeconomy Systems Institute. The Water Environment Federation (WEF) sponsored a Circular Water Economy Summit. I’m on an email list called “In the Loop with EPA: Circular Economy Updates”. Even my old alma mater, the University of Arkansas, announced a position for an Assistant Professor in Engineering for the Circular Economy.
In the midst of all this, I am sensing a backlash from my colleagues. There is a rising attitude of, “isn’t this just a new name for what we’ve been doing all along?” True, but the Circular Bioeconomy is a bona fide environmental concept, one rooted in a process evolving for at least four and a half billion years on planet earth – Nature itself. We Waste to Worth folks should embrace the Circular Bioeconomy. We should proudly say, “This is what I do.”
What Did We Do?
So, what is the Circular Bioeconomy?
Here lies the problem. The terms “circular economy” and “bioeconomy” are interpreted by different groups to mean different things, leading to confusion and cynicism. Perhaps the clearest way to define the Circular Bioeconomy is to state what it is not. A circular bioeconomy is not a linear “take-make-waste” economy based on extraction of limited resources. The Circular Bioeconomy is an aspiration, a transition to a nature-based economy centered on sustainability.
What Have We Learned?
How can we explain what we do in the Circular Bioeconomy to the public we serve?
Most of the people attending this conference already work in “the bioeconomy” — either in agriculture, forestry, fisheries, or natural resource conservation. The place to start is with circularity. The universe you and I inhabit works in cycles. The second law of thermodynamics is “water flows downhill.” The law of nature is “energy flows and materials circulate.”
Translating this simple concept can get complicated quickly. There are numerous qualitative descriptors for various aspects of circularity, and an attempt to quantify circularity is in its infancy.
Future Plans
So, take a step back and focus on the central truth. What is true for the water cycle, is true for nutrient cycles, is true for agriculture, is true for the power grid, and these are all interconnected.
Plants use solar energy and transpire water vapor to the atmosphere. Energy is released through condensation. Rain falls on the earth and rivers flow to the sea. Water vapor travels on prevailing winds…
Soil microorganisms use energy contained in organic matter for growth. Microorganisms release nutrients for crops to grow. Crops are eaten by livestock and poultry. Animals of all species produce manure rich in organic matter and nutrients…
round and round …
sustainably.
Presenting and Corresponding author
Douglas W. Hamilton, Ph.D., P.E., Associate Professor and Waste Management Specialist, Oklahoma State University, dhamilt@okstate.edu
Additional Information
Leveraging Carbon Intensity Scoring for Sustainable Livestock Feed Supply Chains
Purpose
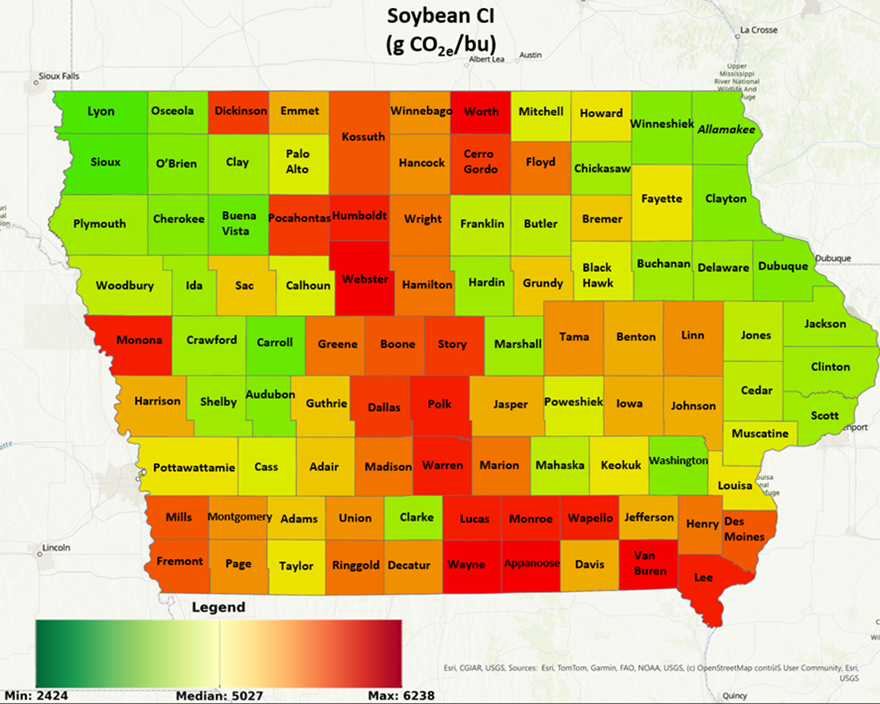
As market demands, consumer expectations, and environmental regulations evolve, agricultural producers increasingly focus on improving profitability while minimizing environmental impact. Carbon Intensity (CI) scoring is a tool that quantifies the greenhouse gas emissions associated with crop production, thereby helping producers understand their ecological footprint. CI scores may influence crop sales for biofuel production for corn and soybean producers and may eventually affect livestock feed markets as companies seek carbon-neutral supply chains. Furthermore, renewable fuel producers may become eligible for Low Carbon Fuel Standard (LCFS) credits, where revenue is contingent on the lifecycle CI score of the fuel, and similar economic approaches may be required to drive livestock feeds toward carbon neutrality. Biofuels and animal feed share a strong relationship; ethanol plants generate distiller grains, a key component of livestock diets, and soybean processing plants generate soybean meal and soybean oil. Distiller grains represent a large portion of livestock feed, and soybean oil is a common biodiesel feedstock. We evaluate the emissions associated with corn and soybean production for each county in Iowa, assessing how their yield, crop rotation, tillage practices, cover crop implementation, and manure application affect their CI scores.
What Did We Do?
This study used the Department of Energy’s Feedstock Carbon Intensity Calculator (FD-CIC) and published literature to estimate corn and soybean production emissions throughout Iowa counties. Manure nutrient volumes were found using animal feeding operation data from Iowa DNR and manure production characteristics from ASAE D384.2. Data for yield, acres of corn, acres of soybean, acres of cover crop, acres of no-tillage, acres of reduced tillage, and acres of intensive tillage by county in Iowa were found using the USDA Quick Stats Database. Diesel emissions and grain drying emissions were calculated using Iowa State University Extension resources. The nitrogen fertilizer application rate was calculated using the yield goal method (manure) and Iowa State University Extension resources (commercial fertilizers). Limestone emissions were directly correlated to the amount of CaCO3 necessary to neutralize the H+ added to the soil from manure nitrogen and anhydrous ammonia. Embedded fertilizer emissions, biomass degradation emissions, leguminous N fixation emissions, and specific fuel emission factors were pulled from FD-CIC. Corn and soybean CI scores were calculated in g CO2e/bu units. Through this work, we provide actionable insights for corn and soybean supply chain stakeholders interested in improving sustainability and expanding revenue opportunities.
What Have We Learned?
Key emission sources from corn and soybean production are nitrous oxide (N2O) from fertilizer and manure application, biomass residue degradation, embedded emissions from fertilizer production, and tractor diesel emissions. Reducing CI in corn production can be achieved through increased yield, reduced tillage, increased cover crop, and manure application. Reduced tillage and increased cover cropping increase soil organic carbon (SOC). Depending on the location and its existing soil characteristics, reduced tillage, and cover crops can sequester soil carbon, decreasing the overall CI score of the corn and soybeans. On average, SOC reduced CI scores by 6% and 18% for corn and soybeans, respectively.
Yield significantly impacted CI scores; counties with greater yield featured reduced CI scores. The CI score dropped by 33 g CO2e/bu for corn as yield increased by bu/acre with an R2 of 0.53. For soybeans, the CI score dropped by 72 g CO2e/bu as yield increased by bu/acre with an R2 value of 0.19.
Manure also significantly impacted CI scores. Although manure has increased diesel emissions compared to anhydrous ammonia application, manure lacks the embedded emissions of anhydrous ammonia, P2O5, and K2O fertilizers. As the percentage of manure-derived nitrogen increased by 1%, the CI score for corn reduced by 14 g CO2e/bu, featuring an R2 of 0.25. As the percentage of manure-derived P2O5 increased by 1%, the CI score for soybeans reduced by 25 g CO2e/bu, featuring an R2 of 0.68.
Crop rotation had a less intuitive effect on the CI score. Corn-soybean (CS) rotations typically have higher yields, reduced nitrogen fertilizer inputs, and reduced tillage. Nonetheless, continuous corn (CC) rotations facilitate greater build-up of SOC (assuming county tillage practices are evenly distributed among corn and soybean acres). Also, CC rotations occurred more frequently in high-yielding counties. For these reasons, the CS rotation was not associated with a reduced CI score.
Figure 1 and Figure 2 show carbon intensity scores of corn and soybean, respectively, for all counties throughout Iowa. Green counties typically feature greater yields, greater manure volume, and more significant SOC accumulation, whereas red counties typically feature opposite trends. It is worth noting that while CI scores are calculated per bushel, corn production averages roughly 194 bushels per acre, whereas soybean averages approximately 57 bushels per acre.

Future Plans
Future analysis includes evaluating the CI scores of biofuels and animal feed produced in Iowa counties where the corn and soybean CI scores have already been assessed. Additionally, we intend on investigating the economics of implementing emission reduction strategies, considering potential yield loss and expenses of associated field activities. Also, by applying the methods of this paper to decades of historical data, we plan on analyzing how corn and soybean CI scores have evolved throughout time. Lastly, we will project future emission reduction strategy adoption and predict how CI scores of feed and fuel will change throughout the next decade.
Authors
Presenting author
Luke Soko, Graduate Student, Iowa State University
Corresponding author
Dan Andersen, Associate Professor, Iowa State University, dsa@iastate.edu
The authors are solely responsible for the content of these proceedings. The technical information does not necessarily reflect the official position of the sponsoring agencies or institutions represented by planning committee members, and inclusion and distribution herein does not constitute an endorsement of views expressed by the same. Printed materials included herein are not refereed publications. Citations should appear as follows. EXAMPLE: Authors. 2025. Title of presentation. Waste to Worth. Boise, ID. April 7-11, 2025. URL of this page. Accessed on: today’s date.
Call for Abstracts for Waste-to-Worth 2025
You are invited to participate!
The Waste to Worth Conference will be April 7-11, 2025 at the Grove Hotel in Boise, Idaho.
Waste to Worth 2025 welcomes oral, poster, panel, and workshop presentation proposals focused on applied solutions related to animal manure management and protecting the environment.
-
- Submissions should align with one or more of the general areas of emphasis (see below).
- Graduate students are encouraged to submit and participate in a poster presentation competition.
To submit an abstract, go to https://tinyurl.com/W2W2025
For more information, go to: https://wastetoworth.org or the W2W Call for Abstracts flyer.
Deadline is October 30, 2024
Areas of Emphasis
-
- Circular Bioeconomy
- Biosecurity
- Feed & Nutrient Management
- Manure, Soil Health & Sustainability
- Emerging Contaminants
- Manure Storage, Treatment, Handling & Application Systems
- Robotics & Artificial Intelligence in Animal Production Systems
- Value-Added Products from Agricultural Production Systems
- Climate Impacts & Adaptation/Mitigation Measures
- Air Quality, Emissions & Fate
- Educational Programming & Delivery
- Environmental Planning & Regulations in Animal Agriculture
- Case Studies/On-Farm Experience
- Mortality Management
- Sustainable Animal Systems
- New & Innovative Technology
- Water Quality
Who attends?
-
- Extension agents & specialists
- Progressive farmers & producers
- NRCS staff
- Consultants & technical experts
- Regulatory & policy advisors
- Scientists
- Technology providers
Predicting Manure Nitrogen and Phosphorus Characteristics of Beef Open Lot Systems
This project involves the analysis of a new data set for manure characteristics from open lot beef systems demonstrating both average characteristics and factors contribution to variability in manure characteristics among these systems. Defining the characteristics and quantities of harvested manure and runoff from open earthen lot animal systems is critical to planning storage requirements, land requirements for nutrient utilization, land application rates, and logistical issues, such as equipment and labor requirements. Accuracy of these estimates are critical to planning processes required by federal and state permitting programs. Poor estimates can lead to discharges that result in court action and fines, neighbor nuisance complaints, and surface and ground water degradation. Planning procedures have historically relied upon standard values published by NRCS (Stettler et al., 2008), MWPS (Lorimor et al., 2000), and ASABE (2014) for average characteristics.
What Did We Do?
A large data set of analyses from manure samples collected over a 15-year period from 444 independent cattle feedlot pens at a single eastern Nebraska research facility was reviewed to provide insight to the degree of variability in observed manure characteristics and to investigate the factors influencing this variability. No previous efforts to define these characteristics have included data gathered over such a wide range of dietary strategies and weather conditions. This exclusive research data set is expected to provide new insights regarding influential factors affecting characteristics of manure and runoff harvested from open lot beef systems. The objective of this paper is to share a preliminary summary of findings based upon a review of this data set.
What Have We Learned?
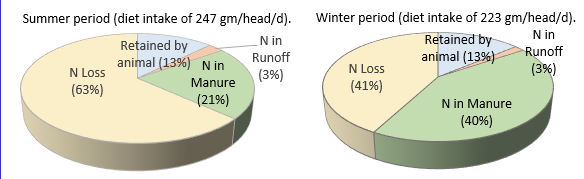
A review of this unique data set reveals several important preliminary observations. Standard values reported by ASABE and MWPS for beef manure characteristics in open lot systems are relatively poor indicators of the significant variability that is observed within open lot feeding systems. Our data set reveals significant differences between manure characteristics as a function of feeding period (Table 1) and substantial variability within feeding period, as illustrated by the large coefficients of variation for individual characteristics. Differences in winter and summer conditions influence the characteristics and quantities of solids, organic matter, and nutrients in the harvested manure. The timing of the feeding period has substantial influence on observed differences in nitrogen loss and nitrogen in manure (Figure 1). Nitrogen recovery for the warmer summer feeding periods averaged 51 and 6 grams/head/day in the manure and runoff, respectively, with losses estimated to be 155 grams/head/day. Similarly, nitrogen recovery in manure and runoff for the winter feeding period was 90 and 4 grams/head/day, respectively, with losses estimated at 92 grams/head/day (Figure 1 and Koelsch, et al., 2018). In addition, differences in weather and pen conditions during and following winter and summer feeding periods impact manure moisture content and the mixing of inorganics with manure (Table 1).
| Table 1. Characteristics of manure collected from 216 and 228 cattle feedlot pens during Summer and Winter feeding periods, respectively1. | ||||||||||
|---|---|---|---|---|---|---|---|---|---|---|
| University of Nebraska Feedlot in East Central Nebraska | Standard Values | |||||||||
| Summer | Winter | ASABE | NRCS | MWPS3 | ||||||
| Mean | CV2 | Mean | CV2 | Mean | Mean | |||||
| Total Manure (wet basis), kg/hd/d | 9.3 | 99% | 13.1 | 43% | 7.5 | 7.9 | ||||
| DM % | 71% | 10% | 63.2% | 15% | 67% | Collected | 55% | |||
| kg/hd/d | 5.4 | 80% | 8.0 | 41% | 5.0 | manure | 4.3 | |||
| OM % | 24% | 28% | 25.3% | 41% | 30% | is not | 50% | |||
| kg/hd/d | 1.00 | 52% | 1.87 | 41% | 1.5 | reported. | 2.2 | |||
| Ash % | 76% | 9% | 74.7% | 14% | 70% | 50% | ||||
| kg/hd/d | 4.16 | 72% | 6.10 | 49% | 3.5 | 2.2 | ||||
| N % | 1.3% | 36% | 1.19% | 23% | 1.18% | 1.2% | ||||
| g/hd/d | 51 | 50% | 90 | 33% | 88 | 95 | ||||
| P % | 0.37% | 41% | 0.34% | 29% | 0.50% | 0.35% | ||||
| k/hd/d | 17.7 | 55% | 26.0 | 42% | 37.5 | 27.7 | ||||
| DM = dry matter; OM = organic matter (or volatile solids)
1 Summer = April to October feeding period, Winter = November to May feeding period 2 Coefficient of variation, % 3 Unsurfaced lot in dry climate with annual manure removal. |
||||||||||
Dietary concentration of nutrients was observed to influence the harvested manure P content (Figure 2) but produce minimal impact on harvested manure N content (not shown). Diet was an important predictor in observed N losses, especially during the summer feeding period. However, its limited value for predicting harvested manure N and moderate value for predicting harvesting manure P suggests that other factors such as weather and management may be influential in determining N and P recovered (Koelsch, et al., 2018).

Significant variability exists in the quantity of total solids of manure harvested with a factor of 10 difference between the observed low and high values when compared on a mass per finished head basis (note large CVs in Table 1). This variability has significant influence on quality of the manure collected as represented by organic matter, ash content, and moisture content.
Although individual experimental trials comparing practices to increase organic matter on the feedlot surface have demonstrated some benefit to reducing nitrogen losses, the overall data set does not demonstrate value from higher pen surface organic matter for conservation of N in the manure (Koelsch, et al., 2018). However, higher organic matter manure is correlated to improved nitrogen concentration in the manure suggesting a higher value for the manure (Figure 3).

It is typically recommended that manure management planning should be based upon unique analysis for manure characteristics representative of the manure being applied. The large variability in harvested manure from open lot beef systems observed in this study further confirms the importance of this recommendation. The influence of weather on the manure and the management challenges of collecting manure from these systems adds to the complexity of predicting manure characteristics. In addition, standard reporting methods such as ASABE should consider reporting of separate standard values based upon time of the year feeding and/or manure collection period. This review of beef manure characteristics over a 15 year period further documents the challenge of planning based upon typical or standard value for open lot beef manure.
Future Plans
The compilation and analysis of the manure and runoff data from these 444 independent measure of feedlot manure characteristics is a part of an undergraduate student research experience. Final review and analysis of this data will be completed by summer 2019 with the data published at a later time. The authors will explore the value of this data for adjusting beef manure characteristics for ASABE’s Standard (ASABE, 2014).
References
ASABE. 2014. ASAE D384.2 MAR2005 (R2014): Manure Production and Characteristics. ASABE, St. Joseph, Ml. 32 pages.
Lorimor, J., W. Powers, and A. Sutton. 2000. Manure characteristics. Manure Management Systems Series MWPS-18. Midwest Plan Service. Ames Iowa: Iowa State University.
Stettler, D., C. Zuller, D. Hickman. 2008. Agricultural Waste Characteristics. Chapter 4 of Part 651, NRCS Agricultural Waste Management Field Handbook. pages 4-1 to 4-32.
Authors
Richard (Rick) Koelsch, Professor of Biological Systems Engineering and Animal Science, University of Nebraska-Lincoln
rkoelsch1@unl.edu
Megan Homolka, student, and Galen Erickson Professor of Animal Science, University of Nebraska-Lincoln
Additional Information
The authors are solely responsible for the content of these proceedings. The technical information does not necessarily reflect the official position of the sponsoring agencies or institutions represented by planning committee members, and inclusion and distribution herein does not constitute an endorsement of views expressed by the same. Printed materials included herein are not refereed publications. Citations should appear as follows. EXAMPLE: Authors. 2019. Title of presentation. Waste to Worth. Minneapolis, MN. April 22-26, 2019. URL of this page. Accessed on: today’s date.
Translating Beef Production Research to Marketing Outcomes
The audience will learn about different beef production systems and their performance outcomes. Participants will have the opportunity to expound upon the information shared, inquire with panelists, and actively participate in beef marketing improvements.
Interactive Panel
Moderators
Dr. Megan Webb, Assistant Professor and Beef Production Systems Extension Specialist, University of Minnesota
Ms. Karin Schaefer, Executive Director, Minnesota Beef Council
Panelists
Ms. June Dunn, Field Specialist, Greater Omaha Packing Company
Dr. Alan Rotz, Agricultural Engineer, USDA-ARS Pasture Systems and Watershed Management
Dr. Garrett Steede, Teaching Assistant Professor, Ag. Education, Communication and Marketing, University of Minnesota
Mr. Jerry Wulf, Partner at Wulf Cattle Company
Corresponding Author
Megan Webb, University of Minnesota, mwebb@umn.edu
The authors are solely responsible for the content of these proceedings. The technical information does not necessarily reflect the official position of the sponsoring agencies or institutions represented by planning committee members, and inclusion and distribution herein does not constitute an endorsement of views expressed by the same. Printed materials included herein are not refereed publications. Citations should appear as follows. EXAMPLE: Authors. 2019. Title of presentation. Waste to Worth. Minneapolis, MN. April 22-26, 2019. URL of this page. Accessed on: today’s date.
Feed Manipulation, Manure Treatment and Sustainable Poultry Production
This study examined the effects of different treatments of poultry faecal matter on potential greenhouse gas emission and its field application and also evaluated dietary manipulation of protein on the physico-chemical quality of broiler faeces and response of these qualities to 1.5% alum (Aluminium sulphate) treatment during storage.
Poultry litters were randomly assigned to four treatments: salt solution, alum, air exclusion and the control (untreated). Chicks were allotted to corn-soy diets for 42d. The diets were 22 and 20% CP with methionine + lysine content balance and, 22 and 20% CP diets with 110% NRC recommendation of methionine and lysine.
Alum treated faeces had higher (p<0.05) nitrogen retention than other treatments. Treated faecal samples retained more moisture (p < 0.05) than control. The pH tended to be acidic in treated samples (alum, 6.03, p<0.05) and alkaline in the control (7.37, p<0.05). Mean faecal temperature was lower for alum treated faecal samples (28.58oC, p<0.05) and highest for air-tight (29.4oC, p<0.05). Nitrogen depletion rate was significant lower (p<0.05) in alum treated faecal samples. Post-storage, samples treated with alum increased substantially (≥ 46.51%) in total microbial count, while total viable count was lower (p>0.05; 2.83×10⁶ cfu/ml) in air-tight treatment. Maize seeds planted on alum, air-excluded and control litter soils had average germination percentage range of 65–75%, 54–75% and 74-75%, respectively. In Sorghum plots, GP was 99%, and 89%, respectively for alum and air-tight treated soil 2WAP. Average maize height 21DAP was 48 cm and 23 cm for alum and air-tight treatment, respectively. Salt treated faecal samples did not support germination. Faecal pH of broiler fed low protein diets was acidic (4.76-4.80) while treatment with alum (1.5%) led to further reduction in pH (4.78 to 4.58) faecal nitrogen and organic matter compared with control faeces in a 7 days storage. Faecal minerals were generally lower. In conclusion, feeding low level of dietary protein with or without methionine and lysine supplementation in excess of requirement is a suitable mitigation for nitrogen emission and mineral excretion in broiler production. Alum treated poultry litter will mitigate further nitrogen loss in storage because it lowered nitrogen depletion rate, pH, weight, temperature and supports potential agronomic field application index.
On-farm Demonstration of the application of these results to assist farmers to produce poultry sustainably.
Further reading
https://scholar.google.com/citations?hl=en&user=NZGTKC8AAAAJ#d=gs_md_cita-d&u=%2Fcitations%3Fview_op%3Dview_citation%26hl%3Den%26user%3DNZGTKC8AAAAJ%26citation_for_view%3DNZGTKC8AAAAJ%3AW7OEmFMy1HYC%26tzom%3D-60
*BOLU, Steven Abiodun, ADERIBIGBE, Simeon Adedeji OLAWALE, Simon, Malomo, G. A., Olutade, S.G and Suleiman, Z.G. Department of Animal Production, University of Ilorin, Ilorin, Kwara State, Nigeria.
*Corresponding Author: Department of Animal Production, University of Ilorin, Ilorin, Kwara State, Nigeria.
Email: bolusao2002@yahoo.co.uk Phone: +234 8060240049
The authors are solely responsible for the content of these proceedings. The technical information does not necessarily reflect the official position of the sponsoring agencies or institutions represented by planning committee members, and inclusion and distribution herein does not constitute an endorsement of views expressed by the same. Printed materials included herein are not refereed publications. Citations should appear as follows. EXAMPLE: Authors. 2019. Title of presentation. Waste to Worth. Minneapolis, MN. April 22-26, 2019. URL of this page. Accessed on: today’s date.
Carbon, Water, and Land Use for Pork Production when Modifying Type and Regional Sourcing of Feed Ingredients
Providing animal protein to tomorrow’s nine billion people will be a challenge given the associated environmental pressures with animal production, particularly issues such as greenhouse gas (GHG) emissions, human health and water usage/quality. Globally, livestock production systems contribute 14.5% to the total human-induced emissions of greenhouse gases (FAO, 2013). Animal feed is a major component of these impacts with the composition of animal diets having important downstream effects (i.e. GHG emissions, animal productivity, animal health, product safety and quality and animal welfare) as well as upstream effects on water quality, GHG emissions, land use and energy consumption (Makkar, 2016). Despite these effects, feeding programs for swine largely only focus on cost minimization and productivity (Dubeau et al. 2011; Pomar et al. 2007). Finding ways to produce animal protein while reducing the environmental impacts is vital to maintaining the long-term economic viability and cultural significance of this industry.
Pork, and the meat industry in general, has downstream pressure from customers to decrease environmental impacts. Major food companies have initiated supply chain management programs to minimize their carbon footprint in response to consumer demands and societal concerns. Within pork production, feed grains and manure management are the two largest contributors to GHG emissions, water use and land use (Matlock et al., 2014; Thoma et al., 2011). However, there is high variability in agricultural production systems and the associated environmental impacts across these locations (Yang and Heijung 2016; Hellweg and Canals, 2014). There is further variability across space due to the large differences in manure management practices, climate conditions and fuel mixes employed in U.S. counties and processing facilities. While research has been done on characterizing the average environmental impacts across the U.S. (Thoma et al 2011; Macleod et al 2013), and for particular production systems on a specific farm (or on average) (Bandekar et al 2014), this substantial variability across the U.S. can significantly affect specific supply chain environmental impacts.
What did we do?
The US pork industry is not a homogenous group of producers (in location, size, or even feed inputs) and therefore providing one single LCA number for the entire industry is incomplete. To capture this variability we used the Food Systems Sustainable Supply-chain model (FoodS3) that uses county level environment impacts of corn production, rather than using a single national average estimate. We also added spatial difference in manure impacts by estimating the volatile solids excreted in manure by the three regional feeding programs using county specific manure management practices. Using these estimates, we calculated the water and land use impacts of corn feed inputs in regional pig feeding programs, as well as the GHG impacts from corn feed inputs and manure emissions. We ran these calculations for four feed programs including: 1) the use of corn distillers dried grains with solubles (DDGS) and 2) dehydrated retail level food waste, as approaches for recycling nutrients back into pig feed; as well as 3) the use of synthetic amino acids (AA) and 4) enzymes (i.e. phytase), as back-end diet supplementation strategies for minimizing the environmental impact of pork production.
What have we learned?
The inclusion of county level spatial environmental impact data and supply chain connections are significant to this work. Location matters, not just in regional diet mixes, but also in environmental impacts of sourcing ingredients and manure management. With the FoodS3 model is was possible to bring in modeled supply relationships in environmental impact analysis. Similarly, having food waste data nutrient analyses available to test a food waste diet added in a hypothetical “future technology” for pig food that has not been extensively studied.
We found that using the food waste feeding program resulted in the lowest corn input greenhouse gas emissions totals compared with all other feeding programs evaluated in this study. However, for all GHG emissions, the control feeding program had the lowest GHG emissions. While use of synthetic amino acids decreased excretion of volatile solids in manure, it resulted in the greatest greenhouse gas emissions. These emissions are the result of proportionally greater use corn in the synthetic amino acid diets than any other diet (more corn was required to ensure that the diet met the Nutrient Requirement for Swine (NRC, 2012) in our modeled diets). The impact of feeding program on greenhouse gas emissions also varied among geographic regions, where the Mid-West region had the least per pig emissions regardless of the type of diets used in the feeding program. This variation is primarily due to the spatially different emissions of feed ingredients estimated with our FoodS3 model. As expected, water and land use were least for the feeding program based on food waste, while using synthetic amino acids in diets resulted in the greatest water and land use per pig produced.
Future plans
While this study was an important step in bringing spatial heterogeneity to understanding the environmental impacts of pig diets, further work should consider diets with combinations of our alternative ingredients. Most commercially available pig diets already include synthetic AA and inorganic phosphorus (P), and many include DDGS. Furthermore, the diets may have regional variations in more than just corn and soy (which we accounted for), but also in some of our alternative ingredients, such as DDGS and food waste. Future research is needed to compare the environmental impacts of these diets to one that includes food waste as well as examine different rates of inclusion for food waste.
Authors
Jennifer Schmitt1*, Pedro Urriola2, Jae Cheol Jang3; Gerald Shurson4
1 Program Director and Lead Scientist, NorthStar Initiative for Sustainable Enterprise, Institute on the Environment, UMN jenniferschmitt@umn.edu
2 Research Assistant Professor, Department of Animal Science, UMN
3 Post-doctoral Associate Department of Animal Science, UMN
4 Professor-Swine Nutrition, Department of Animal Science, UMN
* Corresponding Author
Additional Information
Bandekar, P. et al., 2014. Life cycle analysis of swine management practices. San Francisco, Proceedings of the 9th International Conference on Life Cycle Assessment in the Agri-Food Sector.
Dubeau, F., Julien, P.-O., & Pomar, C. (2011). Formulating diets for growing pigs: economic and environmental considerations. Annals of Operations Research, 190(1), 239–269. https://doi.org/10.1007/s10479-009-0633-1
FAO. (2013). Food Wastage Footprint: Impacts on Natural Resources—Summary Report. Rome. Retrieved from http://www.fao.org/docrep/018/i3347e/i3347e.pdf
Hellweg, S. & Canals, L., 2014. Emerging approaches, challenges and opportunities in life cycle assessment. Science, 344(6188), pp. 1109-1113.
Macleod, M. et al., 2013. Greenhouse gas emissions from pig and chicken supply chains – a global life cycle assessment, Rome: Food and Agriculture Organization of the United Nations.
Matlock, M., Greg Thoma, B., Eric Boles Mansoor Leh, P., Sandefur Rusty Bautista, H., & Rick Ulrich, P. (2014). A Life Cycle Analysis of Water Use in U.S. Pork Production Comprehensive Report.
Pomar, C., Dubeau, F., Létourneau-Montminy, M.-P., Boucher, C., & Julien, P.-O. (2007). Reducing phosphorus concentration in pig diets by adding an environmental objective to the traditional feed formulation algorithm. Livestock Science, 111(1), 16–27. https://doi.org/10.1016/j.livsci.2006.11.011
Thoma, G., Nutter, D., Ulrich, R., Charles, M., Frank, J., & East, C. (2011). National Life Cycle Carbon Footprint Study for Production of US Swine, 1–75.
Yang, Y. & Heijungs, R., 2016. A general computation structure for regional life-cycle assessment. International Journal of Life Cycle Assessment, pp. 1-9.
Acknowledgements
Funding, in part, was provided by the National Pork Checkoff.
The authors are solely responsible for the content of these proceedings. The technical information does not necessarily reflect the official position of the sponsoring agencies or institutions represented by planning committee members, and inclusion and distribution herein does not constitute an endorsement of views expressed by the same. Printed materials included herein are not refereed publications. Citations should appear as follows. EXAMPLE: Authors. 2019. Title of presentation. Waste to Worth. Minneapolis, MN. April 22-26, 2019. URL of this page. Accessed on: today’s date.
USDA-NRCS and the National Air Quality Site Assessment Tool (NAQSAT) for Livestock and Poultry Operations
Proceedings Home | W2W Home 
Purpose
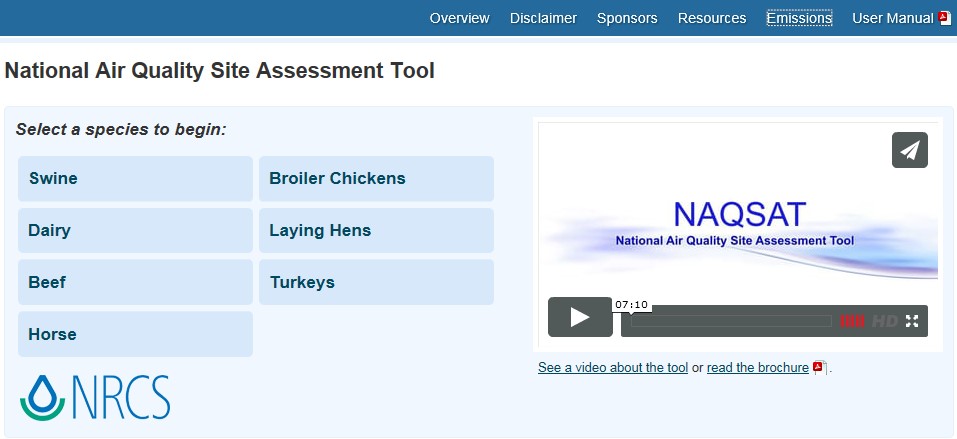
The National Air Quality Site Assessment Tool (NAQSAT) was developed as a first-of-its-kind tool to help producers and their advisors assess the impact of management on air emissions from livestock and poultry operations and identify areas for potential improvement related to those air emissions.
What did we do?
In 2007, several land-grant universities, with leadership from Michigan State University, began developing NAQSAT under a USDA-NRCS Conservation Innovation Grant (CIG). The initial tool included beef, dairy, swine, and poultry operations. A subsequent CIG project, with leadership from Colorado State University, made several enhancements to the tool, including adding horses to the species list. In 2015, USDA-NRCS officially adopted NAQSAT as an approved tool for evaluating air quality resource concerns at livestock and poultry operations. USDA-NRCS also contracted with Florida A&M University in 2015 to provide several regional training workshops on NAQSAT to NRCS employees. Six training workshops have been completed to date (Raleigh, NC; Modesto, CA; Elizabethtown, PA; Lincoln, NE; Richmond, VA; and Yakima, WA) with assistance from multiple NAQSAT development partners. Additionally, USDA-NRCS revised its comprehensive nutrient management plan (CNMP) policy in October 2015 to make the evaluation of air quality resource concerns mandatory as part of CNMP development.

What have we learned?
NAQSAT has proven to be a useful tool for bench-marking the air emissions impacts of current management on confinement-based livestock and poultry operations. In the training sessions, students have been able to complete NAQSAT runs on-site with the producer or producer representative via tablet or smartphone technologies. Further classroom discussion has helped to better understand the questions and answers and how the NAQSAT results can feed into the USDA-NRCS conservation planning process. Several needed enhancements and upgrades to the tool have been identified in order to more closely align the output of the tool to USDA-NRCS conservation planning needs. NAQSAT has also proven to be useful for evaluating the air quality resource concern status of an operation in relation to the CNMP development process.
Future Plans
It is anticipated that the identified needed enhancements and upgrades will be completed as funding for further NAQSAT development becomes available. Additionally, as use of NAQSAT by USDA-NRCS and our conservation planning and CNMP development partners expands, additional training and experience-building opportunities will be needed. The NAQSAT development team has great geographic coverage to assist in these additional opportunities.
Corresponding author, title, and affiliation
Greg Zwicke, Air Quality Engineer – Air Quality and Atmospheric Change Team, USDA-NRCS
Corresponding author email
Other authors
Greg Johnson, Air Quality and Atmospheric Change Team Leader, USDA-NRCS; Jeff Porter, Animal Nutrient and Manure Management Team Leader, USDA-NRCS; Sandy Means, Agricultural Engineer – Animal Nutrient and Manure Management Team, USDA-NRCS
Additional information
naqsat.tamu.edu
https://lpelc.org/naqsat-for-swine-and-poultry
https://lpelc.org/naqsat-for-beef-and-dairy/
Acknowledgements
C.E. Meadows Endowment, Michigan State University
Colorado Livestock Association
Colorado State University
Florida A&M University
Iowa Turkey Federation
Iowa Pork Producers
Iowa Pork Industry Center
Iowa State University
Iowa State University Experiment Station
Kansas State University
Michigan Milk Producers Association
Michigan Pork Producers Association
Michigan State University
Michigan State University Extension
National Pork Board
Nebraska Environmental Trust
Oregon State University
Penn State University
Purdue University
Texas A&M University
University of California, Davis
University of Georgia
University of Georgia Department of Poultry Science
University of Idaho
University of Maryland
University of Maryland Department of Animal and Avian Sciences
University of Minnesota
University of Missouri
University of Nebraska
USDA-ARS
Virginia Tech University
Washington State University
Western United Dairymen
Whatcom County (WA) Conservation District
The authors are solely responsible for the content of these proceedings. The technical information does not necessarily reflect the official position of the sponsoring agencies or institutions represented by planning committee members, and inclusion and distribution herein does not constitute an endorsement of views expressed by the same. Printed materials included herein are not refereed publications. Citations should appear as follows. EXAMPLE: Authors. 2017. Title of presentation. Waste to Worth: Spreading Science and Solutions. Cary, NC. April 18-21, 2017. URL of this page. Accessed on: today’s date.