
This webinar explores how an integrated, systems-based understanding of the nutrient cycle can drive more sustainable pork production. By examining both feed utilization within the animal and nutrient management beyond the barn, the discussion connects nutritional strategies and manure treatment technologies as key components of the pork ecosystem. Presenters will highlight advances in precision feeding, enzyme use, and feed processing that improve nutrient efficiency and reduce environmental impacts, as well as research optimizing zinc inclusion to balance performance and sustainability. This presentation was originally broadcast on November 14, 2025. Continue reading “A Systems-Approach to Understanding the Nutrient Cycle Across the Pork Ecosystem”
Rethinking Manure Management with 360Rain: Expanding Application Windows and Improving Nutrient Use Efficiency
This webinar will explore how the 360Rain autonomous irrigation system is being used as a new tool for manure management. By enabling in-season manure application, 360Rain opens opportunities to better match nitrogen availability with crop uptake, reduce manure storage time (and associated methane emissions), and even provide supplemental irrigation. This presentation was originally broadcast on September 26, 2025. Continue reading “Rethinking Manure Management with 360Rain: Expanding Application Windows and Improving Nutrient Use Efficiency”
Concise Composting
Purpose
Timber Creek Recycling has operated a turned windrow composting operation using manure and food waste processing by-products and green waste for over a decade in Meridian, Idaho. Pressure from suburban encroachment and the availability of increasingly difficult feedstocks that had excessive odor, created the need to move operations from a farm to an industrial site. Land costs were greater, and potential odor impacts would increase in this move. The owner also requested that the number of touches be reduced to minimize the current workload for compost operators. There are some essential operational & design considerations to manage manure composting on a concise footprint and a limited budget. This presentation describes the operation and design considerations that can apply to any composting operation.
What Did We Do?
Green Mountain Technologies considered three different models of concise composting. Radial stacker bunkers, using a central pivot telescopic conveyor to place and cover active compost piles. Also inwardly turned circular aerated piles, which use a side discharge compost turner to turn the compost towards the center of a large circle. Timber Creek Recycling decided to use a narrow profile rectangular shaped turned aerated pile composting approach. This form uses a long concrete aeration floor that allows the owner to build capacity in six phases and increase the operating efficiencies with each additional phase. This approach kept the expansions in line, so that delivery trucks could unload directly in front of the piles and so that side discharge compost turners could be used to mix feedstocks into one side of the pile and move the composting material through different aeration floor capacities and finally to a long collection belt that directly fed a compost screener. This and the aeration floor reduced touches from 12 to 9, compared to non-aerated windrows, and provided a once a week turning frequency, reducing compost, and curing time from 90 to 45 days.
Steps taken to reach this point.
Industrial land was purchased in Nampa, Idaho, permits received and phase one of construction has been completed and operated for over 9 months. The design compacted a 30-acre operational site to a 12-acre operational site with significantly more capacity than the original. Odor reduction steps were taken to reduce the odor of cheese whey waste activated sludge being delivered to the site by using a lime additive during the screw press step at the cheese manufacturer. A small straddle windrow turner was used to mix the delivered feedstocks, and a food waste de-packager was installed to manage out-of-date or off-specification foods.
What Have We Learned?
The use of reversing direction aeration was not necessary when using positive aeration using a cap of wet wood chips or screened compost covers on top of the piles for the first 7 to 10 days. Odors have not been a problem at the new site using forced aeration compared with turned windrows (un-aerated) at the old site. The higher horsepower side discharge conveyor compost turners do not make economic sense just for phase one but will for all three phases. Wastewater collection and reuse is difficult to manage and needs to be incorporated into the mixing and turning process using an underground main and hose reel located at the far end of the aeration pads.
Take home messages
Aeration using blowers and airpipes below a concrete floor can effectively keep composting operations with challenging feedstocks from smelling bad and increase the biological efficiency and throughput. Use of a woody moist bio cover over the top of the pile is essential for the first 7-10 days for these feedstocks.
Force air through a compost pile at least 6 times per hour using on/off timers to control pile temperatures between 125° and 145° F and to keep oxygen above 13% using a rate of 3-5 CFM/cubic yard. Automated temperature feedback controllers make this simpler and more dependable.
Turn and re-water at least 2 times in the first month, either by top irrigation within 30 minutes before turning, or using a hose reel and spray bar connected to the turner (better) or simply turn piles at least 30 minutes after a big rain event.
Piles shrink over time- Double up the piles after 2 weeks and cure with less forced air at 1-2 CFM/cubic yard for an additional 2 weeks.
Adding capacity over time without increasing travel distances requires delivery directly to the initial composting area and collection from the distant piles using conveyors. On-farm generated feedstocks and the composting operations should be placed together as close as possible. Have delivery and storage of outside amendments be alongside your manure or processing waste discharge locations.
Each touch of the material should be limited, and with each touch involving several key feedstock preparation actions while entering a composting system, such as metering materials together in the correct proportions, and mixing thoroughly while watering and delivering into the first composting stage. Examples include building windrows proportionally with loaders and turning and watering with a windrow turner that can apply pond wastewater as it turns. Second example, if a conveyor is used to collect and discharge a manure in a CAFO, add bulking materials prior to the last conveyor and place into an in-line pug mill before stockpiling or placement on an aeration floor. The third example when using side dump delivery trucks, have trucks unload manure in a long low windrow, and then place the amendment in another long low windrow alongside about 22 feet apart, then use a side discharge windrow turner with a spray bar to apply wastewater to combine and then mix the windrows together using the turner in 2 passes. Large loaders move about 500 cubic yards per hour, compost turners move over 4000 cubic yards per hour. So each touch is cheaper per unit.
Future Plans
Phases two and three are under development to move the entire windrow operation from Meridian Idaho to the new site within 2 years.
Authors
Presenting authors
-
- Jeffrey Gage, Director of Consulting, Green Mountain Technologies, Inc.
- Mike Murgoitio, President, Timber Creek Recycling
- Caleb Lakey, Vice President, Timber Creek Recycling, LLC
Corresponding author
Jeffrey Gage, Director of Consulting, Green Mountain Technologies, Inc., jeff@compostingtechnology.com
Additional author
Caleb Lakey, Vice President, Timber Creek Recycling, LLC.
Additional Information
-
- https://www.compostingtechnology.com
- https://www.timbercreekrecycling.com/
- Citations
- Industrial Composting: Environmental Engineering and Facilities Management, Eliot Epstein, CRC Press, 2011. https://www.taylorfrancis.com/books/mono/10.1201/b10726/industrial-composting-eliot-epstein?_ga=2.37894116.67590306.1739841108-1296093157.1739841108
- Compost Science & Utilization https://www.tandfonline.com/journals/ucsu20
- Biocycle Magazine https://www.biocycle.net/
- Case Studies: Annen Brothers, Mt Angel, OR. Timber Creek Recycling, Meridian and Nampa, ID. Stage Gulch Organics Compost Facility, Sonoma, CA.
A USDA multi-location project monitoring ammonia deposition near animal production sites
Animals excrete a lot of nitrogen as they grow with a large fraction escaping into the air as ammonia. What happens to that ammonia, and can we predict how that excess nitrogen might be beneficial to nearby crop production? This webinar will present pilot-scale research for manure and food waste treatment. This presentation was originally broadcast on May 16, 2025. Continue reading “A USDA multi-location project monitoring ammonia deposition near animal production sites”
Distillers grains impact on feedlot pen surface material
Purpose
Distillers grains (DGs) have been heavily researched as a diet additive for cattle since the early 2000s. Research has considered the nutritional value, optimization, and even how it impacts odors and greenhouse gases emitted from the surface of the pens that house cattle fed these diets. However, no work has been conducted to determine if there are changes in pen surface material properties after exposure to manure from diets containing DGs. Recent conversations with producers highlighted changes in pen surface characteristics such as significant loss in material and inability to maintain mounds in the pen. after DGs were fed for prolonged periods. Research has shown that manure from distillers diets contain excess proteins which we hypothesized could cause interruptions in soil particle interactions thus leading to a loss in integrity of the pen surface. The purpose of this work was to investigate if excess excreted protein in urine was the cause of changes in the properties of pen surface material.
What Did We Do?
This work was comprised of a large-scale study at a feedlot and a lab-scale study. In the feedlot study, cattle were fed either control (no DGs), wet DGs (40%) or dry DGs (40%) for 180 days. Once cattle were finished and removed from their pens, pen surface material (PSM) was collected from 4 general locations within each pen: behind the apron, on top of the mound, the side of the mound and the bottom of the pen. Samples from each pen with the same treatment were pooled into one single composite to represent each of the treatments. Samples were divided into two sets and analyzed by a commercial laboratory as either soil or manure. Soil analysis included pH, soluble salts, organic matter, nitrate nitrogen, potassium, sulfate, zinc, copper, calcium, sum of cations, % saturation of calcium and magnesium, and Mehlich-III phosphorus. Manure analysis included organic nitrogen, ammonium nitrogen, nitrate, phosphorus, potassium, sulfur, calcium, magnesium, sodium, zinc, iron, manganese, copper, boron, soluble salts pH, and moisture
For the lab-scale study, PSM was collected from a feedlot that does not feed DGs. Material was dried, ground, and sieved. Synthetic urine was added daily to bottles containing 300 g of PSM for 3 weeks to simulate prolonged addition of urine to feedlot pen surface. Samples were then shaken for 30 minutes and left at room temperature unsealed overnight. Synthetic urine contained either 0, 8, 16, or 32% additional protein. At the end of the study, samples were dried and sent to a commercial lab to be tested as soil in which the same properties listed above were again reported.
What Have We Learned?
In the feedlot study, differences (p < 0.05) in soluble salts were observed between all three treatments. Differences (p<0.05) were observed between the control and DGs diets for soluble salts, organic matter, potassium, sulfate, magnesium saturation, Mehlich P, pH, ammonium nitrogen, organic N, total N, phosphate, total phosphorus, and sulfur.
For the lab-scale study, properties in which differences (p<0.05) were measured between the control and treatments include: nitrate N, cation exchange capacity, magnesium, sodium, zinc, calcium saturation and magnesium saturation. Analysis which resulted in differences (p < 0.05) between control and all three added protein treatments include Mehlich P, potassium, calcium, and copper. No significant differences were determined between the control and the treatments for zeta potential and conductivity. Results of the feedlot study compared to the lab scale study suggest that changes in PSM are not solely caused by excess soluble protein excretion.
Future Plans
The lab scale study will be used to determine if fiber has any contribution to the observed changes in PSM properties. The results of this study will help us determine how best to manage feedlot pens when varying forms and concentrations of DGs are fed to the cattle. It may also provide insight into potential pen surface amendments that may be used to mitigate the negative effects of feeding DGs to cattle.
Authors
Corresponding author
Bobbi Stromer, Research Chemist, US Meat Animal Research Center, Bobbi.stromer@usda.gov
Additional authors
Mindy Spiehs, Research Nutritionist, US Meat Animal Research Center
Bryan Woodbury, Research Engineer, US Meat Animal Research Center
Additional Information
USDA is an equal opportunity provider and employer
Acknowledgements
The authors wish to thank Victor Gaunt for assistance with data collection.
The authors are solely responsible for the content of these proceedings. The technical information does not necessarily reflect the official position of the sponsoring agencies or institutions represented by planning committee members, and inclusion and distribution herein does not constitute an endorsement of views expressed by the same. Printed materials included herein are not refereed publications. Citations should appear as follows. EXAMPLE: Authors. 2025. Title of presentation. Waste to Worth. Boise, ID. April 7–11, 2025. URL of this page. Accessed on: today’s date.
Augmenting sustainability through bioenergy generation using aquaponics production wastes
Purpose
With a rapid increase in global population, food security has become a significant concern. This has led to a significant rise in the demand for protein rich sustainable food. Therefore, worldwide tilapia cultivation is being seen as one of the most economical paths to meet the demand of protein rich food. Moreover, with increasing urbanization and pressing need of nutrient circularity, cost reduction and sustainability has driven the concept of aquaponics system, integrating aquaculture with hydroponics.
Aquaponics has gained significant demand both in the USA and globally and is postulated to reduce overall cost and land footprint, while simultaneously recycling the nutrients in a closed system. Further integration of an anaerobic digestion (AD) system for biogas production using aquaponics waste can make the aquaponic system energy resilient and environmentally sustainable. Therefore, the purpose of this study is to investigate the potential of various aquaponics waste for biogas production, and their fate under co-digestion.
What Did We Do?
In this study, aquaponics waste viz., aquaponic sludge, and lettuce roots and leftover leaves after harvesting were obtained as AD substrate from the aquaponic test bed, running under controlled conditions at Purdue University. A centroid simplex design was created to test the biochemical methane potential (BMP) of the substrate under co-digestion. The BMP test was performed in 1.2-L BMP anaerobic digesters, which have a working volume of 1 L. Dairy manure-based digestate obtained from a continuously running industrial digester was used as an inoculum. For all the test groups, substrate to inoculum ratio was maintained at 1:3. All the test groups were set up in triplicates, and the digesters were incubated in the water bath at 37 °C for 30 days. Biogas volume was measured daily using a syringe method.
What Have We Learned?
The study results showed that the aquaponic sludge and lettuce leaves fed in the anaerobic digesters at a ratio of 50:50 on volatile solids (VS) basis had the highest specific methane yield of 0.525 m3 kg-1 VS. However, the lettuce roots showed an antagonistic effect on co-digestion, giving a specific biogas yield of 0.173 m3 kg-1 VS. The results indicate that enhanced methane yields can be achieved by co-digesting aquaponic sludge with farm residues in an appropriate ratio.
Future Plans
This study is part of a USDA research project to develop sustainable blue food systems driven by integrated aquaponics. Further efforts in AD of aquaponics waste are planned to mitigate the inhibitory effect of lettuce roots on co-digestion, so all aquaponics farm residues can be optimally utilized, simultaneously addressing waste management and generating nutrient-rich digestate as a biofertilizer for aquaponic crops. This approach can transform organic waste from aquaponics and plant harvesting into renewable energy, offsetting external energy needs and reducing the environmental footprint.
Authors
Presenting & corresponding author
Ji-Qin Ni, Professor, Agricultural and Biological Engineering, Purdue University, Jiqin@purdue.edu
Additional authors
Mohit Singh Rana, Postdoctoral Research Associate, Purdue University
Rajesh Nandi, Ph.D. student, Purdue University
Additional Information
Web: https://ag.purdue.edu/department/foodsci/big-project/index.html
Instagram: https://www.instagram.com/whenblueisgreenproject?igsh=MTF5a2xsdmppbWE0
X: https://twitter.com/WBlueIsGreen?_ga=2.200172589.2080482534.1739499225-1469780589.1739498857
Acknowledgements
This research was supported by the intramural research program of the U.S. Department of Agriculture, National Institute of Food and Agriculture, Agriculture and Food Research Initiative grants no. 2023-68012-39001.
The authors are solely responsible for the content of these proceedings. The technical information does not necessarily reflect the official position of the sponsoring agencies or institutions represented by planning committee members, and inclusion and distribution herein does not constitute an endorsement of views expressed by the same. Printed materials included herein are not refereed publications. Citations should appear as follows. EXAMPLE: Authors. 2025. Title of presentation. Waste to Worth. Boise, ID. April 7-11, 2025. URL of this page. Accessed on: today’s date.
Can Manure Application Offset Tillage Impact on Soil Health Metrics in Organic Systems?
Purpose
Organic farming systems rely on internal, biologically mediated processes that can provide plants essential nutrients and suppress pests and disease. While reliance on soil biology to produce healthy plants is at the heart of the soil health concept, little research has been conducted in certified organic systems. Organic growers in Idaho and elsewhere need greater access to information on building soil health to enhance long-term productivity and sustainability on their farms. The overall goal of this project was to provide tools and targets to guide soil management during the transition to organic operation, thereby increasing soil health and internal function of certified organic systems.
Specifically, we assessed how key soil health indicators and soil organisms changed under combinations of three different tillage and nutrient management strategies during the transition to organic farming.
What Did We Do?
Replicated plots were established at two sites each in two growing regions of Idaho (North and South), to determine the impact of different levels of tillage and organic matter additions on soil health indicators and crop growth during the organic transition phase. Both sites in Northern Idaho, GDF and SSF, were located near Moscow while both sites in Southern Idaho, KF and TF, were in Twin Falls County. All sites can be broadly characterized as having silt loam soils. However, Northern Idaho is rainfed with 27 inches of rainfall per year while Southern Idaho receives an average of 8 inches of precipitation. The sites in Southern Idaho were irrigated while those in Norther Idaho were not.
For all sites, alfalfa was established in year one and maintained for three years before it was terminated then feed barley was planted. For the two sites in Northern Idaho, alfalfa did not establish and was replanted in year 2. Each site had three levels of disturbance (tillage): high, medium, and low and three levels of organic additions: high, medium, and low for a total of nine plots per site (Figure 1). Treatment combinations were not replicated within site but instead replicated across sites (4 sites total). High tillage intensity included several passes of a rototiller and/or chisel plow with harrow. Medium intensity included one pass of a rototiller and/or chisel plow; while the low intensity only had harrow. Organic amendments were added every year; the medium rate of organic addition was designed to provide crop uptake of phosphorus for alfalfa and nitrogen for barley while the high rate was doubled. The low rate was bone meal (phosphorus) or blood meal (nitrogen) to meet crop uptake of the alfalfa and barley, respectively.
Yield was measured via hand sampling at all sites in September 2024. A wide range of soil physical, chemical, and biological soil health indicators were assessed in June 2024. Due to space limitations, only active carbon, also known as POxC, will be reported here. POxC is generally considered an indicator that is sensitive to management changes, especially those that increase soil carbon. It provides a quicker response than soil organic matter because POxC only indicates a small fraction of the soil carbon pool.

What Have We Learned?
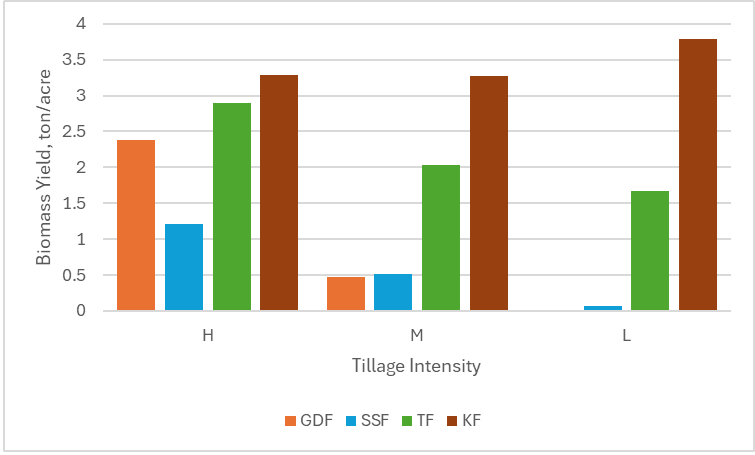
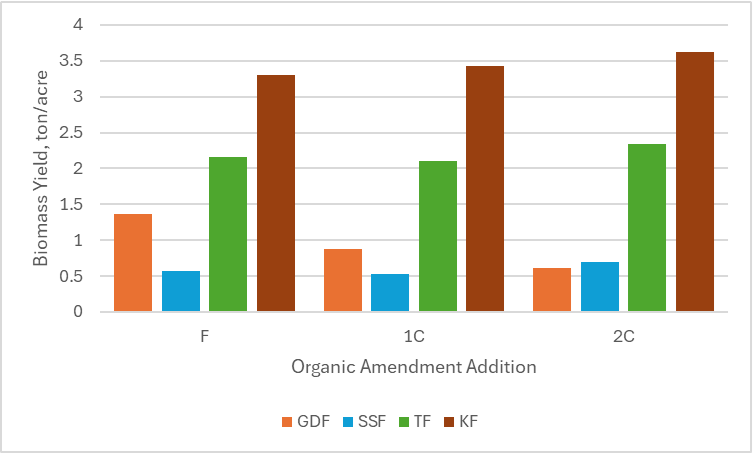
In Northern Idaho, upon harvest, total above ground biomass of spring barley was nearly double at GDF (1.72 tons/acre) compared to SSF (0.91 tons/acre) (Figure 2). Across both Northern Idaho sites, higher barley yield was associated with higher tillage with one of the sites having no harvestable barley in the low tillage treatment due to high weed and volunteer alfalfa pressure. Barley yields in Southern Idaho were higher than in Northern Idaho; KF had average yields of 3.45 tons/acre with TF averaging 2.20 tons/acre. Yields in Southern Idaho were the highest in the high tillage plots and lowest in the medium tillage. Organic amendment addition made little difference compared to tillage intensity for yields (Figure 3).
In terms of soil health indicators, POxC averaged higher at GDF plots (833.19 mg/kg soil) when compared to SSF plots (452.95 mg/kg soil). POxC was substantially lower in Southern Idaho than in Northern Idaho; plots at KF averaged 331.46 mg/kg soil while the TF site averaged 404.35 mg/kg soil. POxC decreased with depth across all sites. In Northern Idaho, there were no consistent trends for tillage or fertilizer across both sites. Treatment effects of tillage and fertilizer application depended on location. For example, GDF plots had an inverse relationship of POxC levels and increasing tillage. At SS, higher levels of POxC were associated with higher levels of tillage. Unlike Northern Idaho, POxC increased with decreasing tillage intensity at both sites in Southern Idaho. Across both Southern Idaho sites, POxC averaged 390.17 mg/kg soil in the lowest tillage intensity, 372.68 mg/kg soil for medium tillage intensity, and 340.87 mg/kg soil in the highest tillage intensity. There was no consistent effect of organic matter addition, however.
Future Plans
We are still analyzing data from this four-year study for other soil health indicators, such as the , earthworm species, and soil infiltration rates. This robust data set (over a dozen indicators total) will help guide which indicators of soil health are most suitable for organically managed systems.
Authors
Presenting & corresponding author
Linda Schott, Assistant Professor and Extension Specialist, University of Idaho, Lschott@uidaho.edu
Additional authors
Kendall Kahl, Assistant Professor and Extension Specialist, University of Idaho
Jodi Johnson-Maynard, Department Head and Professor, University of Georgia
Glen Stevens, Research Technician, University of Idaho
Ed Lewis, Professor, University of Idaho
Additional Information
Soil Health | University of Idaho Extension
Acknowledgements
Dan Temen, Will Romano, Kevin Kruger, Cami Ditton
The authors are solely responsible for the content of these proceedings. The technical information does not necessarily reflect the official position of the sponsoring agencies or institutions represented by planning committee members, and inclusion and distribution herein does not constitute an endorsement of views expressed by the same. Printed materials included herein are not refereed publications. Citations should appear as follows. EXAMPLE: Authors. 2025. Title of presentation. Waste to Worth. Boise, ID. April 7-11, 2025. URL of this page. Accessed on: today’s date.
Effect of Swine Manure Nitrification on Mesophilic Anaerobic Digester Performance
Purpose
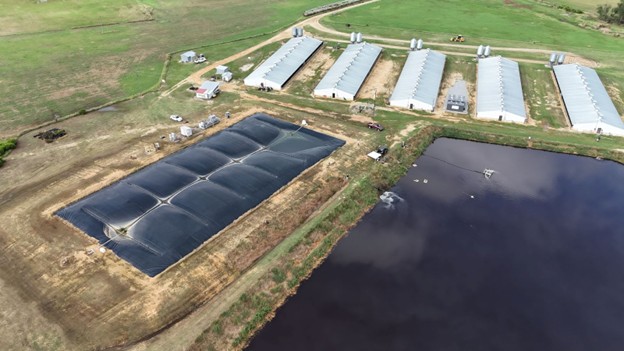
This study seeks to quantify the impact of swine slurry nitrification on biogas productivity. Ammonia (NH3) is produced during anaerobic digestion of manure and emitted during storage. Ammonia emissions have adverse impacts on swine health and growth, caretaker health, and local air and water quality. Ammonia is also known to inhibit methanogenic activity during anaerobic digestion, reducing methane potential. Thus, reducing ammoniacal nitrogen in digester feedstock can improve digester performance. A novel approach to nitrogen management, developed by a commercial partner, is nitrifying flush water that feeds into the digester. This technology leverages nitrification to suppress NH3 volatilization through using low-pH, highly nitrified substrate to flush the barns. This alternative reduces in-barn NH3 concentration surge during flushing events. In addition, equilibrium between nitrified (oxidized) flush liquid and reduced urine-feces will reduce ammoniacal nitrogen levels in the feed entering the digester. A barn-scale system (17,000 gallons per day capacity) is currently under testing on a NC swine farm that has an anaerobic digester as part of the waste management system (Figure 1). Understanding the impacts of this treatment on anaerobic digestion under controlled conditions under different organic loading rates is needed. This study aimed to quantify impacts of flush water nitrification on biomethane yield (BMY) in swine manure under two different organic loading rates (OLRs).
What Did We Do?
Three different substrates were collected for this study. Substrates were sourced from the same farm every 2 to 3 weeks (Figure 2). Swine slurry was processed through settling > decanting > maceration > screening to create liquid (<1% solids) and solid (>5% solids) fractions needed to formulate desired OLRs. Two OLRs were tested in this study, 1 g VS/L-d (low, L) and 2 g VS/L-d (high, H). For each OLR, two substrate formulations were tested: nitrified (treatment, T) and baseline (control, C). Therefore, four combinations of substrate and OLR were evaluated in this study and were abbreviated as: CH, CL, TH, and TL.

Eight mesophilic reactors at 95°F (35 °C), each with a two-liter active volume, were used to study the impacts of OLR and substrate type, with two replicates per OLR-substrate combination, represented by 1 or 2, respectively. Reactors were fed once daily, 6 days per week, unless otherwise noted. Influent and digestate total solids (TS), volatile solids (VS), chemical oxygen demand (COD), pH, alkalinity, and nitrogen forms were analyzed during the study. Biogas composition (% carbon dioxide (CO2), methane (CH4), and nitrogen gas (N2)), specific CH4 productivity (mL/g VS-fed), and volatile solids and COD reduction (%) were compared across treatments.
What Have We Learned?
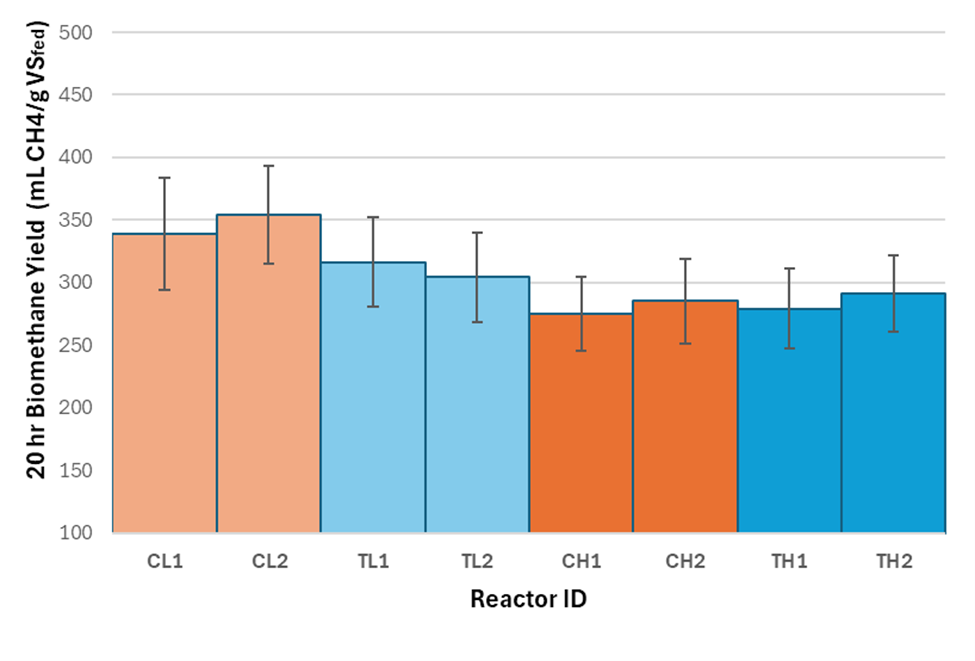
Overall, comparable BMY values were observed across reactors with mean reactor productivity ranging from 275 to 354 mLCH4/g VS-fed. Average BMY for the reactors represented around 61% of typical values of ultimate biomethane potential (BMP) for swine manure reported in the literature, i.e., 450 to 550 mLCH4/gVS. Increasing OLR from 1 to 2 gVS/L-d resulted in a 14% decrease in BMY. The nitrogen treatment effect appears to be minimal and only limited to low OLR treatments. The percentage deviation of biomethane productivity between C and T reactors was less than 1%.
Similar to CH4, concentrations of CO2 were impacted more by OLR than the nitrogen treatment implemented. For low OLR reactors, Average CO2 concentrations in the biogas were for treatment reactors. Increasing the OLR showed an increase in CO2 concentration in the biogas, with control and treatment reactors containing approximately , respectively.
Future Plans
We plan to continue our data analysis to quantify reduction in VS and COD. Similarly, digestate characterization to quantify alkalinity and volatile fatty acids (VFAs) in the feedstock and digestates is ongoing. Two-way analysis of variance (ANOVA) will be conducted to assess treatment impacts on specific methane yield, VS and COD reduction. Denitrification occurring within reactors was further investigated via GC-TCD headspace analysis. We plan to closely analyze denitrification dynamics to capture the effect of treatment on nitrogen forms and organic matter in the substrates.
Authors
Presenting author
Kristina E. Jones, Graduate student researcher, North Carolina State University
Corresponding author
Mahmoud A. Sharara, PhD, Associate Professor and Extension Specialist, North Carolina State University, Msharar@ncsu.edu
Acknowledgements
This work was funded by Pancopia, Inc. as part of a Department of Energy, Small Business Innovation Research program grant (DOE SBIR, Grant No. DE-SC0020833). Authors would like to acknowledge Smithfield Foods for access and support sampling. and undergraduate student researchers: Brian Ngo, Nick Bell, Kiarra Condon, Himanth Mandapati, and Jackson Boney for assistance and support conducting this study.
The authors are solely responsible for the content of these proceedings. The technical information does not necessarily reflect the official position of the sponsoring agencies or institutions represented by planning committee members, and inclusion and distribution herein does not constitute an endorsement of views expressed by the same. Printed materials included herein are not refereed publications. Citations should appear as follows. EXAMPLE: Authors. 2025. Title of presentation. Waste to Worth. Boise, ID. April 7-11, 2025. URL of this page. Accessed on: today’s date.
EcoManure: A Machine Learning Framework for Nitrogen Level Prediction and Classification of Sustainable Manure Waste Management
Purpose
Agricultural waste, including animal manures, can be a source of environmental pollution if not handled properly (Maji et al., 2020) due to nitrogen leaching into water systems and methane emissions. While electronic sensors and spectroscopic devices can give measurements for nitrogen content, the costs can be prohibitive, with regular calibration and deviations from defined composition levels in manures. To address these challenges, we developed EcoManure, as a machine learning framework to predict nitrogen content and classify the type of manure. By incorporating historical and real-time data, EcoManure affords a competitive edge for enhanced accuracy and lowered dependency on expensive sensors in aiding more sustainable decision-making on waste management.
What Did We Do?
To handle the complex tasks of predicting nitrogen levels and classifying manure, we started by putting together a complete set of data that included key agricultural factors. We used ManureDB – National Database of Manure Nutrient Content and Other Characteristics (1998–2023), a publicly available dataset from the USDA Ag Data Commons. The dataset comprehensively listed the different types of animals, geographical locations, moisture content, total solids percentage, and the treatment methods for the manure, as well as its chemistry and physical characteristics like pH, level of organic matter, concentration of nutrients (Nitrogen, Phosphorus, Potassium), and trace constituents like Calcium, Magnesium, and Zinc. After this dataset was constructed, the cleaning procedures were carried out, which included dealing with missing values, encoding categorical variables, and applying feature engineering for better accuracy of the model with its predictions. The set was divided into 80% for training and the rest 20% for testing.
| Metric | Value |
|---|---|
| Number of Training Samples | 360,000 |
| Number of Testing Samples | 90,000 |
| Classification Accuracy | 0.50 |
| Precision | 0.86 |
| Recall | 0.14 |
| F1-Score | 0.71 |
We estimate the total nitrogen content from manure characteristics using a Random Forest Regressor during the predictive modeling phase. As shown in Table 1, this regression model was fine-tuned and validated using standard metrics such as mean squared error (MSE) and R² to address the accuracy issue in nitrogen prediction. Additionally, we evaluated the model’s performance using MSE (Mean Squared Error) and MAE (Mean Absolute Error), where lower values of both MSE and MAE indicate better prediction accuracy. Simultaneously, a Random Forest Classifier was constructed to predict different types of manure, allowing the differentiation between based on their fundamental compositional attributes. The performance of the classifier was evaluated on accuracy metrics to test its reliability in practical application as shown in table 2 and the visual representation in Figure 1 verifies the dependence of actual values and predicted values. The performance matrix includes Classification Accuracy, which measures the overall percentage of correct predictions, Precision, which shows how many predicted positive results are correct, Recall, which indicates how many actual positives were identified, and the F1 Score, which balances precision and recall into a single metric. We also created a friendly machine learning framework (Chlingaryan, Sukkarieh, & Whelan, 2018; Jordan & Mitchell, 2015) interface for easy predictions and classifications. This would allow farmers, scientists and other stakeholders like policymakers to input their relevant details of the manure and provide swift responses about its nitrogen content and type, thus leading to better sustainable decisions in farming.
| Metric | Value |
|---|---|
| Number of Training Samples | 360,000 |
| Number of Testing Samples | 90,000 |
| Classification Accuracy | 92% |
| Precision | 90% |
| Recall | 91% |
| F1-Score | 90.5% |

Figure 1: Comparison of Actual and Predicted Nitrogen LevelsWhat Have We Learned?According to our experimental findings, EcoManure accounts for 86% of the variability for the nitrogen content predictions in manure samples. Also, the system has an exceptionally high classification accuracy for manure types with close to 92%. These results demonstrate that machine learning can serve as a powerful alternative to expensive sensors and spectroscopic devices. AS a result, it provides accurate and cost-effective predictions.
Future Plans
Our future plan involves upgrading it to incorporate additional factors affecting the environment and manure treatment. As additional predictive variables, we will analyze temperature, humidity, and probable microorganisms’ composition. This will improve the accuracy of our model. Furthermore, sensor technology will enable continuous monitoring and real-time data collection, greatly enhancing our understanding of the manure’s state. This approach allows for timely modifications as needed. In conclusion, we aim to advance the field of precision agriculture and contribute towards environmental sustainability with a focus on intelligent waste management built on machine learning algorithms.
Authors
Presenting & corresponding author
Kallol Naha, PhD Candidate, Computer Science, University of Idaho, naha7197@vandals.uidaho.edu
Additional author
Hasan Jamil, Associate Professor, Computer Science, University of Idaho
Additional Information
Chlingaryan, A., Sukkarieh, S., & Whelan, B. (2018). Machine learning approaches for crop yield prediction and nitrogen status estimation in precision agriculture: A review. Computers and Electronics in Agriculture, 151, 61–69.
Maji, S., Dwivedi, D. H., Singh, N., Kishor, S., & Gond, M. (2020). Agricultural waste: Its impact on environment and management approaches. Emerging Eco-Friendly Green Technologies for Wastewater Treatment, 329–351.
Jordan, M. I., & Mitchell, T. M. (2015). Machine learning: Trends, perspectives, and prospects. Science, 349(6245), 255–260.
USDA. (2023). ManureDB – National Database of Manure Nutrient Content and Other Characteristics (1998–2023). USDA Ag Data Commons. Available at: https://agdatacommons.nal.usda.gov/articles/dataset/ManureDB_-National_database_of_manure_nutrient_content_and_other_characteristics_1998-_2023/26031256?file=47165362
Acknowledgements
This research was funded by the USDA Sustainable Agricultural Systems Initiative through the Idaho Sustainable Agriculture Initiative for Dairy (ISAID) grant (Award No. 2020-69012-31871).
The authors are solely responsible for the content of these proceedings. The technical information does not necessarily reflect the official position of the sponsoring agencies or institutions represented by planning committee members, and inclusion and distribution herein does not constitute an endorsement of views expressed by the same. Printed materials included herein are not refereed publications. Citations should appear as follows. EXAMPLE: Authors. 2025. Title of presentation. Waste to Worth. Boise, ID. April 7-11, 2025. URL of this page. Accessed on: today’s date.
The Circular Bioeconomy
Purpose
The “Circular Bioeconomy” seems to be everywhere these days. The American Society of Biological and Agricultural Engineers (ASABE) created a Circular Bioeconomy Systems Institute. The Water Environment Federation (WEF) sponsored a Circular Water Economy Summit. I’m on an email list called “In the Loop with EPA: Circular Economy Updates”. Even my old alma mater, the University of Arkansas, announced a position for an Assistant Professor in Engineering for the Circular Economy.
In the midst of all this, I am sensing a backlash from my colleagues. There is a rising attitude of, “isn’t this just a new name for what we’ve been doing all along?” True, but the Circular Bioeconomy is a bona fide environmental concept, one rooted in a process evolving for at least four and a half billion years on planet earth – Nature itself. We Waste to Worth folks should embrace the Circular Bioeconomy. We should proudly say, “This is what I do.”
What Did We Do?
So, what is the Circular Bioeconomy?
Here lies the problem. The terms “circular economy” and “bioeconomy” are interpreted by different groups to mean different things, leading to confusion and cynicism. Perhaps the clearest way to define the Circular Bioeconomy is to state what it is not. A circular bioeconomy is not a linear “take-make-waste” economy based on extraction of limited resources. The Circular Bioeconomy is an aspiration, a transition to a nature-based economy centered on sustainability.
What Have We Learned?
How can we explain what we do in the Circular Bioeconomy to the public we serve?
Most of the people attending this conference already work in “the bioeconomy” — either in agriculture, forestry, fisheries, or natural resource conservation. The place to start is with circularity. The universe you and I inhabit works in cycles. The second law of thermodynamics is “water flows downhill.” The law of nature is “energy flows and materials circulate.”
Translating this simple concept can get complicated quickly. There are numerous qualitative descriptors for various aspects of circularity, and an attempt to quantify circularity is in its infancy.
Future Plans
So, take a step back and focus on the central truth. What is true for the water cycle, is true for nutrient cycles, is true for agriculture, is true for the power grid, and these are all interconnected.
Plants use solar energy and transpire water vapor to the atmosphere. Energy is released through condensation. Rain falls on the earth and rivers flow to the sea. Water vapor travels on prevailing winds…
Soil microorganisms use energy contained in organic matter for growth. Microorganisms release nutrients for crops to grow. Crops are eaten by livestock and poultry. Animals of all species produce manure rich in organic matter and nutrients…
round and round …
sustainably.
Presenting and Corresponding author
Douglas W. Hamilton, Ph.D., P.E., Associate Professor and Waste Management Specialist, Oklahoma State University, dhamilt@okstate.edu
Additional Information