Most manure book values used today from the MidWest Plan Service (MWPS) and American Society of Agricultural and Biological Engineers (ASABE) were derived from manure samples prior to 2003. To update these manure test values, the University of Minnesota in partnership with the Minnesota Supercomputing Institute, is working to build a dynamic manure test database called ManureDB. During this database construction, the University of Minnesota collected manure data spanning the last decade from five labs across the country. Trends, similarities, and challenges arose when comparing these samples. Having current manure test numbers will assist in more accurate nutrient management planning, manure storage design, manure land application, and serve agricultural modeling purposes.
What Did We Do?
We recruited five laboratories for this preliminary study who shared some of their manure sample data between 2012-2021, which represented over 100,000 manure samples. We looked at what species, manure types (liquid/solid), labels, and units we had to work with between the datasets to make them comparable. Once all the samples were converted into either pounds of nutrient/ton for solid manure or pounds of nutrient/1000 gallons for liquid manure, we took the medians of total nitrogen, ammonium-nitrogen (NH4-N), phosphate (P2O5), and potassium oxide (K2O) analyses from those samples and compared them to the MWPS and ASABE manure nutrient values.
What Have We Learned?
There is no standardization of laboratory submission forms for manure samples. The majority of samples have minimal descriptions beyond species of animal and little is known about storage types. With that said, we can still detect some general NPK trends for the beef, dairy, swine, poultry manure collected from the five laboratories in the last decade, compared to the published book values. For liquid manure, the K2O levels generally increased in both the swine and poultry liquid manure samples. For the solid swine manure and solid beef manure, total N, P2O5, and K2O levels all increased compared to the published book values. The solid dairy manure increased in P2O5 and K2O levels, and the solid poultry manure increased in total N and K2O. See Figure 1 for the general trends in liquid and solid manure for swine, dairy, beef, and poultry.
Table 1. Manure sample trends 2012-2021 compared to MWPS/ASABE manure book values. (+) = trending higher, (o) = no change/conflicting samples, (-) = trending lower
Liquid
Total N
NH4–N
P2O5
K2O
Swine
o
o
–
+
Dairy
–
o
–
o
Beef
o
o
o
o
Poultry
o
+
–
+
Solid
Total N
NH4–N
P2O5
K2O
Swine
+
o
+
+
Dairy
o
o
+
+
Beef
+
–
+
+
Poultry
+
o
o
+
Future Plans
The initial data gives us a framework to standardize fields for the future incoming samples (location, manure type, agitation, species, bedding, storage type, and analytical method) along with creating a unit conversion mechanism for data uploads. We plan to recruit more laboratories to participate in the ManureDB project and acquire more sample datasets. We will compare and analyze this data as it becomes available, especially more detailed data for each species. We will be designing ManureDB with statistical and data visualization features for future public use.
Authors
Nancy L. Bohl Bormann, Graduate Research Assistant, University of Minnesota
This work is supported by the AFRI Foundational and Applied Science Program [grant no. 2020-67021-32465] from the USDA National Institute of Food and Agriculture, the University of Minnesota College of Food, Agricultural and Natural Resource Sciences, and the Minnesota Supercomputing Institute.
The authors are solely responsible for the content of these proceedings. The technical information does not necessarily reflect the official position of the sponsoring agencies or institutions represented by planning committee members, and inclusion and distribution herein does not constitute an endorsement of views expressed by the same. Printed materials included herein are not refereed publications. Citations should appear as follows. EXAMPLE: Authors. 2022. Title of presentation. Waste to Worth. Oregon, OH. April 18-22, 2022. URL of this page. Accessed on: today’s date.
Most manure composition data summaries available in the U.S. are outdated because genetics, feed rations, manure handling, and housing practices have evolved over the past two decades. This means that the community that uses this manure data, such as farmers developing manure management plans, engineers designing manure storages, state and federal regulators establishing best management practices for manure land application, or researchers modeling nutrient cycling and gas emissions, is using outdated information. Thousands of manure samples, however, are analyzed every year by university and commercial labs across the country and could provide an up-to-date source of information. Until recently, there has been no mechanism for combining and summarizing this valuable data in a way that makes the results accessible to the broader community of users. Together with the Minnesota Supercomputing Institute (MSI) and the Minnesota Department of Agriculture (MDA) – who runs the only manure analysis proficiency program in the United States – researchers at the University of Minnesota are developing a national database for manure test results. The database, or ManureDB, will meet FAIR principles (Findable, Accessible, Interoperable, and Reusable) to ensure the data is shared and used by a wide audience.
What Did We Do?
The project team brought together a stakeholder group involved with manure management, regulation, lab analysis, and research to help us develop standards and best practices for data management. The stakeholder team helped inform the creation of several deliverables to date, including a schema and framework for the database, as well as a data use agreement template. The MSI is currently working on the development of the public-facing website that will interface with the database as well as a data cleaning tool to help standardize the data as it is uploaded.
What Have We Learned?
The stakeholder group identified that data privacy is a top priority. Customer data (i.e., name and address) will be removed, though state and zip codes will remain with the data (full zip codes will not be shared publicly). We also found that there is a stark difference between what data the full stakeholder team would like to see (i.e., manure data for livestock facilities by county or watershed code for different livestock species and manure storage types) versus what commercial laboratories collect (i.e. livestock species and sometimes the address of the livestock facility, but more often the address of the person requesting the tests). Standardizing manure submission forms in the future will potentially help ensure that information collected for each sample is consistent. Future educational efforts for those advising farmers on manure testing will be needed to ensure the forms are filled out accurately instead of being left blank.
Future Plans
This project is ongoing. We are in the process of working with our current participating labs to sign data use agreements and then to clean and upload data. New labs will be recruited throughout the project period. A public-facing dashboard will be created to search through aggregate data. We are working with our stakeholder groups to design websites for other potential use cases, including a site to download cleaned data for research purposes and potentially a site for labs to be able to benchmark their samples against labs from within and outside of their regions.
Authors
Melissa L. Wilson, Assistant Professor and Extension Specialist, University of Minnesota
Corresponding author email address
mlw@umn.edu
Additional authors
Erin L. Cortus, Associate Professor and Extension Engineer, University of Minnesota
Nancy L. Bohl Bormann, Graduate Research Assistant, University of Minnesota
Kevin Janni, Extension Engineer, University of Minnesota
Larry Gunderson, Pesticide & Fertilizer Management, Minnesota Department of Agriculture
Tom Prather, Senior Software Developer, University of Minnesota
Kevin Silverstein, Scientific Lead RIS Informatics Analyst, University of Minnesota
This work is supported by the AFRI Foundational and Applied Science Program [grant no. 2020-67021-32465] from the USDA National Institute of Food and Agriculture. We’d also like to thank our stakeholders for their time commitment.
The authors are solely responsible for the content of these proceedings. The technical information does not necessarily reflect the official position of the sponsoring agencies or institutions represented by planning committee members, and inclusion and distribution herein does not constitute an endorsement of views expressed by the same. Printed materials included herein are not refereed publications. Citations should appear as follows. EXAMPLE: Authors. 2022. Title of presentation. Waste to Worth. Oregon, OH. April 18-22, 2022. URL of this page. Accessed on: today’s date.
While animal manure contains nutrients and organic material that are beneficial for crop production, the concentrations of those nutrients are typically too low to allow economically viable transportation of bulk manures over long distances to where crops are sometimes produced. Therefore, dairy manure tends to be applied to soils near where it is generated. Since phosphorous (P) is conserved during manure handling compared to nitrogen, P concentrations in soils where dairy manure is applied tend to exceed crop demands. Due to the implication that P runoff from agricultural operations plays an important role in the eutrophication of streams and other water bodies, farmers are experiencing increasing pressure and regulation to not apply animal manures to fields that are already overloaded with P.
A possible solution to P overloading is to remove some of the P from manure before it is applied. In testing the MAnure PHosphorus EXtraction (MAPHEX) System Church et al. (2016, 2017, 2018), found that by treating liquid dairy manure with a screw press followed by a decanter centrifuge, 38 – 60% of the P could be removed from the manures of a wide variety of farms. A benefit to this approach is that the P removed, is concentrated into a stackable solid (about 72% moisture) that can be more economically transported to distant fields where P may be in deficit. The remaining liquid and course solids, containing greater than 90% of the manure N, can be beneficially used nearer the source without loading those soils with P. A comprehensive farm-scale evaluation of manure nutrient extraction is needed which can be done using the Integrated Farm System Model (IFSM; USDA, 2022). The IFSM has been used to assess other manure handling strategies along with many farm-scale options for crop, animal and feeding management.
What Did We Do?
We evaluated the whole-farm performance, environmental effects, and potential economic benefit of extracting P from dairy manure using a decanter centrifuge (Rotz et al., 2022). A farm in Pennsylvania with distant cropland was simulated with the IFSM to evaluate the feasibility of extracting P to reduce transport requirements on-farm or to produce a concentrated P product for off-farm use. Three production systems were evaluated with and without the use of centrifuge extraction. The first was the current farm with manure collected by flushing, next was the same farm with manure collection by scraping and the last was a modified farm with scraped manure where only forage crops were produced and concentrate feeds were purchased. Collection by scraping greatly reduced the volume of manure handled by the centrifuge thus reducing operating time and electricity use. Reducing the crop land and removing grain production created an imbalance in nutrient utilization with potential accumulation of P in the farm soil. Under this constraint, use of the centrifuge provided a method for removing a portion of the manure P for export from the farm.
Farm simulations estimated all forms of nitrogen, P, and carbon losses. This included erosion of sediment and runoff of sediment-bound and dissolved P across the farm boundaries. Costs for owning and operating the manure handling systems were determined using the economic component in IFSM. All equipment and facilities were amortized over an economic life and the annualized cost was added to other operating costs to get a total. Manure handling costs included fixed and operating (repair and maintenance, fuel, and labor) costs of the rotary screen, screw presses, and centrifuge. Manure hauling was also an important cost in the assessment because the number of trucks required and hauling distance varied among systems. Hauling cost included the amortized initial cost of trucks and annual costs for truck repair and maintenance, fuel, and operator labor.
What Have We Learned?
On a large dairy farm of 2,000 cows and 3,450 acres of land where manure must be transported to distant cropland to obtain uniform distribution, P extraction with a centrifuge provided a better ratio of nitrogen and P contents in manure used on nearby cropland and reduced transport costs for nutrients applied to more distant cropland. Centrifuge extraction was found to be more practical and economical when used with manure scraped from the barn floor than with flushed manure. Use of the centrifuge was not economically justified with the flush system where large volumes of low concentration liquid manure were handled. When barn floors were scraped, the benefit received through reduced manure volume more than offset the increased costs of owning and operating the centrifuge. To avoid long-term accumulation of soil P on the farm with less land (2,000 cows and 2,720 acres) where concentrate feed (27% of total feed) was imported, centrifuge extraction provided a material with a high P concentration that could be exported from the farm for other uses. Extracting the P in excess of crop needs cost about $1.14/lb P. This was generally greater than the price of phosphate fertilizer, but the extract also included other nutrients and micronutrients of value to crops.
A centrifuge provides a useful tool for extracting and concentrating manure P, but the economic benefit to the producer depends upon the value of the full array of nutrients contained, manure handling practices, and the end use of the extracted material. Although marketing this material for its P content alone may not be economical, the material may have other value and the reduction in long-term risk of surface water eutrophication has a less well-defined economic benefit to society.
Future Plans
The IFSM provides a tool for evaluating the performance, environmental impacts and economics of beef cattle and dairy production systems. The addition of the new component for modeling manure nutrient extraction technologies provides a tool for evaluating the whole farm costs and benefits of various technologies being developed or proposed for on-farm use. These can include manure processing based upon dissolved air floatation, evaporation, ultrafiltration, and the full MAPHEX system.
Authors
Alan Rotz, Agricultural Engineer, Agricultural Research Service, USDA
Corresponding author email address
al.rotz@usda.gov
Additional authors
Michael Reiner, Support Scientist, Agricultural Research Service, USDA; Sarah Fishel, Support Scientist, Agricultural Research Service, USDA; Clinton Church, Chemist, Agricultural Research Service, USDA
Additional Information
Church, C. D., Hristov, A., Bryant, R. B., Kleinman, P. J. A., & Fishel, S. K. 2016. A novel treatment system to remove phosphorus from liquid manure. Appl. Eng. Agric. 32: 103 – 112. doi:10.13031/aea.32.10999
Church, C. D., Hristov, A., Bryant, R. B., & Kleinman, P. J. A. 2017. Processes and treatment systems for treating high phosphorus containing fluids. US Patent 10,737958.
Church, C. D., Hristov, A. N., Kleinman, P. J. A., Fishel, S. K., Reiner, M. R., & Bryant, R. B. 2018. Versatility of the MAnure PHosphorus Extraction (MAPHEX) System in removing phosphorus, odor, microbes, and alkalinity from dairy manures: A four-farm case study. Appl. Eng. Agric. 34: 567 – 572. doi: 10.13031/aea12632
Rotz, C.A., Reiner, M., Fishel, S., & Church, C. 2022. Whole farm performance of centrifuge extraction of phosphorus from dairy manure. Appl. Eng. Agric. In press.
This work was supported by the U.S. Department of Agriculture, Agricultural Research Service. USDA is an equal opportunity provider and employer. The authors thank the producer who contributed characteristics of their farm for this assessment.
The authors are solely responsible for the content of these proceedings. The technical information does not necessarily reflect the official position of the sponsoring agencies or institutions represented by planning committee members, and inclusion and distribution herein does not constitute an endorsement of views expressed by the same. Printed materials included herein are not refereed publications. Citations should appear as follows. EXAMPLE: Authors. 2022. Title of presentation. Waste to Worth. Oregon, OH. April 18-22, 2022. URL of this page. Accessed on: today’s date.
The amount of nitrogen lost to the air as ammonia following the application of manure is important for two reasons. From the farmer’s point of view, the loss of nitrogen as ammonia gas represents a loss of fertilizer that could have contributed to the production of a crop. From an environmental point of view, ammonia lost from a field to the atmosphere is a source of air pollution that can combine with sulfites and nitrates in the atmosphere to form extremely fine particulate matter (PM2.5) that can have harmful effects on human health and can contribute to water pollution when deposited into surface water by rainfall. Land application of animal manure is one of many sources of ammonia emissions that also include municipal and industrial waste treatment, use and manufacture of fertilizers, combustion of fossil fuel, coke plants and refrigeration (USEPA, 1995).
Animal manure can be used as a fertilizer substitute. However, the types of nitrogen in manure are more complicated than those found in most common chemical fertilizers. Nitrogen can be present in manure as ammonium-N, ammonia-N, organic-N, and nitrate-N. Not all the nitrogen in manure is immediately available for plant use. Most animal manure contains very little nitrate-N and as a result it is typically not measured. However, manure that receives aerobic treatment, i.e., composting or aeration, should be analyzed for nitrate-N since it is a valuable form of nitrogen that is the same as contained in one of the most common types of fertilizer – ammonium nitrate.
Most laboratories measure the total ammoniacal nitrogen content (TAN) of animal manure, which includes ammonium-N and ammonia-N (TAN = NH4+-N + NH3 -N). The amount of TAN that is in the ammonia form depends greatly on the pH of the manure. At a pH of 6.5 none of the TAN is in the ammonia form – it is all ammonium-N which is a great form of plant fertilizer. At a high pH, such as, 9.5, 65% of the TAN is in the ammonia form. Most animal manures have a pH in the range of 8 to 8.5 and about 10% most of the TAN is ammonia-N and can be lost to the air. As a result, TAN is often labeled as ammonium-N on manure analysis reports.
A key aspect of using animal manure as a fertilizer substitute is to make a good estimate of the fraction of the total nitrogen contained in the animal manure that can be used to grow a plant. This portion of the nitrogen is called the plant available nitrogen (PAN) and can be estimated using the following equation:
PAN =mf Organic-N + Af TAN + Nitrate-N.
(1)
Most of the nitrogen in untreated slurry and solid animal manure is organic nitrogen (organic-N) that must be mineralized in the soil to become available to plants as ammonium-N. The fraction of the organic-N that will be mineralized during the growing season is represented in equation 1 as the mineralization factor, mf. The value of the mineralization factor varies depending on animal species, the amount of treatment, as well as soil pH, moisture, and temperature. The values of mfrecommended are 0.70 for lagoon water and 0.50 for swine slurry (Chastain, 2006).
The fraction of TAN in manure that will be available to the plant is represented by the ammonium-N availability factor, Af. The ammonium-N availability factor (a decimal) is determined from the fraction of TAN lost to the air as ammonia-N using the following formula:
Af=1-( AL/ 100).
(2)
The amount of ammonia-N lost following application varies with the method of application, the extent and timing of incorporation in the soil by disking as well as the pH of the manure, the pH that the manure attains following application, and the air temperature. Most extension publications provide recommended values for estimating ammonia-N losses. For example, Clemson Cooperative Extension (CAMM, 2005) recommends use of an ammonia loss (AL) of 50% for broadcast of manure without incorporation. This would mean that a value of 0.5 is used for ammonium-N availability factor (Af) in equation 1. If the manure is incorporated into the soil within one day the recommended value for AL is 20% giving an Af value of 0.80.
The amount of nitrate-N contained in animal manure is often so small that it is not measured. However, manure that is exposed to enough air or that is treated aerobically will have a significant amount and measurement of the nitrate-N content is recommended. All the nitrate-N contained in manure is 100% plant available.
Various studies and reviews (Chastain, et al., 2001; Montes, 2002; Montes and Chastain, 2003; Chastain, 2006) have indicated that the amount of ammonia lost following application of animal manure varies much more than indicated by most extension recommendations (e.g., CAMM, 2005). The result of large differences between recommended estimates and actual values is either substantial over or under estimation of the amount of ammonia emissions to the air as well as over or underestimation of the amount of nitrogen that will be available for the plant. The objective of this paper is to provide practical recommendations for the ammonium-N availability factors for swine manure based on the application method, total solids content, and the time between broadcast and incorporation.
What Did We Do?
The data and the correlations used to develop the recommendations in this paper were provided by Montes (2002) and Chastain (2006). The effect of the application method on ammonia-N loss was estimated using the following equation:
AL =fA ALBC.
(3)
The application factors, fA, that correspond to an application method are given in Table 1 and ALBC was the ammonia loss for broadcast manure. The value of the ammonium-N availability factor, Af, for each application method was calculated using the definition given previously in equation 2.
How fast ammonia is lost following broadcast application of manure was determined by Montes (2002). The results indicated that ammonia-N loss following irrigation of lagoon water occurred too quickly to consider incorporation by disking. Values for broadcast and incorporation for slurry manure are given in Table 1. The results indicated that incorporation must follow broadcast of slurry manure within 8 hours if it is desired to reduce ammonia-N loss by 50% (fA=0.50).
Table 1. Application method factors to describe the reduction in ammonia loss as compared to broadcast application of manure. (Values based on reviews of the literature by Chastain et al., 2001 and Montes, 2002).
Application Method
fA
What type of manure can use this method?
Broadcast without incorporation
1.0
All
Broadcast followed by incorporation within 4 hoursA
0.29
Slurry
Broadcast followed by incorporation within 6 hoursA
0.40
Slurry
Broadcast followed by incorporation within 8 hoursA
0.50
Slurry
Broadcast followed by incorporation within 12 hoursA
0.64
Slurry
Band spreading (drop or trailing hose)
0.50
Liquid and Slurry
Band spreading with immediate shallow soil cover
0.12
Liquid and Slurry
Shallow injection (2 to inches below soil surface)
0.10
Liquid and Slurry
Deep injection (4 to 6 inches below soil surface)
0.08
Liquid and Slurry
AfA calculated using K = 0.086 h-1 (Chastain, 2006)
A few studies indicated that application of manure to bare soil versus cut hay, or plant residue reduced ammonia-N loss following broadcast by 10% to 20% (see Montes, 2002 and Chastain, 2006). However, it was decided that there was not sufficient data to generalize the result for practical use.
What Have We Learned?
The model was applied to as wide a range of swine manure application situations as possible. The results were tabulated as ammonium-N availability factors, Af, that may be used in the PAN equation (equation 1) along with an estimate for the mineralization factor.
Variation in Ammonium-N Availability by Application Method
The impact of application method on the ammonium-N availability factor for swine manure is shown in Table 2. Application method had the least impact on irrigation of surface water from an anaerobic treatment lagoon. The value of Af was 0.98 for irrigated swine lagoon water. This corresponded to an ammonia-N loss of 2% (AL = (1-Af) x 100). The amount of ammonia-N lost was low since more than 0.25 inches of lagoon water was applied, and most of the ammonium-N was washed into the soil. However, the ammonium-N availability factors for broadcast of manure decreased sharply as the total solids content of swine manure increased. This corresponded to ammonia-N loss ranging from 8% for liquid manure (TS = 1% to 4%) to 58% for thick slurry (TS = 15% to 20%). It can also be seen in the table that all the ammonium-N conserving application methods increased in effectiveness as the TS content of swine manure increased.
Table 2. Variation in ammonium nitrogen availability factors, Af, for swine manure and treatment lagoon surface water based on application method. (AL = (1 – Af) x 100)
Description
Broadcast or Large Bore Irrigation
Broadcast followed by incorporation within 6 hours
Comparison of the Use of New Ammonium-N Availability Factors and Current Clemson Extension Recommendations for Broadcast Application of Swine Manure
Selection of the ammonium-N availability factor (Af) and mineralization factor (mf) for a manure type and application method has a large effect on the accuracy of the estimate of nitrogen that can be used to fertilize a crop as well as the estimate of ammonia-N lost to the air. The PAN estimate determines the amount of manure applied per acre (gal/ac) and the amount of P2O5 and K2O that are applied (lb/ac). The impact of using constant values of Afand mf that are different from values that more closely match the data was studied by comparing the results for spreading lagoon water (TS = 0.5%) and slurry (TS = 7.5%) to meet a target application rate of 100 lb PAN/ac. The results are provided in Table 3. The impact of settling and biological treatment in the lagoon was indicated by the low TS content (TS=0.5%) and the fact that the lagoon water contained two pounds of TAN for every pound of organic-N. Swine slurry (TS = 7.5%) contained 1.2 pounds of TAN per pound of organic-N.
Comparison of the estimates using Clemson Extensions current recommendations with the results provided in this paper led to the following observations.
Using the new Af and mf values that varied by manure type (lagoon water vs slurry) provided higher PAN estimates than the Clemson Extension recommendations.
The higher PAN estimates resulted in reductions in the amount of manure needed to provide 100 lb PAN/ac.
The amount of ammonia-N lost per acre per 100 lb PAN applied was much lower using the new factors for estimating PAN as compared to using Clemson Extension values for lagoon water and swine slurry. Using Clemson Extension values over-estimated the ammonia-N loss/ac by 133% to 1133%.
The inaccuracies in PAN estimates for lagoon water and slurry manure also impacted plant nutrient application rates. Using the PAN estimates based on Clemson Extension recommendations to determine manure application rates resulted in over application of nitrogen by 17% to 21%. Similar over-applications were observed for P2O5 and K2 Therefore, better estimates of PAN can help to reduce excessive applications of phosphorous and provide better estimates of potash (K2O) application rates.
Comparison of the estimates of the ammonia-N lost per acre following broadcast of manure for the examples shown in Table 4 demonstrates the need to consider using values of Af and mf that more closely agree with the available data.
It must be emphasized that slurry manure with a higher TS content than 7.5% and heavily bedded manure were not included in the examples in this paper. The ammonia-N loss values will be higher and must be calculated using the Afvalues provided in this paper along with the corresponding manure analysis to yield valid conclusions.
Impact of Selected Ammonium-N Conserving Application Methods on Ammonia-N Loss per Acre, and P2O5 Application Rate
The impact of application method on the estimates of PAN, ammonia-N loss, and phosphorous application rates was calculated for swine slurry using the tabulated values for the ammonium-N availability factors given in Table 2. Lagoon water was not included because irrigation is the most common and cost-effective method of application, and the amount of ammonia-N lost to the air was the least. The application methods that were compared were broadcast, broadcast followed by incorporation within 6 hours, band spreading, band spreading with shallow soil cover, and shallow injection. Results for deep injection were not included because the improvements were very small compared with shallow injection (see Table 2). Furthermore, the horsepower and fuel costs of deep injection are higher than for shallow injection. The results are given in Table 4.
The results indicated that broadcast with incorporation within 6 hours provided a reduction in ammonia-N loss per acre of 65% and a reduction in the P2O5 application rate of 11%. Band spreading provided almost the same benefits (57% reduction in ammonia-N loss and 10% reduction in lb P2O5/ac) but would be achieved with only one pass across a field. Adding a method to immediately cover a band of manure with soil provided reductions in ammonia-N loss of 90% and reduction of the P2O5 application rate by 16%. Shallow injection provided a modest improvement in ammonia-N emissions (93%) as compared to band spreading with shallow cover. Shallow injection also provided about the same benefit in reduction of phosphorous application rate as band spreading with shallow cover.
Table 3. Comparison of land application rate and ammonia-N loss estimates using tabulated model results and current Clemson University Extension recommendations for broadcast application of swine lagoon surface water and slurry manure. Target nutrient application rate = 100 lb PAN/ac.
Swine
Lagoon Water
Slurry
TS, %
0.5
7.5
TAN, lb/1000 gal
4.3
23.0
Org-N, lb/1000 gal
2.0
19.0
P2O5, lb/1000 gal
3.6
33.0
K2O, lb/1000 gal
7.9
28.0
Land Application Rates and Ammonia-N Loss Estimates Using Clemson Extension Recommendations
Mineralization factor, mf
0.60
0.60
Ammonium-N availability factor, Af
0.80
0.50
PAN estimate, lb PAN/1000 gal
4.6
22.9
Application rate to provide 100 lb PAN/ac, gal/ac
21,552
4,367
Resulting application rate for P2O5, lb/ac
78
144
Resulting application rate for K2O
170
122
Ammonia-N Loss, lb per acre / 100 lb PAN
18.5
50.2
Land Application Rates and Ammonia-N Loss Estimates Using New Recommendations
Mineralization factor, mf
0.70
0.50
Ammonium-N availability factor, Af
0.98
0.75
PAN estimate, lb PAN/1000 gal
5.6
26.8
Application rate to provide 100 lb PAN/ac, gal/ac
17,813
3,738
Resulting application rate for P2O5, lb/ac
64
123
Resulting application rate for K2O
141
105
Ammonia-N Loss, lb per acre / 100 lb PAN
1.5
21.5
Key Impacts of Inaccurate Estimates of Af, and PAN
Over-estimation of Ammonia-N Loss/ac
1133%
133%
Actual PAN Application Rates Using Clemson Extension Recommendations to Determine Manure Application Rate, lb PAN/ac and percent over-application of PAN (%)
121
(21%)
117
(17%)
Difference in Application of P2O5, lb/ac (%)
14
(22%)
21
(17%)
Difference in Application of K2O, lb/ac (%)
29
(21%)
17
(14%)
Table 4. Impact of Application Method on Ammonia-N Loss and P2O5 Application Rate for Swine Slurry. The total solids and plant nutrient contents were given previously in Table 3 and the mineralization factor was 0.50 for all application methods.
Swine
Slurry, TS = 7.5%
Broadcast – no incorporation
Mineralization factor, mf
0.50
Ammonium-N availability factor, Af
0.75
PAN estimate, lb PAN/1000 gal
26.8
Application rate to provide 100 lb PAN/ac, gal /ac
3,738
Resulting application rate for P2O5, lb/ac
123
Ammonia-N Loss, lb per acre / 100 lb PAN
21.5
Broadcast – incorporation within 6 hours
Ammonium-N availability factor, Af
0.90
PAN estimate, lb PAN/1000 gal
30.2
Application rate to provide 100 lb PAN/ac, gal /ac
3,311
Resulting application rate for P2O5, lb/ac
109
Ammonia-N Loss, lb per acre / 100 lb PAN
7.6
Reduction in Ammonia-N loss Compared to Broadcast
65%
Reduction in P2O5 Application Rate
11%
Band Spreading
Ammonium-N availability factor, Af
0.88
PAN estimate, lb PAN/1000 gal
29.7
Application rate to provide 100 lb PAN/ac, gal /ac
3,362
Resulting application rate for P2O5, lb/ac
111
Ammonia-N Loss, lb per acre / 100 lb PAN
9.3
Reduction in Ammonia-N loss Compared to Broadcast
57%
Reduction in P2O5 Application Rate
10%
Band Spreading with Shallow Cover
Ammonium-N availability factor, Af
0.97
PAN estimate, lb PAN/1000 gal
31.8
Application rate to provide 100 lb PAN/ac, gal /ac
3,144
Resulting application rate for P2O5, lb/ac
104
Ammonia-N Loss, lb per acre / 100 lb PAN
2.2
Reduction in Ammonia-N loss Compared to Broadcast
90%
Reduction in P2O5 Application Rate
16%
Shallow Injection
Ammonium-N availability factor, Af
0.98
PAN estimate, lb PAN/1000 gal
32.0
Application rate to provide 100 lb PAN/ac, gal /ac
3,121
Resulting application rate for P2O5, lb/ac
103
Ammonia-N Loss, lb per acre / 100 lb PAN
1.4
Reduction in Ammonia-N loss Compared to Broadcast
93%
Reduction in P2O5 Application Rate
17%
Future Plans
The model results provided in this paper are currently being used to develop extension programs and will be used to update extension publications and recommendations for producers. It is hoped that these tabulated ammonium-N availability factors will be used to increase the precision of using swine manure as a fertilizer substitute and making better estimates of ammonia-N emissions.
Author
John P. Chastain, Professor and Extension Agricultural Engineer, Agricultural Sciences Department, Clemson University
Chastain, J.P. 2006. A Model to Estimate Ammonia Loss Following Application of Animal Manure, ASABE Paper No. 064053. St. Joseph, Mich.: ASABE.
Chastain, J. P., J. J. Camberato, and J. E. Albrecht. 2001. Nutrient Content of Livestock and Poultry Manure. Clemson, SC.: Clemson University.
Montes, F. 2002. Ammonia volatilization resulting from application of liquid swine manure and turkey litter in commercial pine plantations. MS Thesis, Clemson, SC.: Clemson University.
Montes, F., and J.P. Chastain. 2003. Ammonia Volatilization Losses Following Irrigation of Liquid Swine Manure in Commercial Pine Plantations. In Animal, Agricultural and Food Processing Wastes IX: Proceedings of the Nineth International Symposium, 620-628. R.T. Burnes, ed. St. Joseph, Mich.: ASABE.
USEPA. 1995. Control and Pollution Prevention Options for Ammonia Emissions (EPA-456/R-95-002), report prepared by J. Phillips, U.S. Environmental Protection Agency, Control Technology Center. Research Triangle Park, NC. Available at https://www.epa.gov/sites/default/files/2020-08/documents/ammoniaemissions.pdf.
The authors are solely responsible for the content of these proceedings. The technical information does not necessarily reflect the official position of the sponsoring agencies or institutions represented by planning committee members, and inclusion and distribution herein does not constitute an endorsement of views expressed by the same. Printed materials included herein are not refereed publications. Citations should appear as follows. EXAMPLE: Authors. 2022. Title of presentation. Waste to Worth. Oregon, OH. April 18-22, 2022. URL of this page. Accessed on: today’s date.
Co-digestion of organic material with dairy manure represents an opportunity to provide both a revenue stream to anaerobic digester operations, through the collection of a tipping fee and/or increased biogas/electricity production, as well as a means for waste generators to dispose of their product in a beneficial way.
However, there are many factors for an operator to consider when deciding on whether to accept organic waste. A major consideration is the volume of biogas that the material will generate when co-digested. This can be used both to assign a value to the waste through increased biogas production and/or electricity sales, as well as to size equipment for producing, treating and potentially selling/using the biogas. Estimating the biogas produced is a complicated process, encompassing many different factors of digester design, waste characteristics, and environmental factors.
To assist in this estimation, we have developed software that allows a user to predict the biogas production from mixed wastes and dairy manure based on changing herd sizes, as well as providing the ability to vary the timing and volume of addition of multiple organic wastes, throughout the course of a simulated year. With this user-friendly tool, we hope to enable producers to better explore the opportunities that co-digestion offers.
What Did We Do?
The originally developed Cornell Anaerobic Digester Simulations software allowed the user to input a herd size and to select how much (if any) of seven wastes would be co-digested with the dairy manure. This rudimentary method of simulation assumed that the same volume/mass would be applied to the digester in a steady-state constant fashion for the entire year that the simulations were run for. However, that is unlikely to be the case in a real-world production environment.
In the new version of the software, we have incorporated the characteristics of over 200 wastes into a user selectable interface. Once a waste type is selected, the user has the option to select when the waste is placed into the digester, whether that be on an everyday, weekly, monthly or custom basis with the option to select to which months of the year the additions occur. When selecting a weekly or monthly basis, the user can select which day(s) of the week or month wastes are added, and in the custom basis, the user can select which days of the year additions occur.
Once the timing of addition is completed, the user can select how much of the waste is applied during each addition. Whether that be a constant volume for each addition, or a custom volume for each addition.
The data for the specific wastes includes the dry matter and organic matter content as well as the biogas and methane yields. Based on the type of waste we have also assigned a “digestibility” curve to the particular waste which when assuming a first order kinetic model of gas production, can provide the production of gas a function of time. The production of biogas from all added wastes and the added manure is then summed for each day of the year to provide an estimate of the biogas production, on a daily basis, that can be summarized with a minimum/maximum/average on a monthly and annual basis.
What Have We Learned?
During the process of developing the software, we examined a few different techniques for estimating the timing of biogas production from co-digested wastes. There are more complicated models available such as Anaerobic Digestion Model #1 (ADM1), however many more parameters must be known/estimated for each waste type, (not to mention requiring a much more complicated user interface). We felt that using a simplified first order kinetic model provides a good way to add the necessary complexity to model biogas production over time without overly complicated calculations. The simplification allowed us to include a more complicated and yet more real world means of modeling the addition of wastes to a digester that wouldn’t be possible with more complicated digestion/biogas production models.
Future Plans
Currently, the Cornell Dairy Anaerobic Digestion Simulation Software is capable of predicting the amount of heat necessary to maintain digester temperatures, as well as the parasitic electrical load. Future additions will include modeling the energy usage (and effects on biogas) of treatment processes to produce Renewable Natural Gas (RNG) from biogas.
We would also like to include the ability to track nutrients through the process of digestion. Nutrient additions from the co-digestion of wastes also represent an important consideration for farm as they may or may not have the land base/crop requirements to use all of the imported nutrients. The cost of treatment of the effluent from the digester to remove nutrients, or the shipment of effluent off site may have to be added into the determination of how much of a “tipping fee” a farmer would need to charge for taking an organic waste for co-digestion.
We hope to make the program freely available to the public to use. Currently, the software is written in MATLAB which ordinarily requires a license to operate, however it is possible to create an executable standalone program that can be shared and run without the need to purchase MATLAB.
Authors
Timothy Shelford, Extension Associate, School of Integrated Plant Science, Cornell University
Corresponding author email address
tjs47@cornell.edu
Additional authors
Curt Gooch, Senior Extension Associate Emeritus, Department of Biological and Environmental Engineering, Cornell University
Peter Wright, Agricultural Engineer, Department of Animal Science, Cornell University
Lauren Ray, Agricultural Energy Systems Engineer, Cornell University
The authors are solely responsible for the content of these proceedings. The technical information does not necessarily reflect the official position of the sponsoring agencies or institutions represented by planning committee members, and inclusion and distribution herein does not constitute an endorsement of views expressed by the same. Printed materials included herein are not refereed publications. Citations should appear as follows. EXAMPLE: Authors. 2022. Title of presentation. Waste to Worth. Oregon, OH. April 18-22, 2022. URL of this page. Accessed on: today’s date.
Improvements in manure treatment/nutrient management are an important need for dairy farms to move substantively towards sustainability. This project quantifies several individual manure treatment components and component assemblies targeted to address farm/environment needs. Project outcomes should help dairy farms to make better-informed decisions about manure/nutrient management systems.
Societal demand for farms to reduce their environmental impact is driving the need for improved and cost-effective manure/nutrient management options. Dairy farms may need advanced manure treatment systems to be economically, environmentally, and societally sustainable.
What Did We Do?
Specific treatments being evaluated include anaerobic digestion, active composting, sequencing batch reactors, solid-liquid separation systems including, screw press separation, dissolved air floatation, centrifuging, and solid treatment systems including bedding recovery units and pelletization. We are working with a farm that has an anaerobic digester and screw press separators. They have been planning to install a Dissolved Air Flotation (DAF) system. The farm was approached with an in-vessel composting technology “active composting” to determine if it could effectively convert portions of the digested separated liquid flow to a stabilized solid that could be pelletized and exported, while the liquids could be further treated to become dilute enough to be spray irrigated on a limited acreage.
What Have We Learned?
We learned that although the active composting process was able to quickly produce stabilized high solid content material from a variety of mixes of digested separated liquid and dried shavings, the energy needed ranged from $9 to $14 per cow per day. Through volume/time calculations, the pumping system from the reception pit to the digester and the post digestion pit to the separators varied although the % solids were consistent. Doppler flow meters purported to be able to measure manure did not give consistent volume results. Screw press solid liquid separation can result in a bedding product with relatively low moisture (60%) from anaerobically digested dairy manure. Determining an optimum manure treatment system for dairy manure will be difficult given the variability from farm to farm.
Future Plans
Specific treatments yet to be evaluated include: anaerobic sequencing batch reactors, solid liquid separation systems including dissolved air floatation (DAF), centrifuging, and solid treatment systems including bedding recovery units (BRU) and pelletization. Covid supply chain issues and travel restrictions have slowed progress. The DAF system can be directly analyzed as it is installed on the dairy. A neighboring farm has a BRU that will be sampled and analyzed. Data from a centrifuge and pelletizer will be obtained from the literature. Putting the process in a treatment train will be explored on a spreadsheet.
Authors
Peter Wright, Agricultural Engineer, PRO-DAIRY, Cornell University
Publications: Peter Wright, Karl Czymmek, and Tim Terry “Food waste coming to your farm? Consider where the nutrients go and manure processing for nutrient export” PRO-DAIRY The Manager, contained in Progressive Dairy Vol. 35 No. 5 March 12, 2021
Acknowledgements
This work was supported by a joint research and extension program funded by the Cornell University Agricultural Experiment Station (Hatch funds) and Cornell Cooperative Extension (Smith Lever funds) received from the National Institutes for Food and Agriculture (NIFA,) U.S. Department of Agriculture. Any opinions, findings, conclusions, or recommendations expressed in this publication are those of the author(s) and do not necessarily reflect the view of the U.S. Department of Agriculture. New York State Pollution Prevention Institute (NYSP2I) at the Golisano Institute for Sustainability (GIS) paid for the sampling that was funded by a grant to RIT from by the Environmental Protection Fund as administered by the NYS Department of Environmental Conservation.
The authors are solely responsible for the content of these proceedings. The technical information does not necessarily reflect the official position of the sponsoring agencies or institutions represented by planning committee members, and inclusion and distribution herein does not constitute an endorsement of views expressed by the same. Printed materials included herein are not refereed publications. Citations should appear as follows. EXAMPLE: Authors. 2022. Title of presentation. Waste to Worth. Oregon, OH. April 18-22, 2022. URL of this page. Accessed on: today’s date.
The objectives of the litter amendment research were to determine why alum applications to poultry litter occasionally fail to reduce soluble phosphorus (P) and to determine if aluminum-, calcium- or iron- based nanoparticles would reduce soluble P in litter when applied alone or in combination with conventional litter treatments used for ammonia control, such as alum and/or sodium bisulfate.
The objective of the scrubber research was to design a scrubber that reduces ammonia, dust, and pathogens in the air inside of animal rearing facilities, like broiler houses, rather than the air being exhausted from the facilities. Currently scrubbers are “end of pipe” technology, which purify the exhaust air, so the only economic benefit is the capture of nitrogen, which is relatively inexpensive. Reducing the ammonia, dust, and pathogens in the air inside poultry houses should result in production benefits, such as those found with litter amendments (improved weight gains, better feed conversion, lower susceptibility to disease, and reduced propane use).
What Did We Do?
A series of laboratory studies were conducted with various litter amendments. The first study was conducted using litter from a commercial broiler house that had been treated with sodium bisulfate ten times over a two year period. Poultry litter (20 grams) was weighed out into 6 centrifuge tubes and half of the litter samples were treated with alum at a rate of 5% by weight. The tubes were incubated in the dark for one week, then extracted with 200 ml deionized water for one hour, centrifuged for 15 minutes at 8,000 rpm, filtered through 0.45 um filter paper and analyzed for soluble reactive phosphorus (SRP) using the Murphy-Riley method on an autoanalyzer.
The next four lab studies used the same basic incubation studies, although the litter that was used came from a pen trial we had conducted where we knew the litter had never been treated with sodium bisulfate. Eighty six different treatment combinations involving conventional ammonia control treatments, such as alum and sodium bisulfate with or without the addition of different types of nanoparticles were used. The nanoparticles used in this study were: (1) Al-nano – an aluminum based nanoparticle, (2) Fe-nano – an iron based nanoparticle, (3) MNP – a nanoparticle made of both aluminum and iron, and (4) TPX – a calcium silicate based nanoparticle made by N-Clear, Inc. The sodium bisulfate that was utilized is sold under the tradename PLT (Poultry Litter Treatment) by Jones-Hamilton, Inc.
We also redesigned the ARS Air Scrubber so that it is scrubbing the air inside poultry houses rather than the exhaust air. The critical design feature to allow this was the use of fast sand filters to remove all particulates from the water and acid used to scrub dust and ammonia, respectively.
What Have We Learned?
We found that alum failed to lower soluble P in poultry litter when the litter had been treated with sodium bisulfate, probably due to the formation of sodium alunite [NaAl3(OH)6(SO4)2], a mineral often found in acid soils where sulfate applications have occurred. The formation of this mineral likely inactivates the Al with respect to P adsorption or precipitation reactions.
We also found that a Ca-based nanoparticle (TPX) was very effective in reducing soluble P in litter, either when applied in combination with alum or sodium bisulfate. Surprisingly, when TPX was applied with sodium bisulfate at very low levels, the soluble P levels of sodium bisulfate-treated litter decreased from 3,410 mg P/kg (when added alone) to 1,220, 541, and 233 mg P/kg litter, respectively, when 0.25, 0.5, and 1% TPX was added with sodium bisulfate.
Future Plans
We are currently conducting a large pen trial to determine the effect of TPX nanoparticles applied with alum or sodium bisulfate on ammonia emissions, soluble P, and P runoff from small plots using rainfall simulators.
We are also building a full-scale prototype of the indoor ammonia scrubber so that we can begin to test the efficacy of this scrubber.
Author
Philip A. Moore, Jr., Soil Scientist, USDA/ARS, Fayetteville, AR
Philip.Moore@USDA.Gov
Additional Information
Moore, P.A., Jr. 2021. Composition and method for reducing ammonia and soluble phosphorus in runoff and leaching from animal manure. U.S. Patent Application No. 17/171,204. Patent pending.
Moore, P.A., Jr. 2022. A system for removing ammonia, dust and pathogens from air within an animal rearing/sheltering facility. U.S. Patent Application No. 17/715,666. Patent pending.
The authors are solely responsible for the content of these proceedings. The technical information does not necessarily reflect the official position of the sponsoring agencies or institutions represented by planning committee members, and inclusion and distribution herein does not constitute an endorsement of views expressed by the same. Printed materials included herein are not refereed publications. Citations should appear as follows. EXAMPLE: Authors. 2022. Title of presentation. Waste to Worth. Oregon, OH. April 18-22, 2022. URL of this page. Accessed on: today’s date.
Nutrient recycling is fundamental to agricultural systems (Spiegal et al., 2020). Integration of animal and crop production represents an example of the application of a circular economy to manage nitrogen (N), phosphorus (P), and other nutrients (Figure 1) important to crop and livestock production. An integrated system recycles these critical nutrients from animal feed to manure to soils and back to animal feed. Nutrient additions to the farm, like animals, feed, and fertilizer (input arrow), are necessary to offset the nutrients leaving the farm in animal protein products (output arrow), as well as other nutrient losses in the system (Cela et al., 2014). The efficiency of this nutrient recycling process has both environmental and economic sustainability implications.
Figure 1. Recycling of nutrients is critical to an environmentally sound agricultural “circular economy”.
For many regions of the United States, such as the Corn Belt, animal agriculture remains in relatively close proximity to sufficient crop production to allow agronomic recycling of nitrogen and phosphorus (Gollehon et al., 2001, 2016). However, the sources of manure nutrients (livestock and poultry operations) and the consumers of nutrients (cropland) are often managed as independent businesses. In other regions, separation of feed and animal production by distance and business boundaries creates significant challenges for agronomic nutrient recycling (Spiegal et al., 2020).
The willingness of crop farmers to accept manure as part of their fertility program is dependent upon their perceptions of the benefits and challenges associated with using manure. Likewise, behaviors among farmers and agricultural advisors of information-seeking – “purposive acquisition of information from selected information carriers” (Johnson 1996) – must be considered as a precursor to content delivery. Thus, in early 2020, a faculty team from University of Nebraska, University of Minnesota, and Iowa State University collaborated to implement a survey of farmers and their advisors to guide multi-state outreach programming by identifying:
-Challenges that regularly prevent manure’s use in crop production and
-Perceptions of manure’s benefits that may encourage manure transfers from livestock farmers to crop producers.
What Did We Do
A draft survey was tested with three groups (a stakeholder advisory group, the national Livestock and Poultry Environmental Learning Community, and the Nebraska Animal Manure Management team) leading to the final product. The survey was delivered electronically through QualtricsXM survey application tool using a University of Nebraska-Lincoln licensed product. The survey included questions for the participants on the following subjects of interest:
1. Participant’s role in manure decision making.
2. Perceptions and knowledge of manure’s benefits. Participants were asked to rate the degree to which they considered manure to be harmful or beneficial for crop fertility, soil physical characteristics, soil biological characteristics, crop yields, and environmental quality.
3. Perceptions and knowledge of manure’s challenges. Participants were presented with a list of potential barriers which might prevent manure use in crop fertility programs and asked to identify which factors were barriers for their operations, or for their advisees.
4. The types of supporting resources which would be of most value for the participants’ decision making or advising on manure benefits and barriers.
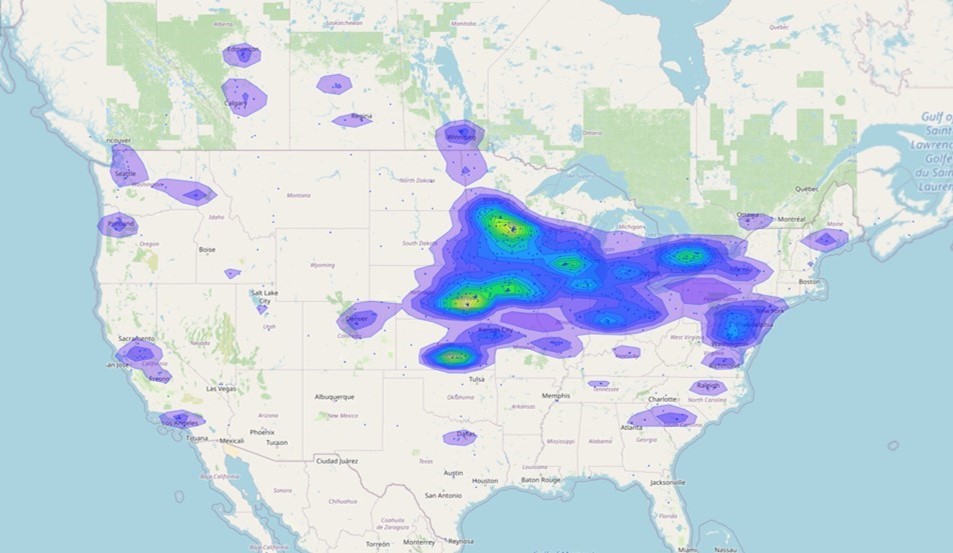
Surveyed Participants
Responses were received from 793 individuals across the U.S. and Canada. The results are heavily weighted towards participants from the Corn Belt and the High Plains regions of the U.S. (44% and 23% of respondents, respectively). Survey participants were 87% male and 13% female. Participants’ experience were reported as 29% with less than 10 years, 22% with 11 to 20 years, and 49% with 21 years or more. Participants self-identified as a crop farmer (13%), animal feeding operation (AFO) (7%), professional advisor for crop fertility or manure management decisions (60%), or some combination of these three roles (20%). Crop farmers indicated that they were an annual user of manure (73%), user of manure within the past 3 years (9%), or user of manure within past 4 to 6 years (9%). Only 10% were not users of manure. Those identifying as advisors suggested that manure management is a primary focus of crop fertility advising (20%), frequent part of crop fertility advising (39%), or an occasional part of a crop fertility advising (36%). Only 4% of advisor responses indicated they did not include manure in their advising.
Figure 1. Region of US and Canada represented by survey participants (N= 793).
A series of five questions were presented to identify real or perceived challenges among respondents that represent potential barriers to using manure in crop fertility programs. Lists of agronomic, economic, neighbor or rural community, regulatory, and logistical challenges were presented based on outcomes of the project team’s advisory group discussions and reviews of previous surveys (Battel and Krueger, 2005; Case et al., 2017; Herrero et al., 2018; Poe et al., 2001). Lastly, respondents were asked to identify the types of supporting resources preferred for information-seeking on manure use in cropping systems.
What Have We Learned
Perceptions and Knowledge of Manure Benefits. Both private sector advisors and crop farmers shared similar positive impressions of manure’s benefits for crop fertility, yield, and soil characteristics while being less positive regarding their impressions of how manure impacts environmental quality. Crop farmers and private sector advisors recognize the complementary role of manure and fertilizer in a fertility program at 74% and 76% frequency, and at slightly higher rates than all survey responses (71%). The complementary role of manure and fertilizer was also similar across regions (Corn Belt – 70%; High Plains-69%; all other regions – 74%).
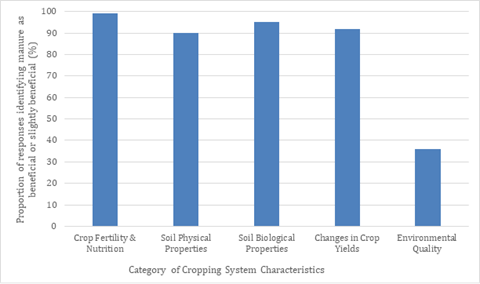
Figure 2. Perspectives of manure’s beneficial versus harmful impacts on five crop production and natural resource topics as identified by primary decision makers in crop fertility programs.
The only audience factors that significantly (p<0.05) influenced participant attitudes toward manure benefits were that participants living in the corn belt were less likely to describe manure as beneficial or slightly beneficial for environmental quality (30%, compared to 46% for high plains, and 35% for all other regions). Similarly, we found that private sector advisors were significantly (p<0.05) less likely to describe manure as beneficial to environmental quality (27%, compared with 58%, 53%, and 30% for livestock producers, crop producers, or public sector advisors respectively). No statistical differences were observed for an influence of audience factors on attitudes towards manure benefits to any of the other characteristics of cropping system benefits (crop yield, soil physical properties, soil biological properties, and crop fertility). However, across all audience sectors participants were unlikely to indicate that they thought manure could be beneficial or slightly beneficial for environmental quality (Figure 2). This data suggests that respondents do not associate improved soil physical and biological characteristics with reduced risk for nutrient transport via runoff, erosion, and leaching. Manure and inorganic fertilizer were perceived as complementary to each other by 71% of respondents, while only 17% believed these two products compete.
Figure 2. Proportion of total respondents who described manure as beneficial or slightly beneficial for different categories of cropping system characteristics. (n=793)
Barriers to Manure Use. As with perceptions of benefits of manure use, audience factors had little effect on the perceived barriers to manure use. There was an observed tendency for more advisors to include most factors as barriers to manure use; however, this tendency was only significant (p<0.05) for six potential barriers: compaction, cost of manure transportation, odors, risks posed by manure application to food crops, accessibility of custom applicators, and use of public roads (Table 1). The overall ranking of barriers to manure use can be found in Table 2. Cost of transportation (68%), odor (58%), timeliness of nutrient availability (55%), concerns related to the field conditions for manure application (50%), and access to labor for manure application (48%) were most frequently indicated as barriers for manure use. Interestingly, several of these factors correspond to those where a difference in the level of concern was observed between advisors and producers (Table 1). However, when considering barrier ranking by agronomic role, 4 of the top 5 barriers are similar between farmers and advisors (cost of transportation, odor, timeliness, and labor availability). Farmers rate concerns with weed seeds as a top 5 barrier, while advisors do not, leaving concerns with field conditions for application as the 6th most selected by crop farmers. This similarity of ranking, even where statistical differences exist, indicates that there is agreement on what are the most significant barriers, but some difference in the perceived seriousness or scale of the barrier. In general, crop farmers less frequently indicated factors as barriers to manure use than did advisors.
Table 1: The frequency survey responses identified selected barriers for manure use. Letters indicated statistical differences in how participants with different roles in agronomic decisions perceived barriers of interest at the alpha = 0.05 level.
Comparison by Role in Agronomic Decisions
Animal Feeding Operator (n=66)
Crop Farmer (n=120)
Private Sector Advisor (n=311)
Public Sector Advisors (n=196)
Compaction from application
36%a
41%a
59%b
40%a
Cost of manure application
55%a
67%ab
84%bc
85%c
Odors an air quality impairment
44%a
56%ab
75%bc
79%c
Manure application to food crop
15%ab
13%a
20%bc
22%c
Accessibility of custom applicators
20%a
19%ab
40%b
3%ab
Use of or crossing of public roads
15%a
11%a
21%b
13%a
Table 2: The frequency all survey responses identified specific factors as barriers for manure use (n=793)
Potential Barrier
% Who perceived as a barrier
Potential Barrier
% Who perceived as a barrier
Potential barrier
% Who perceived as a barrier
Transport
68%
Water Quality
35%
$ of Manure
25%
Odor
58%
Interference with Reduced Tillage
34%
Accessibility
25%
Timeliness
55%
Neighbor Concerns
34%
Legal Issues
25%
Field Conditions
50%
Equipment $
34%
Flies
20%
Labor
48%
Regulation $
32%
Interference with Specialty Crops
19%
Low or Inaccessible Nutrients
47%
Traffic
31%
Risks to Food Crop
15%
Low or Inaccessible Nutrients
47%
Traffic
31%
Risks to Food Crop
15%
Compaction
44%
Planning & Zoning
31%
Road Access
14%
Imbalanced Nutrients
44%
Harm to Local Infrastructure
28%
Foreign Materials
9%
Uniformity
38%
Stockpiles
28%
Reduced Yield
5%
Setbacks
37%
Presence of Applicators
27%
Harmful to Soil
3%
Weed Seeds
37%
Pollution
27%
Preferred Sources of Educational Materials. Among three broad groups of respondents (farmers, advisors, and educators), all identified their peers as an important source of information. Brief factsheets or news articles are identified by educators as their top resource they would use (81% of educator responses and 65% of advisor responses). Recommended research articles also ranked high among all three groups. At this point in time, social media (short videos, podcasts, and Twitter and Facebook) is a preferred resource for a smaller portion of these audiences (26% or farmers, 15% of advisors, and 47% by educators).
Table 3. Most valued resources for agronomic decision making
Resource Type
Farmer (n=197)
Advisor (n=438)
Educator (n=95)
Recommended research articles
49%
53%
55%
Brief fact sheet or news articles summarizing current science
52%
65%
81%
Decision support tool
34%
39%
43%
Short videos or podcasts summarizing current science
20%
12%
36%
Scripted visuals and text for your use on Twitter, Facebook, other
6%
3%
11%
Network of farmers (or advisors or educators) with whom you interact and share experiences
62%
61%
62%
Scripted PowerPoint presentation for use in educational programs
—
—
38%
Future Plans
The intent of this survey was to help our project team and others better understand the characteristics of animal manures that are considered beneficial and barriers to future manure use. Recognition of these benefits and hurdles will be critical as the need to transfer manure nutrients from existing animal feeding operations to crop farms, many with limited previous history of using manure, expands. Matching educational and technical services to the perceptions that impede manure transfer will be necessary.
Future outreach programming should be designed to:
Continue to build general awareness of the agronomic and yield benefits of manure.
Focus on assisting AFO managers and advisors with communication of specific messages such as 1) desirable rates/plans to best meet crop N and P needs, 2) field-by-field estimation of manure’s fertilizer replacement value and nutrients contributing the greatest value, and 3) complementary manure and fertilizer recommendations for optimum yields.
Focus on connecting improved soil health with improved water quality.
Help farmers articulate among themselves and to their rural communities the water quality benefits of organic fertilizers when applied to meet agronomic needs of the crop.
Challenges associated with manure that frequently become barriers to manure use should be addressed through research and outreach. Specifically, the authors wish to suggest that four challenges are commonly regarded as significant barriers to manure use and require focus to overcome:
Transportation Costs: Businesses providing manure hauling and land application services will be important when transferring manure to fields more distant from manure sources, and educational experiences addressing the current costs of transporting manure and the comparative economic benefit achieved by individual fields will be important.
Odor: A farmers’ desire to be a good neighbor is counter to their willingness to create odors for their neighbors. Farmer and advisor education and planning for reducing odor risks is critical. Technology options to forecast, assess, and address potential nuisance odors may help alleviate odor concerns resulting from manure application.
Logistical Barriers: Three logistical issues ranking highest include 1) timeliness of manure application; 2) time/labor availability; and 3) field conditions restricting manure application. Business services for transporting and land applying manure as well as manure brokering services can address many logistical challenges. Alternative application time windows, such as side dressing a crop with manure, will also be valuable.
Agronomic Issues: Manure application comes with a history of agronomic concerns such as compaction, poor uniformity, and potential for weed seed and herbicide resistance concerns. Many issues are likely to be regionally and manure source specific, thus the need to adapt agronomic education to local needs. Education and business services that encourage technologies such as precision manure application and related technologies, designer manures, and manure treatment may have value based upon regional needs. A 4Rs strategy (right rate, source, time, and place) for manure, similar to what is being promoted in the fertilizer industry, may be beneficial.
Authors
Amy Millmier Schmidt, Associate Professor, University of Nebraska-Lincoln
aschmidt@unl.edu
Additional Authors
-Mara Zelt, Schmidt Lab Project Director, University of Nebraska-Lincoln;
-Daniel Andersen, Associate Professor, Iowa State University;
-Erin Cortus, Associate Professor, University of Minnesota;
-Richard Koelsch, Emeritus Professor, University of Nebraska-Lincoln;
-Leslie Johnson, University of Nebraska-Lincoln;
-Siok A. Siek, Undergraduate Student, University of Nebraska-Lincoln; and
-Melissa Wilson, Assistant Professor, University of Minnesota
Acknowledgements
Funding for this project was provided by the North Central Region Sustainable Agriculture Research and Education program. Key partners in survey deployment were the American Agronomy Society Certified Crop Advisor Program, the Fertilizer Institute and Manure Manager magazine.
The authors are solely responsible for the content of these proceedings. The technical information does not necessarily reflect the official position of the sponsoring agencies or institutions represented by planning committee members, and inclusion and distribution herein does not constitute an endorsement of views expressed by the same. Printed materials included herein are not refereed publications. Citations should appear as follows. EXAMPLE: Authors. 2022. Title of presentation. Waste to Worth. Oregon, OH. April 18-22, 2022. URL of this page. Accessed on: today’s date.
The objective of this study was to evaluate nutrient dynamics and operational costs within an existing manure Compost Aeration and Heat Recovery system (CAHR) by Agrilab Technologies, Inc. at the Vermont Natural Ag Products (VNAP) compost facility in Middlebury, Vermont in comparison to conventional windrow manure composting where aeration only occurs via turning. Constructed in 2016 and 2017, the CAHR has been fully operational since 2018 and has proven effective at reducing VNAP’s expenditures on #2 heating oil, propane, diesel fuel, and labor (Foster et al., 2018).
The basic design of the CAHR system includes compost windrows placed on a paved pad containing a shallow trench oriented longitudinally with the windrow. The trench contains perforated High Density Poly Ethelene (HDPE) piping bedded in wood chips. These pipes are connected to solid, insulated HDPE piping which runs to a shipping container outfitted with circulation fans and a heat exchanger. While the circulation fans are negatively aerating (i.e., pulling vapor from) the compost, warm vapor entering the system transfers heat energy to water piped through the heat exchanger. Heat recovered from compost windrows has been used to heat the site’s bagging building via radiant floor heating and to dry finished compost prior to the screening and bagging process. Furthermore, due to elevated oxygen levels provided by positive and negative aeration, CAHR-treated compost has been reported to mature more quickly and require less turning, reducing diesel, labor, and equipment maintenance costs (Foster et al., 2018).
What Did We Do?
Two compost windrows of equivalent feedstock contents and ratios were monitored. Our control, denoted as “TRAD”, was a conventionally treated windrow that did not receive aeration aside from periodic windrow turning with a Komptech Topturn x53 compost turner. Our experimental windrow, denoted as “CAHR”, received periodic positive and negative aeration via the CAHR system, as well as aeration through periodic turning. The initial volumes of the TRAD and CAHR windrows were 480.2 CY and 548.8 CY, respectively.
Compost samples were collected between August 24th, 2021 and December 15th, 2021. For the first thirteen weeks of the sampling period, samples were taken thrice weekly from both treatments. At the end of the thirteenth week, on November 19th, VNAP staff deemed the CAHR treatment compost suitable for market and it was pulled for processing. Sampling continued once weekly for the TRAD treatment for another four weeks, terminating on December 15th, when the TRAD windrow was pulled for processing. This resulted in a total of 43 samples of TRAD and 39 samples of CAHR composts.
What Have We Learned?
This study evaluated nutrient status, financial cost, and energy cost for a pair of commercial compost windrows in a normal production setting. From a time and space management standpoint, compost treated with a forced-aeration system was deemed suitable for market in approximately 75% of the time as a conventionally turned windrow; 13 and 17 weeks, respectively. Analysis of nitrogen species status throughout the study suggests that greater nitrogen losses occurred during conventional treatment than during CAHR treatment, presumably due to higher rates of denitrification and ammonia volatilization. Data also suggest a lower risk for phosphorus loss through leaching from CAHR-treated compost, as water extractable phosphorus (WEP) concentrations were consistently higher in the conventional treatment. During the active composting process, it was found that operational costs for CAHR compost were 2.1 times more expensive financially and 5.5 times more energy-intensive than a conventional compost on a per CY basis. However, the energy and infrastructure cost offsets provided by the CAHR system (as operated at VNAP) could provide a net savings of $4.06/CY finished compost. In this study, with paired windrows of approximately 12 feet in width, it was shown that a CAHR system produced a comparable compost product, with higher operational input, in less time.
Furthermore, the data suggest that land application of either compost treatment evaluated in this study may reduce phosphorus loss due to leaching versus direct manure application. For example, WEP concentrations in the finished composts in this study ranged between 0.256 and 0.304 g/kg on a dry weight basis, while WEP concentrations in dairy manures have been found to range between 1.98 and 4.0 g/kg (P. Kleinman et al., 2007; P. J. A. Kleinman et al., 2005). It is probable that either compost treatment, when applied to agricultural land, would release less phosphorus as WEP during rainfall events than direct manure application, providing water quality benefits.
Future Plans
The Newtrient CIG will continue to evaluate 13 more technologies over the next 2 years to determine their effect on water quality.
Authors
Mark Stoermann, Chief Operating Officer, Newtrient LLC
Corresponding author email address
Mstoerm@newtrient.com
Additional authors
Finn Bondeson, Graduate Student, University of Vermont; Joshua Faulkner, Research Assistant Professor and Farming and Climate Change Program Coordinator, University of Vermont; and Eric Roy, Assistant Professor, Interim Director of Environmental Sciences Program, University of Vermont
Additional Information
Newtrient.com
The authors are solely responsible for the content of these proceedings. The technical information does not necessarily reflect the official position of the sponsoring agencies or institutions represented by planning committee members, and inclusion and distribution herein does not constitute an endorsement of views expressed by the same. Printed materials included herein are not refereed publications. Citations should appear as follows. EXAMPLE: Authors. 2022. Title of presentation. Waste to Worth. Oregon, OH. April 18-22, 2022. URL of this page. Accessed on: today’s date.
Animal manures contain nutrients [primarily nitrogen (N) and phosphorus (P)] and organic material that are beneficial to crops. Unfortunately, for economic and logistics reasons, liquid dairy and swine manure tends to be applied to soils near where it is generated. Over time, P concentrations in soils where dairy manure is applied builds up, often in excess of crop demands. We previously (Church et al., 2016, 2017) and have subsequently built, a full-scale version of a MAnure PHosphorus EXtraction (MAPHEX) System capable of removing greater than 90 percent of the P from manures. While originally designed to remove phosphorus, we have also shown that the MAPHEX System was also capable of removing odor and microbes, and of concentrating alkalinity into a solid, economically transported form. We have also lowered daily operating costs by testing the effect of lower-cost chemicals as alternatives to ferric sulfate, and by showing that the diatomaceous earth (DE) filtering material can be recycled and reused. We are currently building a system capable of treating over 100,000 gallons of Dairy Manure per day. This system is planned to be operational for demonstrating starting summer 2022.
Purpose
Swine and dairy manures are typically in slurry form and contain nutrients [primarily nitrogen (N) and phosphorus (P)] and organic material that are beneficial to crops. Unfortunately, the concentrations of nutrients in both manures are too low to make transportation of bulk manures over large distances economically viable. Furthermore, since it must be transported in tanks, that transportation is inconvenient as well. Therefore, these manures tend to be applied to soils near where they are generated, and, over time, P concentrations in soils increase to the point that soil P concentrations are often in excess of crop demands. Furthermore, because of the implication that P runoff from agricultural operations plays an important role in eutrophication of streams and other water bodies, farmers are experiencing increasing pressures and regulation to not apply animal manures to those soils.
We previously reported on an invention that 1) is designed to be a solution to the P overloading that happens when unnecessary P is added to agricultural soils, 2) is scalable such that it can be used as a mobile system, and 3) has shown to be capable of removing greater than 90 percent of the P from a wide range of dairy manures, while retaining greater than 90% of the N in the final effluent for beneficial use by the farmer.
What Did We Do?
We subsequently built a full-scale version of a MAnure PHosphorus EXtraction (MAPHEX) System capable of removing greater than 90 percent of the P from manures and have tested it on dairy manures. We also focused our efforts on lowering the daily operating costs of the system by developing a method to recover and reuse the diatomaceous earth used in the final filtration step, and testing alternative, lower cost chemicals that can be used in the chemical treatment step. We also performed pilot-scale tests on swine manures.
What Have We Learned?
The full-scale MAPHEX System removed greater than 90% of P from a wide variety of dairy manures, while leaving greater than 90% of the N in the final effluent to be used beneficially to fertigate crops. The System was also shown to recover and concentrate alkalinity into a solid form on a farm that used greater amounts of lime during manure handling, remove 50% of the odor from dairy manure and to remove greater than 80% of Total coliforms and E. Coli. Furthermore, the System has not shown to alter the pH of the final effluent respective to raw manures as other treatment technologies can. We have lowered daily operating costs by testing the effect of lower-cost chemicals as alternatives to ferric sulfate, and by showing that the diatomaceous earth (DE) filtering material can be recycled and reused.
In pilot-scale swine testing, we found that the MAPHEX System can remove greater than 96% of the phosphorus in swine manures. This essentially P free effluent can be beneficially used for fertigation without further loading the receiving soils with P. Scaling up the pilot-scale testing has the potential to reduce swine manure storage volumes to allow for mitigation of overflow problems during large storms. Furthermore, the pilot-scale study suggests that capital equipment costs and treatment costs for swine manure would be lower than for treating dairy manure.
Future Plans
We are currently building a simplified version of the MAPHEX System that will be capable of treating over 100,000 gallons of dairy manure per day. This system is planned to be operational for demonstrating starting summer 2022. We plan to use this simplified version for demonstration tests, and use the results obtained to model the effects of using MAPHEX technology compared to conventional manure handling practices on two paired watersheds. We also plan to demonstrate the full-scale system on a wide range of swine manures with on-farm testing.
Author
Clinton D. Church, Research Chemist, USDA-ARS University Park, PA
Corresponding author email address
Cdchurch.h2o@netzero.com
Additional Information
Church, C. D., Hristov, A. N., Bryant, R. B., Kleinman, P. J. A., & Fishel, S. K. (2016). A novel treatment system to remove phosphorus from liquid manure. Applied Engineering in Agriculture, 32: 103 – 112. doi:10.13031/aea.32.10999
Church, C. D., Hristov, A. N., Bryant, R. B., & Kleinman, P. J. A. (2017). Processes and treatment systems for treating high phosphorus containing fluids. US Patent 9,790.110B2.
Church, C. D., Hristov, A. N., Kleinman, P. J. A., Fishel, S. K., Reiner, M. R., & Bryant, R. B. (2018). Versatility of the MAPHEX System in removing phosphorus, odor, microbes, and alkalinity from dairy manures: A four-farm case study. Applied Engineering in Agriculture, 34: 567 – 572. doi:10.13031/aea12632
Church, C. D., Hristov, A., Bryant, R. B., & Kleinman, P. J. A. (2019). Methods for Rejuvenation and Recovery of Filtration Media. USDA Docket Number 129.17. U.S. Patent Application Serial No. 62/548,23
Church, C. D., S. K. Fishel, M. R. Reiner, P. J. A. Kleinman, A. N. Hristov, and R. B. Bryant. 2020. Pilot scale investigation of phosphorus removal from swine manure by the MAnure PHosphorus Extraction (MAPHEX) System. Applied Engineering in Agriculture 36(4): 525–531. doi: 10.13031/aea13698
The authors are solely responsible for the content of these proceedings. The technical information does not necessarily reflect the official position of the sponsoring agencies or institutions represented by planning committee members, and inclusion and distribution herein does not constitute an endorsement of views expressed by the same. Printed materials included herein are not refereed publications. Citations should appear as follows. EXAMPLE: Authors. 2022. Title of presentation. Waste to Worth. Oregon, OH. April 18-22, 2022. URL of this page. Accessed on: today’s date.
Manage Cookie Consent
To provide the best experiences, we use technologies like cookies to store and/or access device information. Consenting to these technologies will allow us to process data such as browsing behavior or unique IDs on this site. Not consenting or withdrawing consent, may adversely affect certain features and functions.
Functional
Always active
The technical storage or access is strictly necessary for the legitimate purpose of enabling the use of a specific service explicitly requested by the subscriber or user, or for the sole purpose of carrying out the transmission of a communication over an electronic communications network.
Preferences
The technical storage or access is necessary for the legitimate purpose of storing preferences that are not requested by the subscriber or user.
Statistics
The technical storage or access that is used exclusively for statistical purposes.The technical storage or access that is used exclusively for anonymous statistical purposes. Without a subpoena, voluntary compliance on the part of your Internet Service Provider, or additional records from a third party, information stored or retrieved for this purpose alone cannot usually be used to identify you.
Marketing
The technical storage or access is required to create user profiles to send advertising, or to track the user on a website or across several websites for similar marketing purposes.