Concise Composting

Purpose

Timber Creek Recycling has operated a turned windrow composting operation using manure and food waste processing by-products and green waste for over a decade in Meridian, Idaho. Pressure from suburban encroachment and the availability of increasingly difficult feedstocks that had excessive odor, created the need to move operations from a farm to an industrial site. Land costs were greater, and potential odor impacts would increase in this move. The owner also requested that the number of touches be reduced to minimize the current workload for compost operators. There are some essential operational & design considerations to manage manure composting on a concise footprint and a limited budget. This presentation describes the operation and design considerations that can apply to any composting operation.

What Did We Do?

Green Mountain Technologies considered three different models of concise composting. Radial stacker bunkers, using a central pivot telescopic conveyor to place and cover active compost piles. Also inwardly turned circular aerated piles, which use a side discharge compost turner to turn the compost towards the center of a large circle. Timber Creek Recycling decided to use a narrow profile rectangular shaped turned aerated pile composting approach. This form uses a long concrete aeration floor that allows the owner to build capacity in six phases and increase the operating efficiencies with each additional phase. This approach kept the expansions in line, so that delivery trucks could unload directly in front of the piles and so that side discharge compost turners could be used to mix feedstocks into one side of the pile and move the composting material through different aeration floor capacities and finally to a long collection belt that directly fed a compost screener. This and the aeration floor reduced touches from 12 to 9, compared to non-aerated windrows, and provided a once a week turning frequency, reducing compost, and curing time from 90 to 45 days.

Steps taken to reach this point.

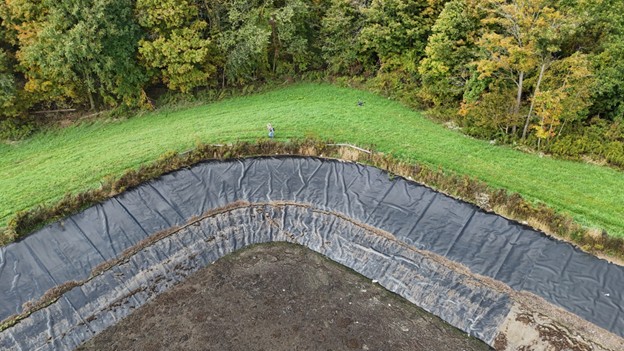
Industrial land was purchased in Nampa, Idaho, permits received and phase one of construction has been completed and operated for over 9 months. The design compacted a 30-acre operational site to a 12-acre operational site with significantly more capacity than the original. Odor reduction steps were taken to reduce the odor of cheese whey waste activated sludge being delivered to the site by using a lime additive during the screw press step at the cheese manufacturer. A small straddle windrow turner was used to mix the delivered feedstocks, and a food waste de-packager was installed to manage out-of-date or off-specification foods.

What Have We Learned?

The use of reversing direction aeration was not necessary when using positive aeration using a cap of wet wood chips or screened compost covers on top of the piles for the first 7 to 10 days. Odors have not been a problem at the new site using forced aeration compared with turned windrows (un-aerated) at the old site. The higher horsepower side discharge conveyor compost turners do not make economic sense just for phase one but will for all three phases. Wastewater collection and reuse is difficult to manage and needs to be incorporated into the mixing and turning process using an underground main and hose reel located at the far end of the aeration pads.

Take home messages

Aeration using blowers and airpipes below a concrete floor can effectively keep composting operations with challenging feedstocks from smelling bad and increase the biological efficiency and throughput. Use of a woody moist bio cover over the top of the pile is essential for the first 7-10 days for these feedstocks.

Force air through a compost pile at least 6 times per hour using on/off timers to control pile temperatures between 125° and 145° F and to keep oxygen above 13% using a rate of 3-5 CFM/cubic yard. Automated temperature feedback controllers make this simpler and more dependable.

Turn and re-water at least 2 times in the first month, either by top irrigation within 30 minutes before turning, or using a hose reel and spray bar connected to the turner (better) or simply turn piles at least 30 minutes after a big rain event.

Piles shrink over time- Double up the piles after 2 weeks and cure with less forced air at 1-2 CFM/cubic yard for an additional 2 weeks.

Adding capacity over time without increasing travel distances requires delivery directly to the initial composting area and collection from the distant piles using conveyors. On-farm generated feedstocks and the composting operations should be placed together as close as possible. Have delivery and storage of outside amendments be alongside your manure or processing waste discharge locations.

Each touch of the material should be limited, and with each touch involving several key feedstock preparation actions while entering a composting system, such as metering materials together in the correct proportions, and mixing thoroughly while watering and delivering into the first composting stage. Examples include building windrows proportionally with loaders and turning and watering with a windrow turner that can apply pond wastewater as it turns. Second example, if a conveyor is used to collect and discharge a manure in a CAFO, add bulking materials prior to the last conveyor and place into an in-line pug mill before stockpiling or placement on an aeration floor. The third example when using side dump delivery trucks, have trucks unload manure in a long low windrow, and then place the amendment in another long low windrow alongside about 22 feet apart, then use a side discharge windrow turner with a spray bar to apply wastewater to combine and then mix the windrows together using the turner in 2 passes. Large loaders move about 500 cubic yards per hour, compost turners move over 4000 cubic yards per hour. So each touch is cheaper per unit.

Future Plans

Phases two and three are under development to move the entire windrow operation from Meridian Idaho to the new site within 2 years.

Authors

Presenting authors

    • Jeffrey Gage, Director of Consulting, Green Mountain Technologies, Inc.
    • Mike Murgoitio, President, Timber Creek Recycling
    • Caleb Lakey, Vice President, Timber Creek Recycling, LLC

Corresponding author

Jeffrey Gage, Director of Consulting, Green Mountain Technologies, Inc., jeff@compostingtechnology.com

Additional author

Caleb Lakey, Vice President, Timber Creek Recycling, LLC.

Additional Information

Seasonal greenhouse gas emissions from dairy manure slurry storages in New York State

Due to a technical glitch, the beginning of the recorded presentation was not recorded. Please accept our apologies.

Purpose

As the adoption of dairy manure storage systems has increased as a best management practice for protecting water quality, the anaerobic conditions in these systems has inadvertently led to an increase in emission of the greenhouse gas methane. Current inventory and modeled estimates of this potent greenhouse gas are based on limited datasets, and there is a need for methodologies to better quantify these emissions so that the impacts of storage conditions, manure treatments and seasonality can be better assessed, mitigation strategies can be implemented, and greenhouse gas reduction estimates can be correctly accounted for.

What Did We Do?

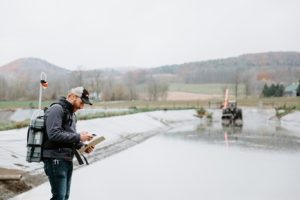
We are developing a ground-based, mobile measurement approach where manure storage systems are circled with a backpack methane gas analyzer and measurements are integrated with on-site wind measurements to calculate emission flux rates. Twelve commercial dairy farm manure storage systems, representing a range of herd sizes and pre-storage manure treatments are collaborating on the research. Once per month, each manure storage structure at each site is circled 10 consecutive times with a methane gas analyzer. A drone equipped with a separate methane analyzer is also used to verify ground-based measurements amidst the methane plumes. Divergence (Gauss’s) theorem is then applied to concentration measurements and anemometer wind data to estimate the net rate of methane flux. These observed methane emission fluxes are compared to International Panel of Climate Change (IPCC) modeled emissions as well as state inventories.

What Have We Learned?

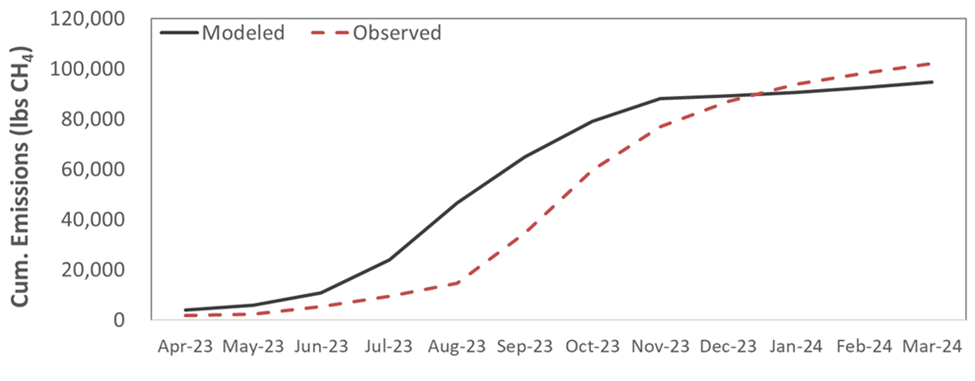
We find that this methodology provides a reliable, cost-effective way to estimate methane emissions from manure storages. Observed emissions track modeled emissions with similar magnitudes, though models may be overestimating emissions during the growing season and underestimating during the winter months in this region (Figure 1). While emissions patterns are generally similar for each of the farm sites, with some farms and some individual monthly observational estimates there can be substantial deviation from predicted emission rates.

Figure 1. Modeled and measured cumulative methane emissions from a dairy manure storage system over a 12-month period.

Future Plans

Evaluation of 2024 field data is ongoing, and we will continue to measure methane around storages with ground-based and drone measurements into the summer of 2025. We will explore plume dynamics and the effects of pre-storage treatments on measured methane emission flux. For select sites, measurements will be expanded to include continuous, open-path laser absorption spectroscopy to verify this novel measurement approach, footprint emissions, and explore the implications of pre-storage manure treatments.

Authors

Presenting & corresponding author

Jason P. Oliver, Dairy Environmental Systems Engineer, Cornell University | PRO-DAIRY, jpo53@cornell.edu

Additional authors

Lauren Ray, Agricultural Sustainability and Energy Engineer, Cornell University | PRO-DAIRY

Eric Leibensperger, Associate Professor, Physics and Astronomy, Ithaca College

Additional Information

https://cals.cornell.edu/pro-dairy/our-expertise/environmental-systems/climate-environment/greenhouse-gas-emissions

https://leibensperger.github.io/

Acknowledgements

Funding for this work was provided by the New York State Department of Agriculture and Markets. Agreement #  CM04068CO


The authors are solely responsible for the content of these proceedings. The technical information does not necessarily reflect the official position of the sponsoring agencies or institutions represented by planning committee members, and inclusion and distribution herein does not constitute an endorsement of views expressed by the same. Printed materials included herein are not refereed publications. Citations should appear as follows. EXAMPLE: Authors. 2025. Title of presentation. Waste to Worth. Boise, ID. April 711, 2025. URL of this page. Accessed on: today’s date.

Decades of advancement in the practice of manure storage and toward continued future success

Purpose

The history and development of the practice of manure storage over time in the US is told to educate new stakeholders, illustrate collective industry advancements and failures that have shaped course, and urge support for future success using rational design approaches, especially for concrete liners.

What Did We Do?

From literature and research interviews we layout a narrative for how the practice of manure storage design has changed over time. Change in the practice is traced by examining the development and use of the four major lining materials of earth, steel, plastic and concrete against the larger backdrops of consolidation and increasing environmental caution. Special focus is given to concrete, a lining material with relatively high durability and low permeability but limited rational design methodology.

What Have We Learned?

The practice of manure storage is shown to have advanced over the decades resulting in lower permitted seepage obtained for longer lifespans. This advancement has occurred under pressures for larger storages that are held to higher environmental standards.  This advancement has been made possible by the development of existing and new materials, including significant technical support behind them developed by governmental agencies, industries that supply the materials, and engineers who utilize them on farms. In the area of concrete liners there is room for significant advancement to develop near zero seepage liners at feasible cost, through the use of frameworks that are rational (mechanistic-empirical) and quantifiable.

Future Plans

Complete stage gate analysis for obtaining design seepage rates for concrete liners used in manure storage, that are mechanistic based and quantifiable.

Authors

Presenting & corresponding author

Mike Krcmarik, Professional Engineer, mikekrcmarik@gmail.com

Email corresponding author for a copy of the presentation and all collected references.

Acknowledgements

The author would like to acknowledge employees of the USDA’s Natural Resources Conservation Service, private consulting engineers designing manure storages, state regulators supporting manure storages, and material industry representatives for providing perspectives and resources used in assembling this presentation.


The authors are solely responsible for the content of these proceedings. The technical information does not necessarily reflect the official position of the sponsoring agencies or institutions represented by planning committee members, and inclusion and distribution herein does not constitute an endorsement of views expressed by the same. Printed materials included herein are not refereed publications. Citations should appear as follows. EXAMPLE: Authors. 2025. Title of presentation. Waste to Worth. Boise, ID. April 7-11, 2025. URL of this page. Accessed on: today’s date.

Using an interactive map exercise to help producers better manage their manure

Purpose

Time and time again, experience has taught us that many people learn by doing, not just from listening to presentations. The Nebraska Animal Manure Management Team has worked hard over the last six years to develop and expand what is now referred to as the Interactive Nutrient Management Decision-Making Exercise. This workshop will serve as a train-the-trainer event where attendees will:

    1. Discover how the exercise began and what it has grown to include
    2. Get familiar with the pieces and parts by helping set up the activity
    3. Experience a couple of the activities as participants
    4. Hear from others that have adapted the exercise and their experiences
    5. Brainstorm how the exercise can be used elsewhere or for other concepts

What Did We Do?

The Interactive Nutrient Management Decision-Making Exercise (mapping exercise) was developed by the Animal Manure Management Team at the University of Nebraska-Lincoln and University of Minnesota to engage participants during Manure Application Trainings. In Nebraska, these trainings previously relied heavily on PowerPoint and recorded presentations, but with many people being hands-on learners, an interactive exercise was proposed. In 2020, the original 6 activities were used for the afternoon portion, and it has since grown to the exercise it is today that is incorporated throughout the whole-day training.

It has been used not only for livestock producers but also crop producers. Parts of it have been modified to fit into workshops at conferences and, most recently, high school classrooms. Current expansion topics include spray drift to avoid sensitive areas and nitrogen management from all sources.

What Have We Learned?

Because many livestock producers in Nebraska are required to attend Land Application Training events every five years to maintain their Livestock Waste Control Facility permit, the winter 2024-2025 programming season for the Nebraska manure team offered an opportunity to ask participants how their operations have changed since the first time they had seen the Interactive Nutrient Management Decision-Making Exercise (in 2020). The team asked 3 questions specific to the exercise and changes on their operations and found the following results.

In general, participants are considering the topics taught during training more now than they were five years ago. The figure below indicates that 48% consider weather forecasts to decrease odor risk more or much more than they did prior to experiencing the Interactive Nutrient Management Decision-Making Exercise. Forty eight percent and 59% consider water quality and soil health impacts from manure more than five years ago, subsequently. While many participants already factored in transportation cost compared to nutrient value captured for a field, 59% reported that they consider it more or much more than they did, and 55% reported that they now considered the value of manure nutrients based on a field’s soil test more or much more.

Figure 1: As a result of experiencing the interactive nutrient management decision making exercise, how does your operation consider survey redults

We also asked participants to share with us how useful they felt the changes and expanded activities of the Interactive Nutrient Management Decision-Making Exercise were. All participants felt that the changes and expansion were useful with 52% indicating that they were very or extremely useful.

Figure 2: How useful are the changes and expanded activities of the Interactive Nutrient Management Decision-making exercise pie chart

We also asked, “How do you expect your experience with the newer activities of the interactive nutrient management decision-making exercise will change your operation in the future?” and, among others, we received the following responses:

    • “[we will] take more consideration to neighbors near application”
    • “[we will make] better $ management decision[s] on manure application site[s]”
    • “[the activity] makes us want to plan out better to get better results”

Future Plans

With so much success using this teaching tool, we would like to expand it to teach topics other than nutrient management. The Soil Health Nexus, a soil health workgroup in the north central region of the US, is in the process of developing an adaptation of this tool that will teach participants about the impacts of certain practices on soil health. Currently, progress has been made on activities focusing on tillage and the use of cover crops. Other planned activities include a focus on crop rotation and the use of the Soil Health Matrix, a tool developed by the Soil Health Nexus.

The Nebraska Animal Manure Management team, as part of a different grant, also has plans to create some activities focused on integrating livestock into cropping systems.

We also support using the base model of this exercise and adapting it for other practices and audiences outside of Nebraska.

Authors

Presenting & Corresponding author

Leslie Johnson, Animal Manure Management Extension Educator, University of Nebraska – Lincoln, leslie.johnson@unl.edu

Additional author

Amy Millmier Schmidt, Professor and Livestock Bioenvironmental Engineering Specialist, University of Nebraska-Lincoln;

Additional Information

Downloadable Curriculum: https://lpelc.org/interactive-nutrient-management-decision-making-exercise-curricula/

Acknowledgements

We would like to acknowledge all other contributors to the curriculum in the past including:

    • Larry Howard, Rick Koelsch, Agnes Kurtzhals, Aaron Nygren, Agustin Olivio, Amber Patterson, Katie Pekarek, Amy Schmidt, Mike Sindelar, and Todd Whitney (University of Nebraska, Lincoln)
    • Daryl Andersen, Tyler Benal, Will Brueggemann, Russ Oakland, and Bret Schomer (Lower Platte North NRD)
    • Blythe McAfee and Tiffany O’Neill (Nebraska Department of Environment and Energy)
    • Andy Scholting (Nutrient Advisors)
    • Marie Krausnick, Dan Leininger (Upper Big Blue NRD)
    • Chryseis Modderman (University of Minnesota)
    • Nutrient Advisors
    • Settje Agri Services Eng.
    • Ward Laboratories Inc.

The authors are solely responsible for the content of these proceedings. The technical information does not necessarily reflect the official position of the sponsoring agencies or institutions represented by planning committee members, and inclusion and distribution herein does not constitute an endorsement of views expressed by the same. Printed materials included herein are not refereed publications. Citations should appear as follows. EXAMPLE: Authors. 2025. Title of presentation. Waste to Worth. Boise, ID. April 7-11, 2025. URL of this page. Accessed on: today’s date.

Impact of ammonia reduction management practices in land applied manure on nitrogen losses and nitrogen use efficiency

Purpose

Manure nitrogen losses from agricultural soils presents a significant challenge with far-reaching implications for global food security and environmental health. This project evaluates common manure application practices and studies some mechanistic factors and relationships that influence manure nitrogen losses via leaching and volatilization when manure is soil applied. The study highlights the tradeoffs between reduction of ammonia emissions and nitrogen leaching aiming to promote effective manure management techniques that increase crop nutrient use efficiency while minimizing nutrient losses to the environment.

What Did We Do?

Dairy manure was applied to a silt loam agricultural field using different manure applications. The study involves six experimental treatments, each applying 94 m³ ha-1 of liquid dairy manure through different methods: injection, incorporation, surface broadcast, and two treatments with urease inhibitor-one injected and one surface broadcast. Additionally, there are control plots with no manure application. Immediately after manure application, ammonia emissions were routinely measured using an FTIR while cumulative nitrate leaching for the growing season was assessed using the resin cartridge methodology. Corn silage was planted and yield data collected at the end of the growing season and nitrogen use efficiency following each experimental treatment determined.

What Have We Learned?

Preliminary results suggest that manure incorporation and injection with or without the urease inhibitor, have a comparable significant impact on corn silage yield when compared to surface manure application and plots with no manure application. However, there were no significant differences in N uptake among treatments. Additionally, there were significant differences in the cumulative nitrates leached when comparing the manure application methods to the no-manure plots. Manure injection and incorporation resulted in the highest significant nitrates leached with averages of 104.4 kg ha-1 and 108.4 kg ha-1  respectively, in comparison to surface manure application. Overall, current project data suggests that ammonia emissions tend to be lower in the manure injection especially when the manure is treated with urease inhibitor compared to when manure is surface applied.

These preliminary results suggest that certain manure application practices may offer superior environmental benefits while the agronomic benefits may remain comparable across different practices.

Future Plans

The field project will be extended into a second year under similar soil types to collect additional data for better comparisons and identifications of trends among experimental treatments. Future plans will also include a new project involving the incorporation of biochar and investigating its potential in simultaneously reducing ammonia volatilization and nitrogen leaching in manure and crop systems.

Authors

Presenting & corresponding author

Juma Bukomba, PhD Candidate, University of Wisconsin-Madison, bukomba@wisc.edu

Additional authors

Rebecca Larson, Associate Professor, University of Wisconsin-Madison;

Mathew Ruark, Professor, University of Wisconsin-Madison

Acknowledgements

This material is based upon work supported by the National Science Foundation under Grant No. EFMA-2132036. Any opinions, findings, and conclusions or recommendations expressed in this material are those of the author(s) and do not necessarily reflect the views of the National Science Foundation.

The authors are solely responsible for the content of these proceedings. The technical information does not necessarily reflect the official position of the sponsoring agencies or institutions represented by planning committee members, and inclusion and distribution herein does not constitute an endorsement of views expressed by the same. Printed materials included herein are not refereed publications. Citations should appear as follows. EXAMPLE: Authors. 2025. Title of presentation. Waste to Worth. Boise, ID. April 7-11, 2025. URL of this page. Accessed on: today’s date. 

Particulate Matter Concentrations in a Swine Farrowing Room Microenvironment

Purpose

Microenvironment in swine buildings is the specific and localized environmental conditions that directly affect the animals. Air quality is one of the critical conditions for the safety, health, productivity, and behavior of the animals and the health of workers. However, limited research has been conducted on air quality within the microenvironment of swine barns. The purpose of this study is to improve the understanding and management of swine production and welfare by measuring and characterizing the microenvironmental particulate matter (PM) concentrations in a swine facility.

What Did We Do?

This study covered a batch of swine farrowing from September 20 to October 15, 2024, in a 12-pen room of an experimental building at Purdue University. Measurement started on September 21, the second day after the sows were moved into the room.  Fine and inhalable particulate matter (PM2.5 and PM10, respectively) concentrations and air temperatures were monitored using 12 portable PM sensors and 12 T-type thermocouples, respectively, at approximately 50 cm (1.6 feet) above the slatted floor on the sow head/feeder end in each pen. Pig activity levels were monitored using a passive infrared detector positioned on the ceiling above each pen. Fan airflow rates were monitored using anemometers to determine room ventilation rates. All measurement data were recorded every minute. The PM concentration data from different sensors were normalized to remove sensitivity variations among the sensors. Data were analyzed for the dynamic and spatial variations of PM concentrations in the room and among different pens.

What Have We Learned?

Results showed that overall PM2.5 and PM10 concentrations changed dynamically.  Sows did not generate a significant amount of PM before farrowing.  The PM concentrations increased dramatically from pre-farrowing to farrowing and continued to increase to the maximum approximately 15 days after farrowing. After that the PM concentrations decreased daily until weaning. The PM concentrations in the pens were similar to empty pens right after the sows and piglets were removed at the end of the study (Figure 1). Diurnal variations in PM concentrations were evident and were affected by pig activities and room ventilation rates. Some management operations in the room caused spikes of PM concentrations, which did not last for long. Notable differences in PM2.5 and PM10 concentrations among the pens were observed. Concentrations of PM2.5 and PM10 within the same pen displayed similar variation patterns (Figure 1 top and bottom).

Figure 1. An example illustrating the temporal variability of PM2.5 (top) and PM10 (bottom) concentrations recorded every minute in one of the pens during the farrowing cycle. Some missing data from 10/23 to 10/24 was due to a measurement issue.

Future Plans

More experiments will be conducted to study PM emissions from swine farrowing facilities. Measurement methodologies will be improved to increase data accuracies and completeness. Additionally, the results of swine building microenvironment study will be disseminated via Extension to producers and other stakeholders.

Authors

Presenting & corresponding author

Ji-Qin Ni, Professor, Purdue University, jiqin@purdue.edu

Additional authors

Ritika Sachdeva, Graduate Student; Alexandra Elizabeth Fisk, Graduate Student; Katherine E. Klassen, Graduate Student; Subin Han, Graduate Student; Jae Hong Park, Associate Professor; Brian T. Richert, Associate Professor, Purdue University

Acknowledgements

This study was supported by the Foundation for Food and Agriculture Research and the National Pork Board under Grant ID: 22-000290

The authors are solely responsible for the content of these proceedings. The technical information does not necessarily reflect the official position of the sponsoring agencies or institutions represented by planning committee members, and inclusion and distribution herein does not constitute an endorsement of views expressed by the same. Printed materials included herein are not refereed publications. Citations should appear as follows. EXAMPLE: Authors. 2025. Title of presentation. Waste to Worth. Boise, ID. April 7-11, 2025. URL of this page. Accessed on: today’s date. 

Optimizing Manure Application Timing for Methane Reduction and Economic Gains through Carbon Credits

Purpose

Methane emissions from manure storages significantly contribute to the livestock industry’s carbon footprint. While various manure management strategies are used to reduce greenhouse gas (GHG) emissions on farms, such as anaerobic digestion and composting, many of these strategies are cost-prohibitive for small-to-medium-sized farms. Strategic manure application timing to limit GHG emissions is a practical, scalable option to reduce methane production in manure storages.

Carbon credits are financial incentives for farmers who adopt practices that reduce greenhouse gas emissions, such as cover crops or methane emissions abatement. These credits can then be sold to companies seeking to offset their emissions. This study evaluates the impact of manure application timing on methane emissions from storages and explores how carbon credits could act as an incentive for farms to employ climate-smart manure management practices. By comparing different manure application strategies (fall, spring, in-season sidedress, and split applications), we assess the methane reductions and improved economics of optimized timing.

What Did We Do?

Methane emissions were estimated using data from a lab-based study conducted by Andersen et al. (2015), who measured methane emissions from deep-pit swine manure at various temperatures. From this data, we created a model incorporating manure production rates and ambient temperature dynamics to predict daily methane emissions from a 4800-head slurry storage and 4800-head deep-pit swine production facility.

Seven application scenarios were compared: fall (November 1), spring (April 15), sidedress (June 1), fall-spring, fall-sidedress, spring-sidedress, and fall-spring-sidedress split applications. Total methane emissions were calculated for each scenario, allowing us to determine the GHG emissions abated by shifting from a fall application to an alternate strategy. An economic assessment was conducted using a $30/metric ton carbon dioxide equivalent (MT CO2e) carbon credit valuation to determine the financial implications of these methane mitigation strategies.

What Have We Learned?

For our swine slurry store model, methane emissions were highest in the single fall application scenario due to the full storage attained during peak summer temperatures, with annual emissions totaling nearly 0.5 MT CO2e/pig-space (Figure 1). Shifting application to spring or sidedress reduced emissions by approximately 50%. Split applications showed a further reduction in emissions by maintaining lower storage volumes throughout the year.

Figure 1: Estimated methane emissions in metric tons of carbon dioxide equivalent (MT CO2e) from slurry storage for fall, spring, sidedress, fall-spring split (F-S), fall-sidedress split (F-SD), spring-sidedress split (S-SD), and fall-spring-sidedress split (F-S-SD) applications.

From an economic perspective, carbon credits significantly enhanced the financial viability of the new application strategies. Carbon credits from abated emissions are projected to bring a maximum of $10/pig-space, or about $74/acre, to the farm annually in the F-S-SD scenario (Table 1). The improved manure application timing can also benefit crop yield, making a spring or sidedress manure application even more economically favorable.

Table 1: Projected carbon credit income for a 4800-head wean to finish swine farm with a slurry storage for fall, spring, sidedress, fall-spring split (F-S), fall-sidedress split (F-SD), spring-sidedress split (S-SD), and fall-spring-sidedress split (F-S-SD) applications.

Fall Spring Sidedress F-S F-SD S-SD F-S-SD
Carbon Credit Income

($/acre)

$           –  $    33.63  $    33.71  $    41.95  $    45.82  $    45.69  $    52.06
Carbon Credit Income

($/pig-space)

$           –  $       6.50  $       6.51  $       8.10  $       8.85  $       8.83  $    10.06

Future Plans

Further research should be conducted to refine the temperature aspect of the model. In the slurry store model, we assume that the manure temperature equals the 10-day average temperature. A study to verify the true manure temperature throughout the year would improve the confidence level of the current model. For deep pit barns, we use measured temperature data from 58 barns over 13 months, but manure temperatures were collected from the manure pump out access port and may not represent average manure temperatures in the barn. Future models to assess differences between deep pit and slurry store emissions will highlight the optimal manure management strategies for limiting GHG emissions.

Using specialized high-clearance irrigation equipment, like the 360 RAIN from 360 Yield Center, could enhance the feasibility of more frequent manure applications, reducing methane emissions while maintaining crop nitrogen availability. Additionally, developing standardized carbon credit protocols for manure management could create opportunities for more producers to monetize methane reduction efforts, further incentivizing climate-smart manure application strategies.

Authors

Presenting author

Jacob R. Willsea, Graduate Research Assistant, Iowa State University Department of Agricultural and Biosystems Engineering

Corresponding author

Daniel S. Andersen, Associate Professor, Iowa State University Department of Agricultural and Biosystems Engineering, dsa@isatate.edu

Additional Information

Andersen, D.S., Van Weelden, M.B., Trabue, S.L., & Pepple, L. M. (2015). Lab-assay for estimating methane emissions from deep-pit swine manure storages. Journal of Environmental Management, 159, 18-26. https://doi.org/10.1016/j.jenvman.2015.05.003

Talkin’ Crap Podcast Episode:

https://talkincrappodcast.buzzsprout.com/2163071/episodes/16472267-timing-is-everything-reducing-methane-emissions-with-manure-management

Andersen Lab Poster Repository:

https://iastate.box.com/s/3kkzdzcjlk9qcfrgbv6mj9x7vdk1v0fp

Acknowledgements

USDA-NRCS

Brent Renner

360 Yield Center

The authors are solely responsible for the content of these proceedings. The technical information does not necessarily reflect the official position of the sponsoring agencies or institutions represented by planning committee members, and inclusion and distribution herein does not constitute an endorsement of views expressed by the same. Printed materials included herein are not refereed publications. Citations should appear as follows. EXAMPLE: Authors. 2025. Title of presentation. Waste to Worth. Boise, ID. April 7-11, 2025. URL of this page. Accessed on: today’s date. 

Optimizing Manure Nitrogen Application Timing in Corn Production for Sustainability and Profitability

 Purpose

Nitrogen (N) application timing is crucial in balancing crop productivity and environmental sustainability. While fall applications are typical among Iowa corn producers due to favorable field conditions, they pose a high risk of N loss through denitrification, volatilization, and leaching. Spring and in-season sidedress applications offer improved nitrogen use efficiency (NUE) by aligning N availability with crop demand.

This study evaluates the effects of different N application timings—fall, spring, and sidedress—on corn yield and NUE. Using data from 65 site-years, we assess how application timing influences yield, economic returns, and environmental impacts. The findings provide insights into best management practices for improving profitability and sustainability in corn production.

What Did We Do?

A review of studies comparing N application timing in corn production was conducted, including a long-term experiment from the University of Minnesota (1960-1996) and additional datasets totaling 65 site-years. Treatments were separated into three categories: fall, spring, and sidedress. Relative yield was used to normalize data across years, and yield response was modeled using a Mitscherlich-Baule equation (Figure 1).

Figure 1: Yield response curves for 65 site-years of relative yield response data, categorized by season of N application

Economic impacts were analyzed using maximum return to nitrogen (MRTN), which identifies the N rate that maximizes economic return (Figure 2). Corn prices ($4.62/bu) and anhydrous ammonia prices ($0.45/lb N) were used to estimate profitability in each application scenario. The environmental effects were assessed by examining N-loss pathways and the potential for emission reduction of nitrous oxide (N2O), a greenhouse gas estimated to be 273 times more potent than carbon dioxide.

Figure 2: Net income per acre for fall, spring, and sidedress N application. Maximum return to nitrogen (MRTN) is plotted as a circular point on each curve, with the profitable N rate (low and high) within $1/acre bounded by diamond points.

What Have We Learned?

Results show that year-to-year, sidedress applications consistently produce the highest corn yield, followed by spring applications, with fall applications being the least effective. Yield differences are particularly evident in wet years (November to June rainfall > 1 inch above average), where sidedress applications outperform fall by an average of 9% (Figure 3). MRTN analysis shows that sidedress applications require 25% less N than fall applications while achieving higher yields, demonstrating their economic advantage.

Figure 3: Reduction in relative yield between fall and sidedress application in different weather conditions: Dry (greater than 1 inch below average November-to-June precipitation), Average (within ±1 inch of average precipitation), and Wet (greater than 1 inch above average precipitation). Interpreted as the yield loss due to increased exposure of applied N to precipitation.

The environmental analysis indicates that reducing N application rates through improved timing could cut N2O emissions by up to 25%. With a carbon credit of $30/metric ton CO2e abated the reduction in N2O equates to a $2.66/acre credit for a reduced N application rate. Fall-applied N is most susceptible to losses due to prolonged exposure to wet conditions, while spring and sidedress applications minimize the risk of loss by reducing time in the field and matching crop demand.

Future Plans

Further research is needed to refine N application strategies by incorporating real-time weather data and precision agriculture tools. The development of high-clearance application equipment, such as 360 RAIN from 360 Yield Center, offers opportunities for more flexible and targeted in-season applications, potentially enhancing NUE and reducing losses.

Additional studies should assess the risk of spring or sidedress applications from year to year. Weather conditions often limit pre-plant N application, so a thorough analysis of the frequency and financial impact of interrupted field management operations should be conducted.

Future studies should also explore the economic feasibility of split applications, which combine the benefits of multiple timings to reduce risk. Additionally, expanding MRTN models to include seasonal effects would improve decision-making for producers seeking to optimize N application timing while minimizing environmental impact.

Authors

Presenting author

Jacob R. Willsea, Graduate Research Assistant, Iowa State University Department of Agricultural and Biosystems Engineering

Corresponding author

Daniel S. Andersen, Associate Professor, Iowa State University Department of Agricultural and Biosystems Engineering, dsa@iastate.edu

Additional Information

Talkin’ Crap Podcast Episode:

https://talkincrappodcast.buzzsprout.com/2163071/episodes/15629592-the-power-of-manure-timing-enhancing-nitrogen-efficiency

Andersen Lab Poster Repository:

https://iastate.box.com/s/4s9gjhkd93d95yvqip8q5rr46frshtln

https://iastate.box.com/s/icg6clbamksfzciw8ze3lc301p8homg1

Acknowledgements

USDA-NRCS

Brent Renner

360 Yield Center

The authors are solely responsible for the content of these proceedings. The technical information does not necessarily reflect the official position of the sponsoring agencies or institutions represented by planning committee members, and inclusion and distribution herein does not constitute an endorsement of views expressed by the same. Printed materials included herein are not refereed publications. Citations should appear as follows. EXAMPLE: Authors. 2025. Title of presentation. Waste to Worth. Boise, ID. April 7-11, 2025. URL of this page. Accessed on: today’s date.  

Livestock Emissions in the United States: Challenges, Efforts, and Opportunities

Due to a technical glitch, we did not get this presentation recorded. Please accept our apologies.

Purpose

This study aimed to review current literature on livestock emissions in the United States, focusing on sources, challenges, and mitigation strategies. Specifically, it examines emissions from enteric fermentation, animal housing, manure management systems, and manure utilization. By synthesizing existing research, the study provides an understanding of how these emission sources contribute to air quality concerns, including greenhouse gas accumulation, odor issues, and public health risks. Additionally, it highlights the regulatory landscape and ongoing efforts to monitor and reduce emissions through technological and management innovations.

This study also explores opportunities for improving air quality while maintaining sustainable livestock production. It evaluates the effectiveness of various mitigation strategies, such as precision feeding, anaerobic digestion, and advanced manure treatment systems, in reducing emissions. Furthermore, it discusses potential advancements, including circular economy approaches and enhanced air quality modeling, to optimize emission reductions. By providing this analysis of current research and policy efforts, this study aims to support informed decision-making among producers, researchers, and policymakers in advancing sustainable livestock systems.

What Did We Do?

This literature review analyzed peer-reviewed research, government reports, and industry publications on livestock emissions. The review focused on emissions from enteric fermentation, animal housing, manure management systems, and manure utilization, identifying key sources and their environmental impacts. Studies were selected based on their relevance to air quality, greenhouse gas emissions, and mitigation strategies, ensuring a broad yet detailed assessment of current knowledge. Additionally, regulatory frameworks and policies from agencies such as the United States Department of Agriculture  and U.S. Environmental Protection Agency were examined to contextualize efforts aimed at reducing emissions in livestock production systems.

To evaluate mitigation strategies, the study categorized technologies and management practices based on their effectiveness, feasibility, and adoption rates. Approaches such as anaerobic digesters, biofilters, precision feeding, and manure treatment systems were reviewed for their potential to reduce emissions while maintaining economic viability. Case studies and data from ongoing research projects were incorporated to highlight real-world applications and emerging innovations. The synthesis of findings aimed to identify knowledge gaps, assess the impact of existing policies, and propose future research directions to enhance emission reduction efforts in livestock production.

What Have We Learned?

Livestock emissions primarily arise from enteric fermentation (methane from digestion) and manure management. These sources contribute significantly to agricultural methane emissions, a potent greenhouse gas impacting climate change. Recent research has enhanced our understanding of strategies to mitigate methane emissions from livestock, particularly through dietary interventions. Feed additives like 3-nitrooxypropanol (3-NOP) and red seaweed (Asparagopsis taxiformis) have shown significant potential in reducing methane production during digestion. Studies indicate that 3-NOP can decrease methane emissions by approximately 30% in dairy cows, while red seaweed has been shown to reduce emissions by up to 80% in beef cattle. These additives work by inhibiting specific enzymes involved in methane synthesis within the rumen, thereby lowering the overall greenhouse gas output from ruminant livestock.

In addition to dietary strategies, advancements in manure management have been explored to further reduce environmental impacts i.e., solid-liquid separation, anaerobic digestion, acidification, vermifiltration. Anaerobic digestion (AD) systems convert livestock manure into biogas, which can be used as a renewable energy source. This process not only mitigates methane emissions but also offers economic benefits by reducing fossil fuel expenses and generating income from excess energy production. However, the economic viability of AD systems can be influenced by factors such as operational costs and the scale of implementation. Therefore, while AD presents a promising approach to sustainable manure management, careful consideration of these factors is essential for its successful adoption in livestock operations.

Future Plans

Future studies on mitigating dairy emissions should focus on integrated approaches across enteric fermentation, manure management, and land application. Research into dietary interventions, such as precision feeding strategies and methane-reducing feed additives like seaweed, tannins, and essential oils, could help lower enteric methane emissions while maintaining animal productivity. Advances in microbiome research could further refine these approaches by identifying specific gut microbial populations that reduce methane production. Additionally, long-term studies on genetic selection for low-methane-emitting cattle could offer a sustainable mitigation strategy without compromising milk yield.

For manure systems and applications, future research should prioritize optimizing anaerobic digestion efficiency to maximize methane capture and energy recovery while reducing residual emissions. Innovative manure amendments, such as biochar or nitrification inhibitors, could limit methane and nitrous oxide release during storage and land application. Studies on precision manure application techniques, including low-disturbance injection and variable-rate spreading, could enhance nutrient use efficiency while minimizing emissions. Furthermore, landscape-scale modeling should be developed to assess the cumulative effects of these strategies and guide policy recommendations for sustainable dairy farming.

Authors

Presenting & corresponding author

Gilbert Miito, Assistant Professor & Extension Specialist — Air Quality, University of Idaho, gmiito@uidaho.edu

The authors are solely responsible for the content of these proceedings. The technical information does not necessarily reflect the official position of the sponsoring agencies or institutions represented by planning committee members, and inclusion and distribution herein does not constitute an endorsement of views expressed by the same. Printed materials included herein are not refereed publications. Citations should appear as follows. EXAMPLE: Authors. 2025. Title of presentation. Waste to Worth. Boise, ID. April 7-11, 2025. URL of this page. Accessed on: today’s date. 


Can Environmental Data Spark a Circular Economy? Exploring the Potential of a California Dairy Manureshed

Purpose

California’s San Joaquin Valley (SJV) has uniquely “wicked” problems with nitrogen (N) management as it is a highly productive agricultural region where many communities rely on nitrate-contaminated groundwater for drinking. Some of this N loading is attributed to manure from dairies whose N output often exceeds the requirement of forage N, resulting in surplus manure N. The counties in the SJV have the worst groundwater quality and represent the 8 highest dairy populations. But, they also make up 7 of the 10 counties with the highest fertilizer inputs which also contributes to groundwater degradation. There is no doubt that California dairies contribute to N loading, but they also hold unique potential to utilize their surplus manure N to replace a portion of the 550,000 tons of N fertilizer applied to California’s diverse agricultural production. If appropriate measures are taken, the California dairy industry is well positioned to improve water quality in California by limiting its own excess N application while simultaneously replacing its neighbors’ synthetic inputs. The purpose of this preliminary manureshed analysis is to: 1) identify where surplus manure may become a primary N resource in California and 2) quantify its potential to reduce synthetic fertilizer inputs.

Past manureshed analyses have demonstrated manure’s potential to address crop nutrient requirements while acknowledging difficulties with pathogens, lack of spatially available data for CAFOs, and unpredictable manure nutrient variability within and across facilities. A California manureshed is uniquely challenging because of its large proportion of human-consumed crops and surplus dairy manure, which has a low value-to-mass ratio. However, there has been a concerted effort from government entities and the dairy industry to properly account for dairy manure properties to understand the potential expansion of a dairy manure market. Part of this effort has led to reporting requirements, leading to an abundance of facility-level data including location and N generated. These data can be analyzed to understand the economic and environmental potential of using dairy manure beyond its current practices.

What Did We Do?

We applied past manureshed approaches with California-specific data to understand available dairy manure and crop N need in 2021, which was the most recent crop data available to the authors at the time of publishing these proceedings.

To account for N generated on each dairy, we used the herd data from the California Dairy & Livestock Database (CADD), compiled by the California Air Resources Board. We assumed a milk cow produced 70 lbs of milk a day and, per the ASABE standard, that resulted in 0.92 lbs N per milk cow per day. A calf, dry cow, and heifer were assumed to produce 0.14, 0.5, and 0.26 lbs N per animal per day, respectively.

To calculate recoverable plant available N (PAN) (Figure 1) from manure generated on-farm, we assumed that 30% was lost to ammonia before any land application (Chang et al. 2006) and that manure was 21% organic matter (with 30% of that becoming plant available) and 79% inorganic (NH4+). Of the inorganic fraction available for land application, we assumed that 40% was lost to leaching, volatilization, or denitrification (Chang et al. 2006). We acknowledge that these assumptions about manure handling and, therefore, N forms and transformations are highly variable depending on local conditions, but we feel confident that this represents an accepted target “average” as described by Chang et al. 2006. This paper is a result of an expert panel review and informed California’s current regulatory framework for dairies. We also highlight that our “recoverable” manure only includes that year’s plant available portion and does not account for organic N from previous manure applications that may be contributing to actual available N.

Figure 1: Assumptions to calculate recoverable plant available N

For crop N needs, we first identified farm boundaries and crops grown (up to 4 per year) based on LandIQ data and fertilizer N requirements from the California Crop Fertilization Guidelines and average county yields from USDA NASS. We assigned each LandIQ polygon a value for fertilizer N required (Figure 2). We summed N fertilizer requirements for all land polygons that were within 2, 5, and 10 miles of each dairy. A polygon was considered within a specified distance of a dairy based on the distance from any edge of the field to the latitude/longitude provided in the CADD database. Finally, all fertilizer requirements were multiplied by 1.16 to account for a 60% efficiency for manure and a 70% efficiency for fertilizer.

To determine (hypothetically) allocated manure to nearby fields, we used the Ford Fulkerson algorithm to maximize flow. This algorithm was necessary because there are areas with significant concentration of dairies (Figure 3). Therefore, if a dairy is within 2 (or 5 or 10) miles of a field, it would be competing with other dairies to supply the demand. There would be several combinations possible for each dairy (could access multiple fields) and each field (accessible by multiple dairies) (Figure 4). The algorithm maximized the amount of manure used, and prioritized forage fields (wheat/corn/grass). We assumed that a field could supply manure from multiple dairies and that a dairy could supply manure to multiple fields.

Figure 2: (Left) Recoverable Plant Available Nitrogen generated by dairy facility. (Right) N fertilizer requirement by polygon (lbs/acre) for 2021 (up to 4 crops in one year). Calculated via LandIQ (crop classification) and FREP (fertilizer recommendations, mostly pre-plant).
Figure 3: Number of dairies within 2, 5, or 10 miles of a field.
Figure 4: 5-by-5 mile area with dairies and field boundaries (actual data, chosen arbitrarily).

What Have We Learned?

Total manure N generated was 298,000 tons, and we estimate that 178,000 tons of that was plant available N (Figure 4). It should be noted that our assumptions about N loss are aligned with ambitious environmental goals and resulted in much higher recovery rates compared to NuGIS. We also make a blanket assumption about relative organic / inorganic forms. In our hypothetical exercise where this manure could be applied to all fields (prioritizing forage first) within 2 miles of dairies, 114,000 tons were allocated, leaving 64,000 tons of surplus manure N. If the boundary were expanded to 5 miles, 143,000 tons could be allocated leaving 35,000 tons of surplus manure N. Surplus manure N was only 15,000 tons if manure could be applied up to 10 miles away from dairies where 163,000 tons were applied. Note that these simulations assume that manure can be applied to any crop (including human-consumed ones), which is not currently realistic.

Figure 5: Recoverable PAN (tons) summed over 8 counties for the 2021 crop year. *Maximum manure applied to fields is hypothetical and based on the Ford Fulkerson Algorithm where the goal was to maximize flow of manure to fields from dairies within 2, 5, or 10 miles from the field’s edge.

The amount of manure available for application varied by county. In Tulare, there was still a surplus N of 10,500 tons when assuming manure could be applied to all acreage within 10 miles of a dairy (Figure 6). However, in 3 counties (Fresno, San Joaquin, Madera), all hypothetical fertilizer N requirement could be met by applying manure within just 5 miles. Merced, Stanislaus, and Kern had fertilizer requirements met by expanding the allowed distance traveled to 10 miles. The crop types that were fulfilled by manure also differed by county (Figure 7, aggregated by county of field receiving manure).

Figure 6: Recoverable nitrogen (tons) summed by 8 counties for the 2021 crop year. *Maximum manure applied to fields is hypothetical and based on the Ford Fulkerson Algorithm where the goal was to maximize flow of manure to fields from dairies within 2, 5, or 10 miles from the edge.
Figure 7: Nitrogen fertilizer requirement fulfilled by manure*, categorized by crop. *Maximum manure applied to fields is hypothetical and based on the Ford Fulkerson Algorithm where the goal was to maximize flow of manure to fields from dairies within 2, 5, or 10 miles from the edge.

The California agricultural landscape, with many fruits and vegetables that go directly to human consumption, makes our hypothetical application rate currently unviable. For example, the only dairy forage crops with substantial acreage that are currently eligible for raw manure application are wheat, alfalfa (which does not receive N), and corn. These make up between 18-44% of area within 2 miles of a dairy, and increasing the distance from a dairy up to 10 miles decreases the percentage of crops that are forage (Figure 8). In other words, the farther away from a dairy, the more likely land use is classified as a crop that would be flagged for pathogen concerns. This highlights that to effectively use manure in the SJV, there will need to be a concerted effort to address logistical issues associated with human-consumed crops. However, these crops are generally high value, and some commodities are concentrated within a county (Figure 7).

Figure 8: Crop acreage of fields around dairies. Fields were included if their edge was within 2, 5, or 10 miles of a dairy.

Future Plans

This phase of the manureshed analysis was intended to demonstrate the potential for manure to reduce fertilizer inputs; however, its practical applications are limited. In the next phase, we hope to improve our analysis by accounting for more details of manure, such as solid vs. liquid (for improved predictions of N content/transformation/transportability) and phosphorus and potassium concentration/stoichiometry. We will work with commodity groups, with a focus on those within 10 miles of dairies, to understand the current level of interest and obstacles for integrating different manure products into their cropping systems. These improvements to our methodology will result in a quantification of environmental and economic opportunity to increase the likelihood of a circular economy by expanding the use of dairy manure.

Authors

Presenting & corresponding author

Emily R Waring, Agricultural Practice Impact Analyst, Sustainable Conservation, ewaring@suscon.org

Additional authors

    • Ryan Flaherty, Senior Director of Circular Economies, Sustainable Conservation
    • Sarah Castle, Senior Scientist, Sustainable Conservation
    • John Cardoza, Project Director, Sustainable Conservation

The authors are solely responsible for the content of these proceedings. The technical information does not necessarily reflect the official position of the sponsoring agencies or institutions represented by planning committee members, and inclusion and distribution herein does not constitute an endorsement of views expressed by the same. Printed materials included herein are not refereed publications. Citations should appear as follows. EXAMPLE: Authors. 2025. Title of presentation. Waste to Worth. Boise, ID. April 7-11, 2025. URL of this page. Accessed on: today’s date.