Overview of the U.S. Agricultural Biogas Industry and AgSTAR Technical Resources

AgSTAR is a voluntary program coordinated by the U.S. Environmental Protection Agency (EPA), in cooperation with the U.S. Department of Agriculture (USDA), that supports farmers and industry in the development and adoption of anaerobic digester (AD) systems. In addition to producing biogas, AD systems can help achieve other social, environmental, agricultural and economic benefits. AgSTAR offers a variety of resources and tools to assist those interested in exploring the use of AD systems, including:

    • Outreach materials addressing system design, selection, and use and project development tools that help assess digester feasibility.
    • Events including workshops and webinars to promote sharing of knowledge, information, and experiences.
    • Website information on operating digesters, including nationwide statistics as well as in-depth project profiles that provide details on digester system design, biogas use, and benefits realized.

AgSTAR’s presentation will provide a market overview of agricultural biogas projects in the United States, including trends and outlook for the future of this sector, and highlight two resources currently under development for industry stakeholders.

What did we do?

AgSTAR’s mission is to educate and inform stakeholders on biogas production in the United States and support the development of new projects. AgSTAR has developed a number of market studies, technical tools and outreach resources for agricultural biogas projects over the years. The AgSTAR national database for digester projects contains a wealth of information on digester projects in the United States. As of January 2019, there are 248 anaerobic digesters operating on livestock farms in the US.  AgSTAR estimates that in 2018, digesters helped reduce 4.27 million metric tons of CO2 equivalent (MMTCO2e). Since 2000, digesters on livestock farms have reduced direct and indirect emissions by an estimated 39.3 MMTCO2e.

The biogas industry in the livestock sector has a lot of room to grow. AgSTAR estimates that biogas recovery systems are technically feasible at more than 8,000 large dairy and hog operations. These farms could potentially generate nearly 16 million megawatt-hours (MWh) of energy per year and displace about 2,010 megawatts (MWs) of fossil fuel-fired generation.

To meet this massive opportunity, innovation is needed.  Several policies and business models that are driving the growth in this sector include:  

    • Policies:  
      • Food Waste Diversion from Landfills
      • Renewable Natural Gas (RNG) Incentives
    • Business Models:  
      • RNG to vehicle fuel
      • Third-party owned and operated systems
      • Eco-markets for co-products

AgSTAR continues to educate stakeholders on these industry trends and encourage new opportunities.

New and Updated products coming soon!

The AgSTAR program pleased to announce two resources coming in 2019 to help facilitate the implementation of AD-biogas projects:

    • AgSTAR Project Development Handbook (3rd Edition) – The Handbook is intended for agriculture and livestock producers, farm owners, developers, investors, policymakers, implementers, and others working in agriculture or renewable energy who are interested in AD/biogas systems as a farm manure management option.  The handbook is being substantially redesigned for this 3rd edition to help users gain insight into AD and current state-of-the-art discussions on project development, economics, co-digestion feedstocks, manure management issues, including agronomic application, potential carbon impacts, and financing/operational/ownership options.  The document provides basic information about biogas production and outlines many of the considerations and questions that should be addressed when evaluating, developing, designing and implementing a farm-based digester project.
    • AgSTAR Anaerobic Digester Operator Guidebook – The Operator Guidebook is a new resource to assist on-farm AD/biogas system operators to increase operational uptime and performance and efficiency as well as to help prevent common pitfalls that can lead to system shutdown and neighbor complaints.  The Guidebook spans nearly every part of the AD and biogas production process, providing industry expert experience and advice on dealing with potential issues within an AD/biogas system. The Guidebook is designed to answer fundamental questions about what it takes to successfully operate and maintain an AD/biogas system on an agricultural operation and it can be used as a resource to maximize profitability by increasing biogas yield, improve biogas quality, and minimize operating and maintenance expenses.  It is intended for use as a training tool for AD/biogas system owners, managers, operators, and other project stakeholders.

What we have learned?

Anaerobic digesters on livestock farms can provide many benefits compared to traditional manure management systems, including:

    • Diversified Farm Revenue
    • Rural Economic Growth
    • Conservation of Agricultural Land
    • Energy Independence
    • Sustainable Food Production
    • Farm-Community Relationships

While technology choices are important when implementing AD projects, a viable business model is critical.  

Future plans

The AgSTAR Program intends to continue working with its government, academia, industry, and non-profit organization stakeholders to promote the use of biogas recovery systems to reduce methane emissions from livestock waste.  This includes sharing information on industry trends; promoting and conducting events and webinars; and preparing outreach materials and project development tools, such as the AgSTAR Project Development Handbook and Anaerobic Digester Operator Guidebook.

Authors

Nick Elger, Program Manager, U.S. EPA AgSTAR & Global Methane Initiative, Elger.Nicholas@epa.gov

Additional information

Additional information and resources can be found on the AgSTAR Program website at: https://www.epa.gov/agstar.

The authors are solely responsible for the content of these proceedings. The technical information does not necessarily reflect the official position of the sponsoring agencies or institutions represented by planning committee members, and inclusion and distribution herein does not constitute an endorsement of views expressed by the same. Printed materials included herein are not refereed publications. Citations should appear as follows. EXAMPLE: Authors. 2019. Title of presentation. Waste to Worth. Minneapolis, MN. April 22-26, 2019. URL of this page. Accessed on: today’s date.

Considerations in Evaluating Manure Treatment Systems for Dairy Farms

Advanced manure treatment may become a major system on some dairy farms in the future.  Reducing the impacts of excess nitrogen and or phosphorous may be necessary on farms with a limited or remote land base.  Additional treatments to recover solids, extract energy, concentrate nutrients, reduce odors, reduce the mass/volume, and/or reduce pathogens may become more of a priority as farms seek to move toward sustainability.  Potential systems should be evaluated from many perspectives including on an economic and effectiveness basis. There are many variables to consider in evaluating a manure management system. Potential systems should be selected based on many criteria including:  operational history, operational reliability, market penetration, capital cost, O&M cost, value proposition, and vendor information and documentation including case studies and customer reviews.

What did we do?

Manure management formally started in the second half of the 20th century with the development and implementation of the water quality best management practice (BMP) of long-term manure storage.  Storage provides farms with the opportunity to recycle manure to cropland when applied nutrients can be more efficiently used by the crop.  Many long-term manure storages were built to improve nutrient recycling and minimize risk. In some cases, anaerobic lagoons were built to both reduce the organic matter spread to fields and store manure.  Simultaneously as poultry and livestock consolidation escalated, more manure storages were built and their volume increased to reflect the recognized need to store manure longer. Cooperative Extension, Soil and Water Conservation Districts and Natural Resources Conservation Service have assisted in providing planning, design, construction and maintenance of these manure storage systems.

What have we learned?

Many lessons have been learned from storing manure long-term.  They include, but are not limited to:

    • While storing manure long-term reduces water quality impairment, it also produces and emits methane, a greenhouse gas.  Greenhouse gases are reported to contribute to global warming. The US dairy industry is under attack by some because of this, and it is likely that the decline in fluid milk sales has, in some part, been affected by this.  The lesson learned here is that the implementation of BMPs can have unintended consequences; therefore, all future BMPs need to be thoroughly vetted before substantial industry uptake happens in order to avoid undesirable unintended consequences.
    • Larger long-term storages are better than short-term (smaller) ones.  Storages that store manure for a longer period of time provide farms with increased flexibility when it comes to recycling manure to cropland.
    • Long-term storages can emit odors that can be offensive to neighbors and communities.  Farms have adopted improved manure spreading practices, namely direct incorporation, to reduce odor issues but incorporation doesn’t work well on some crops.  Some farms have also adopted anaerobic digestion as a long-term storage pre-treatment step in order to reduce odor emissions from storage and land application.
    • Substantial precipitation can accumulate in long-term storages located on farms in humid climates.  Increased storage surface area (generally an outcome of building larger storages) results in more precipitation to store and handle as part of the manure slurry.  Every acre-foot of net perception results in 325,900 gallons of additional slurry to store and spread. If each manure spreader load is 5,000 gallons, then this means 65 additional loads are required.
    • Neighbors of larger farms are more sensitive to intensive truck traffic than regular but low-level truck traffic.  Long-term storages require intensive, focused effort to empty and the over the road truck traffic can be offensive in some farm locations.
    • Insufficient storage duration results in the need to recycle manure to cropland during inopportune times and thus may not be contributing to the BMP goal.  Fall spreading is still required on many farms; however, it also may be unlikely that a sufficient spring planting window exists for farms to spread all their manure in the spring, avoid compacting wet soils and also get spring crops planted in time.
    • Where longer term storage duration and or incorporation of the manure to prevent odor emissions is needed to facilitate spring and summer manure spreading, farms may have more manure nutrients than needed to meet crop demand.

Future Plans

The above lessons learned support the need for advanced manure treatment systems on some farms that can also be used as the basis for considerations that should be included when evaluating all manure treatment systems.  It is important that the manure treatment equipment/system components and the overall system address the farm need(s) as best as possible. A challenge with evaluating the existing manure treatment equipment available to the farmer is the lack of performance and economic data.  Comparatively, advanced manure treatment (we define this as treatment above basic primary solid-liquid separation) is in its infancy stage of adoption and thus little field performance data exists. Our plans are to continue (as funding allows) to perform more on-farm manure treatment system evaluations and to report facts to our US dairy industry stakeholders.

Corresponding author, title, and affiliation

Curt Gooch, Environmental Systems Engineer, PRO-DAIRY Dairy Environmental System Program, Dept. of Animal Science, Cornell University

cag26@cornell.edu

Other authors

Peter Wright, Agricultural Engineer, PRO-DAIRY Dairy Environmental System Program, Dept. of Animal Science, Cornell University

Additional information

Additional project information, including reports about on-farm assessment of manure treatment systems, is available on the Dairy Environmental System Program webpage: www.manuremanagement.cornell.edu

Acknowledgements

New York State Department of Agriculture and Markets for their continued financial support of the PRO-DAIRY Program, the New York State Energy Research and Development Authority (NYSERDA) for funding many on-farm sponsored projects, and the US dairy farmers who have collaborated with us for over three decades.

The authors are solely responsible for the content of these proceedings. The technical information does not necessarily reflect the official position of the sponsoring agencies or institutions represented by planning committee members, and inclusion and distribution herein does not constitute an endorsement of views expressed by the same. Printed materials included herein are not refereed publications. Citations should appear as follows. EXAMPLE: Authors. 2019. Title of presentation. Waste to Worth. Minneapolis, MN. April 22-26, 2019. URL of this page. Accessed on: today’s date.

Newtrient Manure Technology Catalog: An On-line Resource for Farmers, Their Key Advisors and Others Involved in Dairy Manure Management

Looking at the manure-management technologies that currently exist and the new and emerging technologies, Newtrient provides a reliable, third-party technology evaluation tool for the dairy industry. Three years of time and effort has been put into evaluating almost 300 technologies that are included in the catalog, over half of which are related to biogas production or digestate management. Newtrient launched an open-source, technology catalog in 2017 that provides a comprehensive listing of relevant and readily available dairy manure management technologies in the U. S.

What we do?

The U.S. dairy industry is voluntarily playing a critical role in working “towards sustainability” (Scott & Gooch, 2017). As a result of industry consolidation, manure treatment technologies are being developed and marketed that target larger operations. The goal is to help farms work on continuous improvement on sustainability issues while operating at larger scale. Unfortunately, the efficacy and economics of the treatment technologies are not always well established. As a result, the relative costs and impacts are often difficult to compare, although its importance is realized.

Newtrient, on behalf of the U.S. dairy industry, formed a Technology Assessment Team (TAT) in 2016, comprised of a cross section of academic and industry professionals with in-depth expertise in dairy manure management. One of the first tasks assigned to the TAT was to conduct systematic verification and catalog available dairy manure treatment technologies in the United States. The ongoing effort by Newtrient is to identify and evaluate available dairy manure treatment technologies which has resulted in the Newtrient online Technology Catalog (Catalog) with over 240 entries (Newtrient, 2019).

Lessons Learned?

Many lessons have been learned during the development of the Newtrient Technology Catalog.  One of the most important is that it is necessary to develop a standard, easy to use way of presenting the information on many differing technologies and companies, the Newtrient TAT does this in a variety of ways including:

    • Company description – We work with each vendor to provide a brief description of the company, its mission and its history.
    • Technology description – A succinct and informative overview of the technology and how it works is the goal and this, combined with an image or flow chart, is often enough for the average visitor.
    • Business information – A vendor-completed Newtrient Business Information Request (BIR) form can be viewed or downloaded when additional information is desired.
    • Technology information – A vendor-completed Newtrient Technology Information Request (TIR) is also available on line providing additional technical details including what it takes to install and make the technology work.
    • Expert reviews – Expert opinion and evaluation of technologies from the Newtrient TAT provide insight and perspective that is not available anywhere else.
    • Newtrient 9-Point Score – A quick and intuitive visual reference that provides answers to 9 specific questions in three categories, chosen to help set a standard for technologies and a basis for comparison. The nine points include the following:
        • COMMERCIAL VIABILITY
          • OPERATIONAL HISTORY – Is this technology currently operational on at least three North American dairy farms?
          • OPERATIONAL RELIABILITY – Does this technology have record of reliable performance of more than 12 months at each of at least three farms?
          • MARKET PENETRATION – Has this technology been installed on at least 10 North American dairy farms?
        • ECONOMICS & INDUSTRY VALUE
          • CAPITAL COST – Has information on the installed capital costs been clearly defined and communicated to the Newtrient TAT?
          • OPERATIONS AND MAINTENANCE COST – Are the actual operations and maintenance costs clearly defined and communicated to the Newtrient TAT?
          • VALUE PROPOSITION – Does this technology or the products it makes, deliver to the farm identifiable economic, environmental, or community value (e.g. reduced cost, increased income, reduced odor, improved nutrient use, etc.)?
        • TRANSPARENCY & INTERACTION
          • VENDOR INFORMATION SHARING – Has the company provided complete and verified Newtrient BIR and TIR documents to Newtrient?
          • CASE STUDY – Has a case study demonstrating the performance claimed by the vendor been completed by the Newtrient TAT?
          • CUSTOMER REVIEWS – When asked how likely is it they would recommend this technology to a colleague; have at least three customers scored the technology at least a 7 out of 10?
    • Highlighting Technologies – Newtrient reviews technologies and provides recognition for those that have proven themselves, show potential or have not engaged with Newtrient but are actively marketing to dairymen. The three categories are:
      • Newtrient Recognized:  for technologies that are proven in the field.
      • Emerging Technology:  for technologies that show significant promise.
      • Not Vendor Verified:  for vendors who have not worked with Newtrient to verify and validated the information regarding their business or technology.
    • Newtrient Evaluation & Assessment of Technologies (NEAT) – After the catalog was first introduced it became obvious that there was additional work that was needed regarding the impact of each technology on key environmental areas.  In response, the TAT developed the NEAT process for evaluating technologies and their impacts on six key areas (see accompanying paper presented at this conference on the NEAT process).

Future Plans

The Newtrient Technology Catalog is ever changing and being updated; new technologies are added regularly, BIRs and TIRs are updated, new case studies are written, and new functionality is added regularly. The catalog was recently updated to accommodate outcomes of applying the NEAT process to select technology types.  Additionally, the TAT is evaluating inclusion of the following:

    • NRCS Conservation Practice Standards and guide to USDA grant programs
    • Feed and manure additives with a system for comparing their efficacy and economics
    • Directories of resources for help in nutrient management planning, engineering, and other professional services related to manure treatment/nutrient management
    • Expanding and updating the Newtrient TIR to include all of the information needed to qualify a technology for USDA grant and cost share programs

Author

Mark Stoermann, Chief Operating Officer, Newtrient LLC.

mstoerm@newtrient.com

Other authors

Curt Gooch, Environmental Systems Engineer, PRO-DAIRY Dairy Environmental System Program, Dept. of Animal Science, Cornell University.

Additional information

Additional information, including business information, technical information and case studies on technologies, is available on the catalog page of the Newtrient website: https://www.newtrient.com

Acknowledgements

Newtrient, LCC and the papers authors thank the following supporters of Newtrient: Agri-Mark, Inc.; Dairy Farmers of America, Inc.; Dairy Management Inc.; Foremost Farms USA; Land O’Lakes, Inc.; Maryland Virginia Milk Producers Cooperative Association, Inc.; Michigan Milk Producers, National Milk Producers Federation; Prairie Farms Dairy, Inc.; Prairie Farms Dairy, Inc.; Select Milk Producers, Inc.; Southeast Milk, Inc.;  St. Albans Cooperative Creamery; Tillamook County Creamery Association; and United Dairymen of Arizona.

The authors are solely responsible for the content of these proceedings. The technical information does not necessarily reflect the official position of the sponsoring agencies or institutions represented by planning committee members, and inclusion and distribution herein does not constitute an endorsement of views expressed by the same. Printed materials included herein are not refereed publications. Citations should appear as follows. EXAMPLE: Authors. 2019. Title of presentation. Waste to Worth. Minneapolis, MN. April 22-26, 2019. URL of this page. Accessed on: today’s date.

Fate of Antimicrobials during Dairy Manure Management and Processing

The effect of anaerobic digestion (AD) and composting manure management strategies on antimicrobial resistance (AMR) was explored at the farm and bench-scale. At the farm-scale, a collaborative project investigated the fate of antibiotics and antimicrobial resistance genes (ARGs) during manure handling, treatment, and storage at 11 dairy farms. Results showed that antimicrobials were not consistently removed during manure treatment, with most samples below detection limit, yet, others showing concentrations up to 34,000 ng/g DW in the AD effluent, for example. Antimicrobials also did not degrade significantly during field-scale composting. The farm-scale results illuminated limitations of tracking antimicrobials in complex manure treatment systems with varying manure treatment practices, retention times, and heterogeneous manure substrates. At the bench-scale, triplicate reactors with tetracycline (TC) and sulfadimethoxine (SDM) additions of 1 and 10 mg/L were digested with dairy manure and inoculum for 44-days. The AD process degraded 85% of antimicrobials at the bench-scale. There was a 99% reduction of SDM during AD. The AD reactors with TC additions showed more variability in degradation products. The ARG analysis showed that TetM gene copies decreased during AD and correlated with declines in TC, however, reductions in SDM did not correlate with decreases in Sul1 gene copies. Overall, our results showed that dairy farm antibiotics usage varies significantly from farm to farm, with occasional short-term spikes in usage in response to the treatment of illness/infection outbreaks, and therefore, tracking these spikes through complex manure handling systems proved challenging. The settling, separation, and differing retention times of solids throughout manure handling processes also made whole-farm analyses challenging, as recovery rates in the extraction process for testing antimicrobials in the laboratory varied with solid-based and liquid-based manure samples.

Authors

Stephanie Langsing, University of Maryland, slansing@umd.edu

Schueler, Jenna (University of Maryland); Crossette, Emily (University of Michigan); Naas, Kayla (University of Buffalo); Hurst, Jerod (University of Buffalo); Oliver, Jason (Cornell University); Raskin, Lutgarde (University of Michigan); Wigginton, Krista (University of Michigan); Gooch, Curt, (Cornell University); Aga Diana (University of Buffalo)

The authors are solely responsible for the content of these proceedings. The technical information does not necessarily reflect the official position of the sponsoring agencies or institutions represented by planning committee members, and inclusion and distribution herein does not constitute an endorsement of views expressed by the same. Printed materials included herein are not refereed publications. Citations should appear as follows. EXAMPLE: Authors. 2019. Title of presentation. Waste to Worth. Minneapolis, MN. April 22-26, 2019. URL of this page. Accessed on: today’s date.

Antibiotic Measurement and Recovery in Manure and Impacts on Antimicrobial Resistance in Agricultural Settings

Antimicrobial resistance (AMR) has been exacerbated through anthropogenic sources of antibiotics, with antibiotics use in animal production being a possible contributor to AMR. On dairy and beef cattle operations, different classes of antibiotics are administered in response to an infection, or as a prophylactic to prevent infection. The connection between cattle antibiotic use and AMR development in human pathogens is uncertain. To better understand this possible connection (and associated risks), we need improved knowledge of the fate and transport of antibiotics in livestock manure. This necessitates quantification of antibiotics in complex organic matrices. The challenges in measuring antibiotics in animal husbandry result from the heterogeneity of manure with varying manure treatment and handling systems. Typically, antibiotic extraction procedures focus on a single class of antibiotic; however, the goal of this study was to optimize one extraction method for multiple classes of antibiotics in cattle manure. Four classes of antibiotics were targeted: tetracyclines, macrolides, sulfonamides, and beta-lactams. The beta-lactams, penicillin G, ampicillin, ceftiofur, and two lactam metabolites were of specific interest because of their prevalent use for treatment and prevention of mastitis in dairy cows and difficulty to detect in manure extracts. Two manure preservation methods were considered: frozen and freeze-dried. Tested extraction methods included: accelerated solvent extraction, liquid-liquid extraction, solid phase extraction, and salting out. None of the direct extraction procedures produced sufficient recoveries for the beta-lactams. A derivatization method that hydrolyzed the beta-lactam group with piperidine prior to extraction improved recoveries. Antibiotic extraction efficiencies from cattle manure, determined using reverse phase HPLC tandem MS-MS analyses after preservation and extraction, will be presented in full.

Authors


Andrea Yarberry, Beltsville Agricultural Research Center, ORISE Participant, United States Department of Agriculture, ayarberry@gmail.com

Rice, Clifford (Agricultural Research Center, Sustainable Agricultural Systems Laboratory, United States Department of Agriculture, Beltsville, MD, USA); Poindexter, Carlton (Department of Environmental Science and Technology, University of Maryland, College Park, MD, USA); Lansing, Stephanie (Department of Environmental Science and Technology, University of Maryland, College Park, MD, USA)

Acknowledgements

This research was supported in part by an appointment to the Agricultural Research Service (ARS) Research Participation Program administered by the Oak Ridge Institute for Science and Education (ORISE) through an interagency agreement between the U.S. Department of Energy (DOE) and the U.S. Department of Agriculture (USDA). ORISE is managed by ORAU under DOE contract number DE-SC0014664. All opinions expressed in this paper are the author’s and do not necessarily reflect the policies and views of USDA, ARS, DOE, or ORAU/ORISE.


The authors are solely responsible for the content of these proceedings. The technical information does not necessarily reflect the official position of the sponsoring agencies or institutions represented by planning committee members, and inclusion and distribution herein does not constitute an endorsement of views expressed by the same. Printed materials included herein are not refereed publications. Citations should appear as follows. EXAMPLE: Authors. 2019. Title of presentation. Waste to Worth. Minneapolis, MN. April 22-26, 2019. URL of this page. Accessed on: today’s date.

Cataloging and Evaluating Dairy Manure Treatment Technologies


Proceedings Home | W2W Home w2w17 logo

Purpose

To provide a forum for the introduction and evaluation of technologies that can treat dairy manure to the dairy farming community and the vendors that provide these technologies.

What Did We Do?

Newtrient has developed an on-line catalog of technologies that includes information on over 150 technologies and the companies that produce them as well as the Newtrient 9-Point scoring system and specific comments on each technology by the Newtrient Technology Advancement Team.

What Have We Learned?

Our interaction with both dairy farmers and technology vendors has taught us that there is a need for accurate information on the technologies that exist, where they are used, where are they effective and how they can help the modern dairy farm address serious issues in an economical and environmentally sustainable way.

Future Plans

Future plans include expansion of the catalog to include the impact of the technology types on key environmental areas and expansion to make the application of the technologies on-farm easier to conceptualize.

Corresponding author name, title, affiliation  

Mark Stoermann & Newtrient Technology Advancement Team

Corresponding author email address  

info@newtrient.com

Other Authors 

Garth Boyd, Context

Craig Frear, Regenis

Curt Gooch, Cornell University

Danna Kirk, Michigan State University

Mark Stoermann, Newtrient

Additional Information

http://www.newtrient.com/

Acknowledgements

All of the vendors and technology providers that have worked with us to make this effort a success need to be recognized for their sincere effort to help this to be a useful and informational resource.

The authors are solely responsible for the content of these proceedings. The technical information does not necessarily reflect the official position of the sponsoring agencies or institutions represented by planning committee members, and inclusion and distribution herein does not constitute an endorsement of views expressed by the same. Printed materials included herein are not refereed publications. Citations should appear as follows. EXAMPLE: Authors. 2017. Title of presentation. Waste to Worth: Spreading Science and Solutions. Cary, NC. April 18-21, 2017. URL of this page. Accessed on: today’s date.

USDA-NRCS and the National Air Quality Site Assessment Tool (NAQSAT) for Livestock and Poultry Operations

Proceedings Home | W2W Home w2w17 logo

Purpose

The National Air Quality Site Assessment Tool (NAQSAT) was developed as a first-of-its-kind tool to help producers and their advisors assess the impact of management on air emissions from livestock and poultry operations and identify areas for potential improvement related to those air emissions.

What did we do?

In 2007, several land-grant universities, with leadership from Michigan State University, began developing NAQSAT under a USDA-NRCS Conservation Innovation Grant (CIG). The initial tool included beef, dairy, swine, and poultry operations. A subsequent CIG project, with leadership from Colorado State University, made several enhancements to the tool, including adding horses to the species list. In 2015, USDA-NRCS officially adopted NAQSAT as an approved tool for evaluating air quality resource concerns at livestock and poultry operations. USDA-NRCS also contracted with Florida A&M University in 2015 to provide several regional training workshops on NAQSAT to NRCS employees. Six training workshops have been completed to date (Raleigh, NC; Modesto, CA; Elizabethtown, PA; Lincoln, NE; Richmond, VA; and Yakima, WA) with assistance from multiple NAQSAT development partners. Additionally, USDA-NRCS revised its comprehensive nutrient management plan (CNMP) policy in October 2015 to make the evaluation of air quality resource concerns mandatory as part of CNMP development.

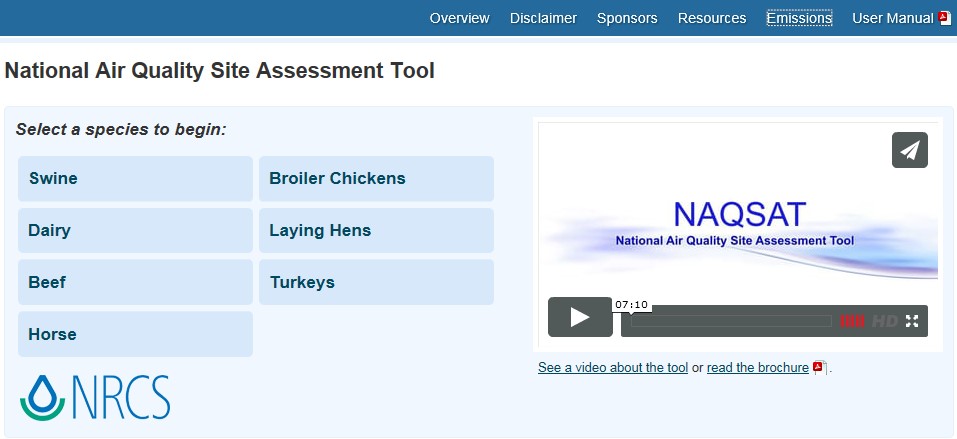
Snippet from website of the National Air Quality Site Assessment Tool

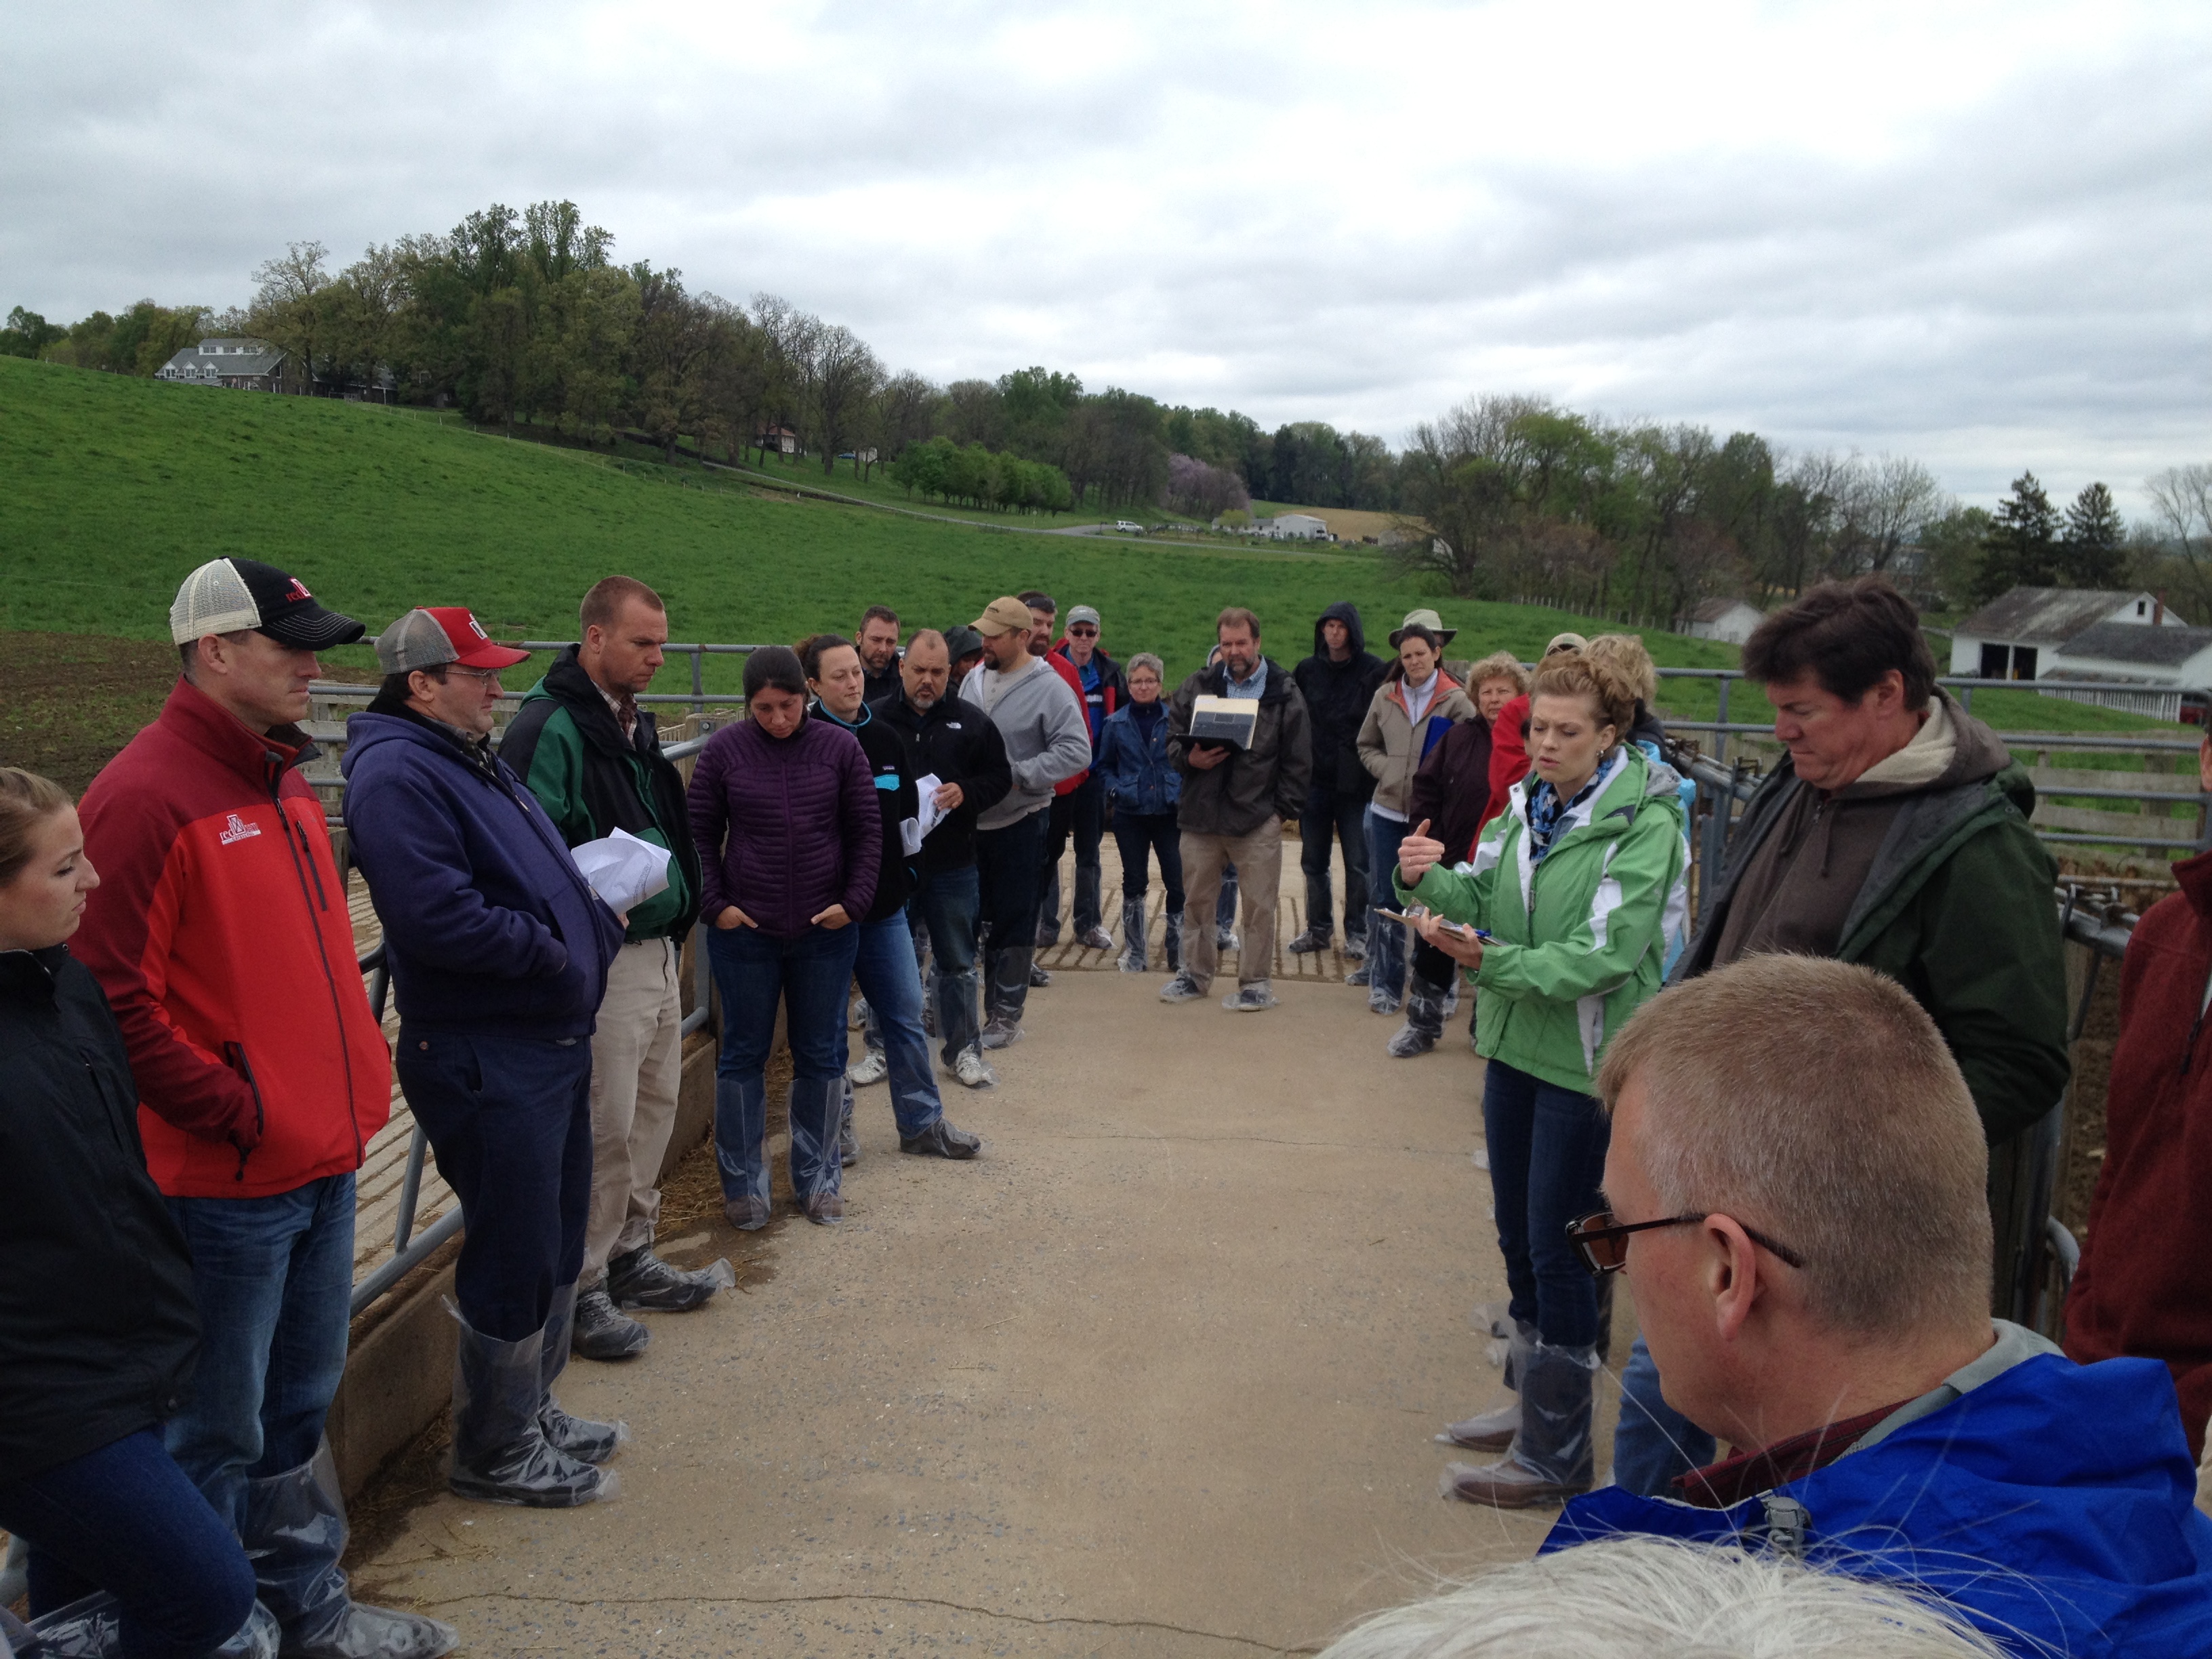
Group photo of team in field

Zwicke in class lecturing

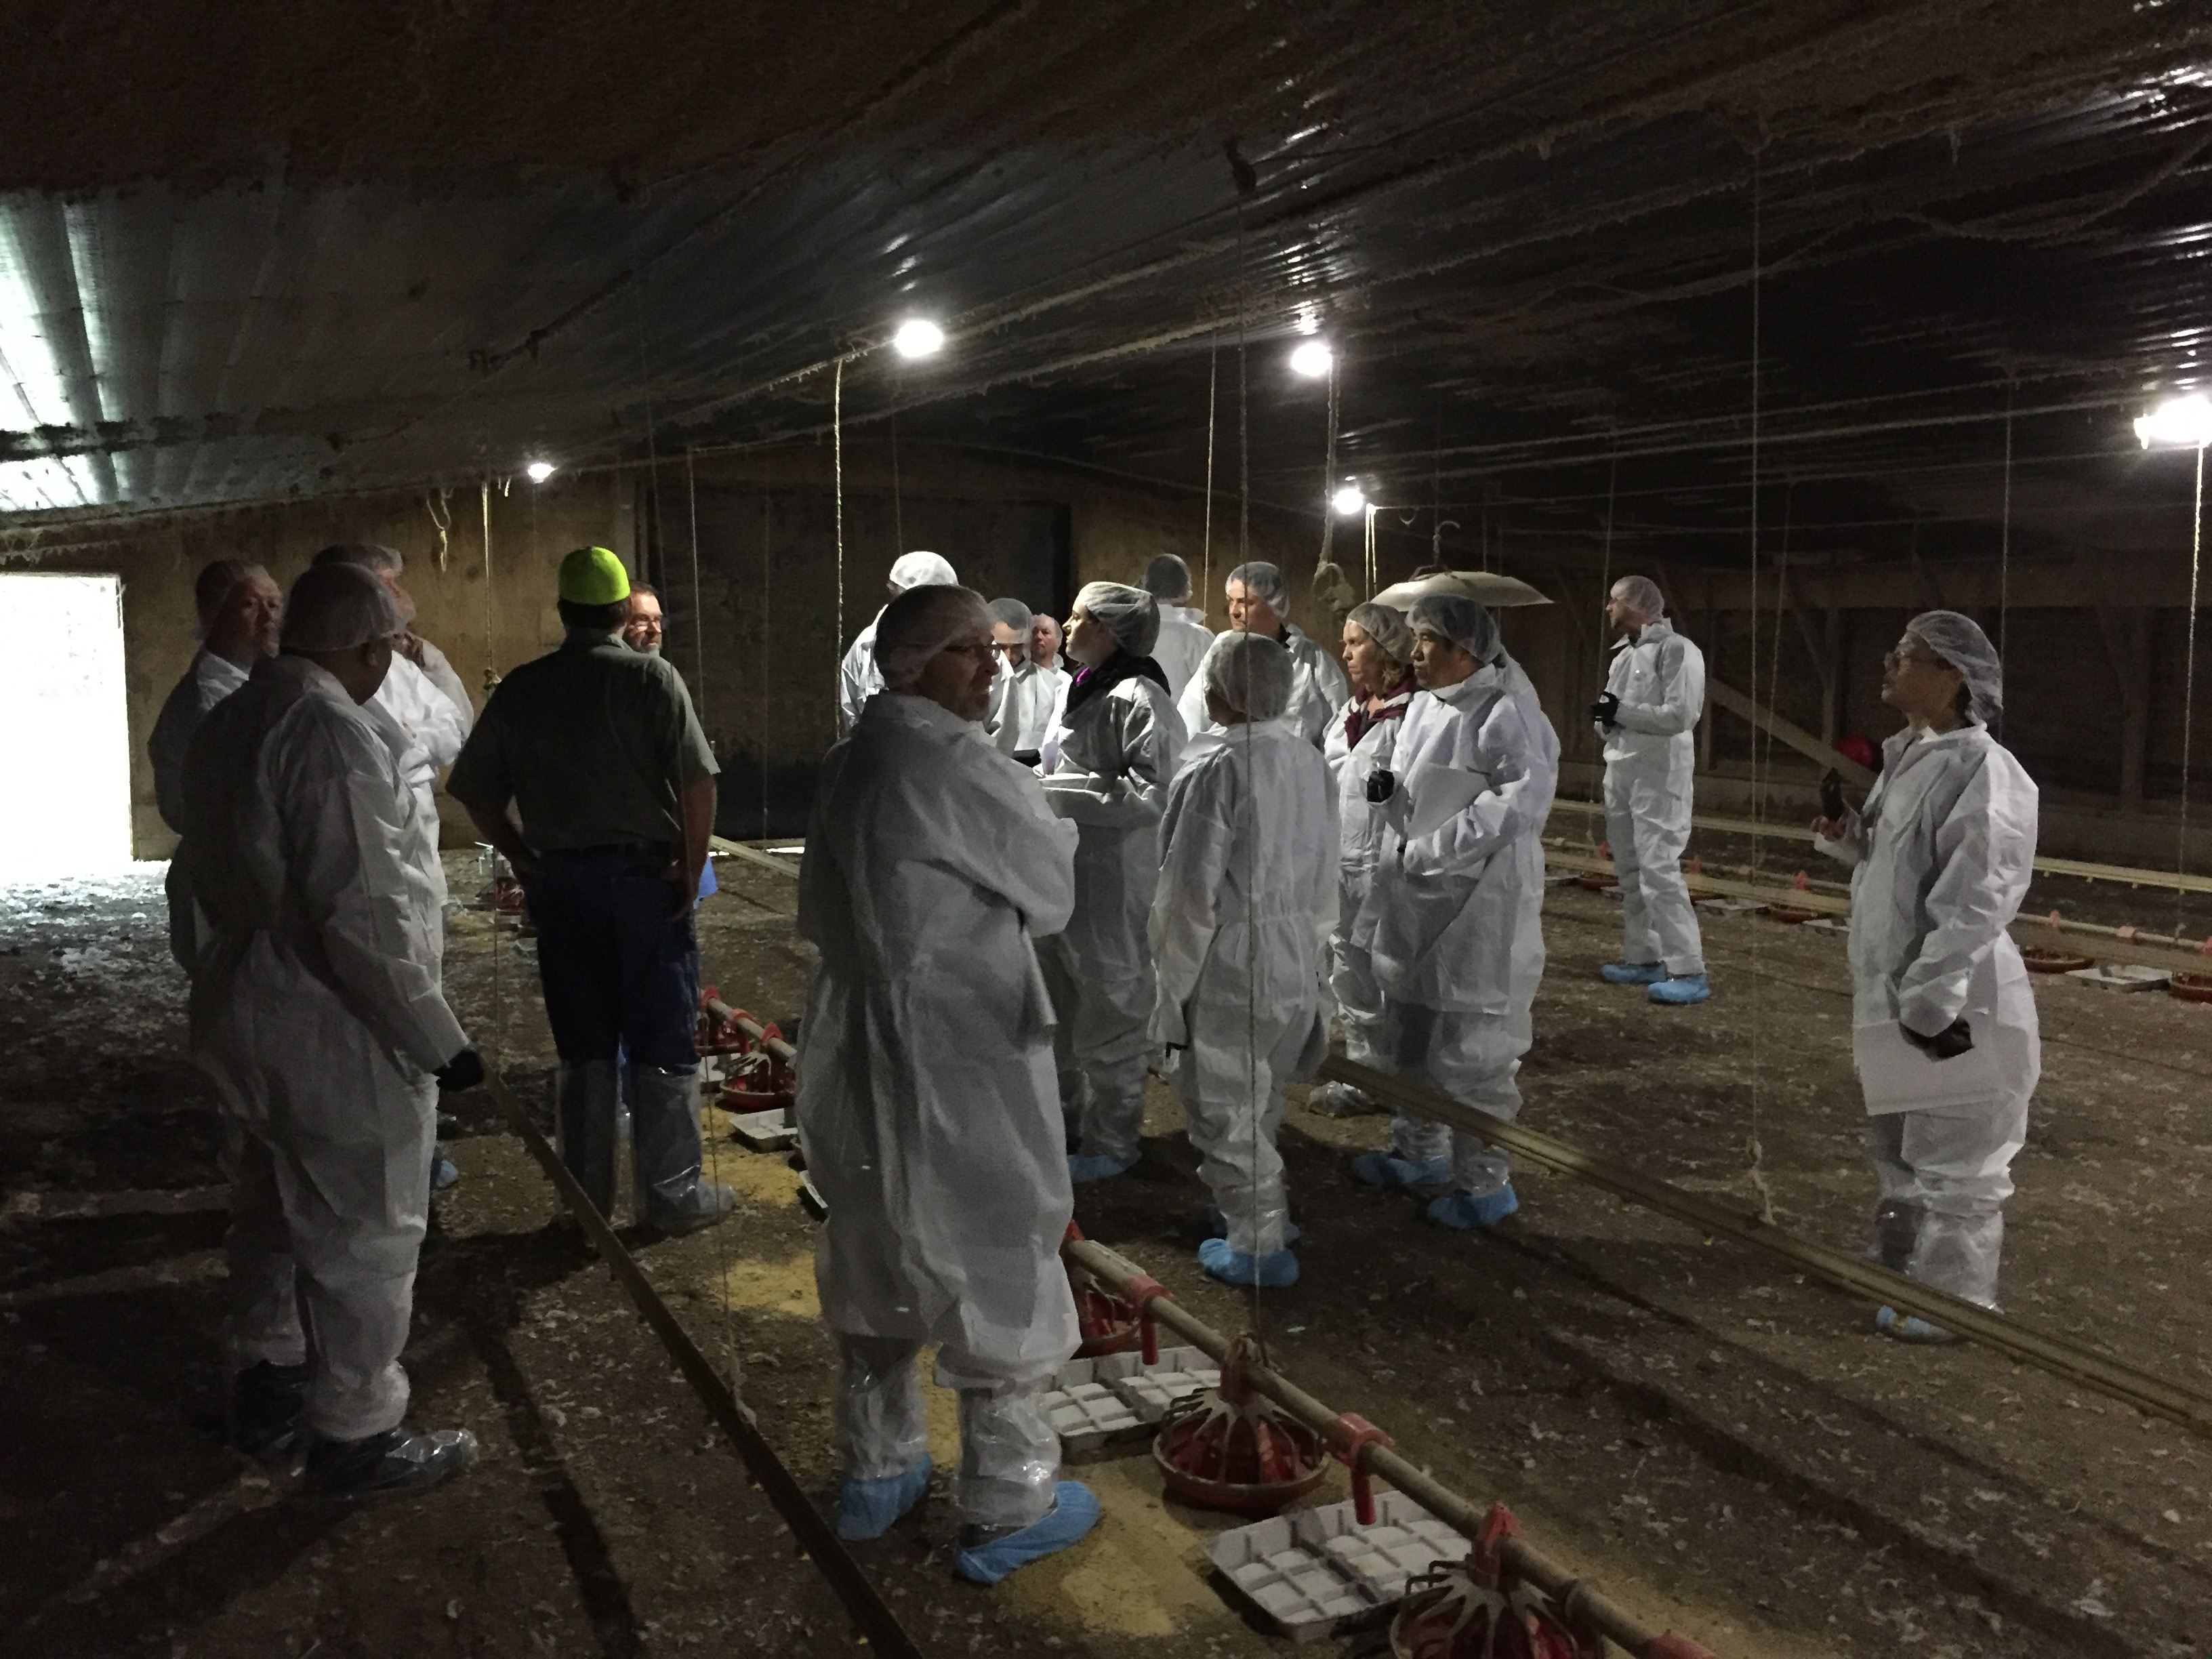
Zwicke and group in animal housing facility

What have we learned?

NAQSAT has proven to be a useful tool for bench-marking the air emissions impacts of current management on confinement-based livestock and poultry operations. In the training sessions, students have been able to complete NAQSAT runs on-site with the producer or producer representative via tablet or smartphone technologies. Further classroom discussion has helped to better understand the questions and answers and how the NAQSAT results can feed into the USDA-NRCS conservation planning process. Several needed enhancements and upgrades to the tool have been identified in order to more closely align the output of the tool to USDA-NRCS conservation planning needs. NAQSAT has also proven to be useful for evaluating the air quality resource concern status of an operation in relation to the CNMP development process.

Future Plans

It is anticipated that the identified needed enhancements and upgrades will be completed as funding for further NAQSAT development becomes available. Additionally, as use of NAQSAT by USDA-NRCS and our conservation planning and CNMP development partners expands, additional training and experience-building opportunities will be needed. The NAQSAT development team has great geographic coverage to assist in these additional opportunities.

Corresponding author, title, and affiliation

Greg Zwicke, Air Quality Engineer – Air Quality and Atmospheric Change Team, USDA-NRCS

Corresponding author email

greg.zwicke@ftc.usda.gov

Other authors

Greg Johnson, Air Quality and Atmospheric Change Team Leader, USDA-NRCS; Jeff Porter, Animal Nutrient and Manure Management Team Leader, USDA-NRCS; Sandy Means, Agricultural Engineer – Animal Nutrient and Manure Management Team, USDA-NRCS

Additional information

naqsat.tamu.edu

https://lpelc.org/naqsat-for-swine-and-poultry

https://lpelc.org/naqsat-for-beef-and-dairy/

Acknowledgements

C.E. Meadows Endowment, Michigan State University

Colorado Livestock Association

Colorado State University

Florida A&M University

Iowa Turkey Federation

Iowa Pork Producers

Iowa Pork Industry Center

Iowa State University

Iowa State University Experiment Station

Kansas State University

Michigan Milk Producers Association

Michigan Pork Producers Association

Michigan State University

Michigan State University Extension

National Pork Board

Nebraska Environmental Trust

Oregon State University

Penn State University

Purdue University

Texas A&M University

University of California, Davis

University of Georgia

University of Georgia Department of Poultry Science

University of Idaho

University of Maryland

University of Maryland Department of Animal and Avian Sciences

University of Minnesota

University of Missouri

University of Nebraska

USDA-ARS

Virginia Tech University

Washington State University

Western United Dairymen

Whatcom County (WA) Conservation District

The authors are solely responsible for the content of these proceedings. The technical information does not necessarily reflect the official position of the sponsoring agencies or institutions represented by planning committee members, and inclusion and distribution herein does not constitute an endorsement of views expressed by the same. Printed materials included herein are not refereed publications. Citations should appear as follows. EXAMPLE: Authors. 2017. Title of presentation. Waste to Worth: Spreading Science and Solutions. Cary, NC. April 18-21, 2017. URL of this page. Accessed on: today’s date.

Estimating the Economic Value of the Greenhouse Gas Reductions Associated with Dairy Manure Anaerobic Digestion Systems Located in New York State

Proceedings Home W2W Home w2w17 logo

Purpose

There is a worldwide concern in controlling the anthropogenic emissions of greenhouse gas (GHG) emissions. GHGs pertinent to this paper, include carbon dioxide (CO2), methane (CH4), and nitrous oxide (N2O) and are measured in CO2 equivalents (CO2 eq.). On a 100-year basis, CH4 is 34 times as potent as CO2, while N2O is 298 times as potent as CO2 (IPCC, 2013); CO2 eq. is referred to as the global warming potential (GWP) of these gases. The carbon from feed used on a dairy farm originally comes from CO2 recently removed from the atmosphere during photosynthesis and so has a neutral impact on climate change. However, carbon that is converted to CH4 and N2O is a significant concern since their GWPs are much higher. Dairy farms create GHG emissions when they use fossil fuel-based sources to provide energy for the farm, when importing fertilizer to grow crops and to harvest milk. However, emissions from the animals in the form of enteric CH4 and GHGs from manure management ! are much more significant due to the GWP. While every farm is different, estimates from Thoma et al. (2012) show that of the 34.9 Tg of CO2 eq. in the US dairy supply chain, 19% comes from feed production and 53% comes from milk production. Of the milk production, CO2 eq., 49% is from enteric emissions while 44% is from manure management, predominately from CH4 emissions from manure storages.

New York State, the third largest dairy state in the nation (NASS, 2015), has established ambitious overall renewable energy goals including incorporating 50% renewable energy in the electricity used in the State by 2030 (Energy to Lead, 2015) and reducing GHG emissions 40% by 2040 based on 1990 year baseline values (Executive Order, 2009). The New York State Public Service Commission (PSC) is charged with the responsibility of developing a system that encourages utilities to help meet these goals. This includes reforming the energy vision, a new clean energy standard that is being developed to value electric products from distributed energy sources that includes an economic value for the environmental attributes (E).

An attempt at quantifying the environmental benefits of AD (E) might be expressed as follows:

Etotal=∑▒〖Eghg+Eair quality+Ewater quality+Esoil quality+E…〗

As the State’s renewable energy goals are realized, there needs to be a way for the process to include special provisions for those renewable energy sources that have extra societal benefits, including economic and environmental, and that support the rural character of upstate NY. The dairy industry is New York’s leading agricultural sector, accounting for more than one-half of the state’s total agricultural receipts. The increased milk supply has been very important in helping to meet the tremendous growth in the production of yogurt in NYS. However, the margin between the cost of producing milk and the price received for milk sales, is shrinking. Investing in farm facilities like ADSs will need to be analyzed carefully to ensure a return on investment that merits their implementation. An economic value for the environmental attributes of electricity produced from an ADS would aid in the analysis, showing a more positive overall benefit.

Dairy farms are also under increasing pressure to improve conditions environmentally. The New York State Department of Environmental Conservation (NYSDEC) proposed revisions for the CAFO state permit, regulating the water quality impact of farms with more than 300 cows, will require manure storages to be built to limit spreading on at-risk fields during the winter and early spring seasons. These are farm sizes where manure-based ADSs have been built in the past and where many more could be implemented, given a reasonable rate of return. Manure storages are an important best management practice (BMP) to reduce the potential for water pollution by allowing farms to avoid manure spreading during inappropriate times. Unfortunately, if the manure system does not have a way to capture the GHGs produced, they are released into the atmosphere. Manure-based ADSs installed on farms would be a win-win-win to capture and reduce GHGs and to produce renewable energy from the captured! CH4, fur thermore helping to meet the NYS renewable energy and GHG reduction goals. ADSs installed on farms would stimulate the rural economy and also provide the farm and rural community with all the additional benefits contained in Appendix A.

This paper presents an analysis of the GHG reduction potential for a NYS dairy manure management system that includes AD, post-digestion solid-liquid separation (SLS) and long-term manure storage of SLS liquid effluent. This system is representative of almost all of the 27 ADSs currently operating on-farm in NYS today.

METHODS

The mass of GHG emission reductions (i.e., the mass of carbon dioxide equivalents [MT CO2 eq.]) associated with AD (in this analysis, AD followed by SLS with liquid effluent stored long-term) located in New York State (NYS), was quantified and is discussed in this paper. The following protocols were used: IPCC (2006), AgSTAR (2011), and EPA (Federal Register, 2009) combined with reasonable input values that are representative of a farm’s baseline condition (long-term manure storage with no pre-treatment by ADS). The reductions quantified include: 1) the replacement of fossil fuel-based electrical energy by using AD produced biogas to operate an on-site engine-generator set, and 2) GHG emissions from CAFO required (for water quality purposes) long-term manure storages. The difference between the baseline condition and the conditions post-implementation of an ADS yields the farm’s net GHG emission associated with manure storage. To quantify the economic value! of the G HG emission reductions, the EPA social cost of carbon (SC-CO2) was used (EPA, 2016).

What did we do? *

PROCEDURE

The baseline condition is represented in Figure 1. Typical liquid/slurry long-term manure storages have manure that consists of urine plus feces, solid bedding and milking center washwater, added continuously as is produced on the farm. A natural crust may form as lighter organic material floats to the surface. The storages are constructed as a designed earthen storage with 2:1 side slopes or fabricated from concrete or steel. The fabricated structures have straight sides so less surface area is exposed. A few storages have a SLS prior to storage, while very few have a manure storage cover. Without a cover, they are exposed to rainfall from both annual precipitation and from extreme storms. To determine the baseline condition, storage with no SLS and with a natural crust was considered.
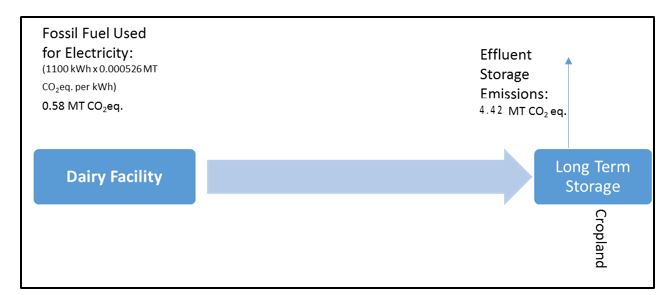
Figure 1. Baseline emissions from dairy farm with no renewable energy system (per cow, per year)

Figure 1. Baseline Emissions from Dairy Farm with No Renewable Energy System (Per cow per year)

Establish Long-Term Manure Storage Baseline Emissions

Part I – Estimating typical CH4 emissions from a long-term manure storage

An independent panel of experts agreed (USDA, 2014) that GHG emission reductions are best estimated using the Intergovernmental Panel on Climate Change (IPPC) Tier 2 method. For long-term manure storages, the daily methane emissions can be calculated by using Equation 1.

Equation 1. ECH4 = VS x Bo x 0.67 x (MCF/100)

where:

ECH4 = Mass of CH4 emissions (kg CH4/cow-day)

VS = Mass of volatile solids in manure going to storage (kg/cow-day)

Bo = Maximum volume of CH4 producing capacity for manure (m3 CH4/kg VS)

= 0.24 m3 CH4/kg VS (for dairy cow manure)

0.67 = Conversion factor for m3 CH4 to kg CH4

MCF = CH4 conversion factor for the manure management system

Yearly CH4 emissions (kg CH4/cow-yr.) can be estimated by summing the daily emissions (or multiplying an average representative daily emission by 365 days). The MCF is largely dependent on the temperature and the type of manure management system. The MCF will change throughout the year as the manure storage temperature changes. Using a summer ambient temperature representative of Upstate New York, of 18°C (64°F) and a winter ambient temperature of < 10°C (< 50°F), a farm can limit the amount stored and the time in storage during the warmer months to reduce the average yearly MCF. Different manure systems also have a different MCF based on the oxygen levels, interception of CH4 gases, and moisture content.

The two variables that can be controlled by the farm management are the VS loading per cow and the methane conversion factor (MCF). The VS loading rate can be reduced by any pre-manure storage treatment process that reduces the storage organic loading rate; fine tuning the diet to reduce VS in the manure and SLS are examples of two methods used to control the VS.

Typically in NYS, manure is stored both in the summer and winter in a liquid/slurry system with no natural crust. Using average typical winter and summer manure storage temperatures, average MCF values can be used in Equation 1 to estimate average methane emissions for these 6-month storage periods. The MCF values are shown in Table 1.

Table 1. Typical Long-Term Manure Storage Methane Conversion Factors for Storage Periods in NYS1

Storage Period

Winter

Summer

Average Manure Storage Temperature (°C)

<10

18

MCF

17

35

1These numbers are based on liquid/slurry storage without a natural crust cover.  (Source:  IPCC, 2006)

Using these MCF values shown in Table 1 and a per-cow VS excretion rate of 7.7 kg/cow-day (representative of high producing NY dairy cows – ASABE, 2006), manure storages could be estimated to produce 38 kg CH4/cow (for the winter storage period) and 79 kg CH4/cow (for the summer storage period) or an average of 4 metric tons (MT) of CO2 eq. per cow per year since 1 kg of CH4 = 34 kg CO2 eq.

Part II – Estimating typical N2O emissions from a long-term manure storage

There could be N2O emissions from a raw manure storage facility. The CO2 equivalent from N2O emissions can be estimated by using Equation 2.

Equation 2. CO2eq = 298 CO2/N2O GWP x EF3 x N x44 N2O/28 N2O-N

where:

CO2eq = Equivalent global warming potential expressed as carbon dioxide

298 CO2/N2O = GWP factor for N2O

EF3 = Emission Factor for N2O-N emissions from manure management

N = Mass of N excreted per cow per day = 0.45 kg/cow-day (ASAE, 2005)

Using an EF3 value of 0.005 (USEPA, 2009) for long-term storage of slurry manure with a crust and multiplying it by 0.45 kg of N/cow-day and by 365 days per year yields an additional 0.38 MT of CO2 eq. per cow per year from N2O emissions from a long-term manure storage facility.

Summary of long-term storage GHG emissions

Combining both the CO2 eq. per cow per year from CH4 emissions and the CO2 eq. per cow per year from N2O emissions from a manure storage facility provides a baseline emission of 4.38 MT of CO2 eq. per cow per year from the manure storage systems that the NYS CAFO permit requires. These emissions can be mitigated by implementing a renewable energy system including an ADS with SLS of the digestate before storage.

Establish GHG Emissions and Emission Reductions for an ADS

If a manure-based ADS was installed on a farm, it could reduce the GHG emissions from manure management as well as replace fossil fuel use or energy for both the farm and other users. By capturing the CH4 produced, and combusting it for energy or simply flaring the excess, CH4 releases are converted back to the neutral CO2 originally consumed by the animals in the form of feed products. The ADS could help to meet NYS renewable energy and GHG reduction goals, however, farms with an ADS would need to manage the system to minimize leaks. With no incentives to control leaks, the CH4 produced potentially could add to overall farm GHG emissions.

Part I – Estimating typical CH4 emissions and emission reductions

There are a number of factors that need to be taken into consideration when estimating the GHG reductions that an ADS will provide. Leaks in the ADS can be very detrimental as more methane is produced in an ADS than is emitted naturally from a manure storage facility in the baseline condition. In addition, there are uncombusted CH4 losses from flares and even some from the engine as well. Although every farm system is different, typical values can be determined from the literature, on-farm measurements, and experience.

ADSs designed and built to supply only the quantity of electricity consumed on-farm and to reduce odors may not be as effective as systems designed specifically to reduce GHG emissions. The conservative values in Table 2 could be used to describe these types of systems. ADSs built specifically to reduce GHG emissions in addition to maximizing the renewable energy produced would achieve significantly better GHG reductions. The optimum numbers are achievable, while the obtainable values are based on ADSs that consider GHG emissions and are built to optimize CH4 production.

Table 2. ADS variables that can be controlled by the system equipment, operation, and management

Conservative

Optimum

Obtainable

Reference

Leaks from system (% CH4)

10

0

1

AgSTAR (2011) and on-farm
Flare Efficiency (%)

90

99

95

AgSTAR (2011) and on-farm
Engine capacity factor (decimal)

0.85

0.97

0.95

On-farm measurements
Engine efficiency (%)

38

42

38

On-farm measurements
ADS Parasitic load

(kWh/cow-yr)

0.30

0.07

0.18

On-farm measurements
Biodegradability post-digestion (%)

70

50

60

On-farm measurements
VS left after SLS (%)

60

20

50

On-farm measurements

The additional societal benefit of this technology can be calculated using EPA’s SC-CO2 of $47.82 as the 2017-2019 average SC CO2 value per metric ton of C02 eq. (at a 3% discount rate) for the methane and nitrous oxide emissions (EPA, 2016).

Part II – Estimating typical N2O emissions and emission reductions for an ADS

An EF3 value of 0 (IPCC, 2006) for an uncovered liquid manure storage describes the typical emission factor from an ADS with SLS since post-digestion there would be no free oxygen, and after solids removal, there would not be a crust forming.

The resulting calculations from the conservative, optimum and obtainable ADS values are shown in Table 3. The fossil fuels avoided are based on the kilo-Watt hours (kWh) produced minus the parasitic load. The uncombusted CH4 from the engine is based on a rich burn engine. The CO2 equivalents from the system leaks and the digestate storage are the major emissions in the conservative scenario, the uncombusted emissions from the flare and the digestate storage are minor emissions from the optimum scenario, while storage contributes the most to the continuing emissions from the obtainable scenario.

Table 3. GHG Emissions from electric production converted with a $47.82 SC-CO2 into a value of E for conservative, optimum and obtainable ADS with solid separation of the digestate before storage.

Units Conservative Optimum Obtainable
Fossil Fuels Avoided
MT CO2 eq/cow-yr

0.70

1.16

0.99

Engine uncommuted CH4 MT CO2 eq/cow-yr

2.5 x 10⁻³

3.2 x 10⁻³

3.1 x 10⁻³

Flare uncommuted CH4 MT CO2 eq/cow-yr

0.19

0.00

0.03

System Leaks CH4 MT CO2 eq/cow-yr

1.41

0.00

0.14

Storage emissions CH4 MT CO2 eq/cow-yr

2.98

0.50

1.9

ƩCO2eq emitted – FF avoided MT CO2 eq/cow-yr

3.81

0.65

1.06

Baseline MT CO2 eq/cow-yr

4.38

4.38

4.38

Reduction in CO2eq MT CO2 eq/cow-yr

0.57

5.03

3.32

SC-CO2 Benefit $/cow-yr

$27

$240

$149

Gross Electricity produced kWh/cow-yr

1,590

2,229

1,955

Value of E $/kWh

0.017

0.11

0.081

Summary of long-term storage GHG emissions

The obtainable value of E $0.081/kWh, for an ADS with SLS of the digestate could be used to better determine the value of renewable energy in meeting NYS’s goals of reducing GHG emissions, increasing renewable energy, and supporting the dairy industry and the upstate NY economy.

More specific values for each individual ADS could be determined as a more granulated value (i.e., a value based on a more detailed/thorough analysis) through the implementation of NYS’s renewable energy vision. By using a value of E that reflects the actual environmental benefit of an ADS, this would incentivize dairy farms with an ADS to improve their CH4 production to produce more electrical energy. This would also increase the interest of more dairy farms in controlling GHG emissions and producing renewable energy by investing in ADS on their farms.

What have we learned?

ADSs can be used to reduce the manure management generated GHG emissions from dairy farms. With careful management, 3.32 MT of CO2 eq. per cow-year can be credited to the ADS. Using EPA’s SC-CO2 average price during 2017-2019 of $47.82, this could amount to a GHG benefit of over $140/cow-year. At this time, the benefit to society is unrewarded and high costs for ADSs both to construct and to operate, discourage farms from installing them. Working towards New York State’s renewable energy goals, as well as the reduction in GHG emission goals by compensating farms for the societal value of $0.081 per kWh of electricity produced from a well-run ADS would better incentivize farms to both install and operate ADSs to the advantage of the State.

Future Plans

DISCUSSION

ADSs can provide additional GHG reductions by utilizing organic wastes that currently go to landfills or aerobic waste treatment facilities. Some landfills may be able to capture a portion of the CH4 that the organic waste produces as renewable energy, but typically the leaks from a landfill gas recovery system are greater than those of farm-based ADS. NYS has some interest in diverting organic waste from landfills to reduce: the fill rate, the potential GHG emissions, and O&M costs in landfills. The value of the diverted organic waste can be best recovered by society if the energy is recovered through manure-based AD since the nutrients would also be recovered by mixing the food waste with manure, digesting it and recycling the nutrients in the effluent to the land for growing crops.

Nutrients to grow crops that are currently utilized in the form of commercial fertilizer, could be offset by the nutrients contained in a post-digested liquid, which would also reduce the energy and accompanying fossil fuel emissions now emitted when manufacturing commercial nutrients.

Aerobic treatment of organic wastes requires additional energy that adds to the fossil fuel-based carbon dioxide emissions and typically does not recover nutrients. While anaerobic digestion creates renewable energy and preserves nutrients.

Typical ADSs produce a large portion of energy from CH4 as waste heat from the engine(s). Operating a Combined Heat and Power (CHP) system in conjunction with an enterprise that would utilize the heat produced, would enable the system to harvest even more renewable energy.

ADSs could improve GHG mitigation efforts if the effluent storage was covered and if the gas collected was included in the biogas utilization system, eliminating any emissions from the effluent storage while producing even more renewable energy.

Farm Disadvantages

Managing a complex and expensive ADS requires dedication and a sophisticated management effort that clearly competes for time with other tasks on the farm. There is the potential to emit excess CH4 if: 1) leaks are not properly controlled, 2) the engine generator, boiler and/or flare are not efficient or 3) if the effluent storage continues to produce uncontained CH4. These can all be compounded if off-site organics are imported to the farm. The existing NYS net metering program makes the current price paid for exported electricity, very low. This reduces the motivation to produce and capture the maximum amount of CH4 from the ADS.

Planning and installing an on-farm ADS takes time to consider the benefits and costs so that a business decision can be reached. Capital costs of ADSs vary, but can range from $4,000 to $5,500 per kW of generation capacity. Operating costs have been estimated at $0.02 to $0.03 per kWh. Much of the capital investment is considered lost capital by lenders. The existing manure management system should be examined to determine any disadvantages from extra solids, contaminants, or dilution. If the successful operation of the ADS depends on tipping fees from imported organics, the reliability and quality of these sources needs to be determined. If electricity is to be sold, the utility should be consulted to determine how/if the distribution lines to the farm can handle what is expected to be generated.

Corresponding author, title, and affiliation

Peter Wright, Agricultural Engineer, Cornell University

Corresponding author email

cag26@cornell.edu

Other authors

Curt Gooch, Dairy Environmental Systems and Sustainability Engineer, Cornell University

Additional information

www.manuremanagement.cornell.edu
Early Stage Economic Modeling of Gas-permeable Membrane Technology Applied to Swine Manure after Anaerobic Digestion


Proceedings Home W2W Home w2w17 logo

Purpose

The objective of this study was to conduct cost versus design analysis for a gas-permeable membrane system using data from a small pilot scale experiment and projection of cost versus design to farm scale.

What did we do?

This reported work includes two major steps. First, the design of a small pilot scale batch gas-permeable membrane system was scaled to process effluent volumes from a commercial pig farm. The scaling design maintained critical process operating parameters of the experimental membrane system and introduced assumed features to characterize effluent flows from a working pig farm with an anaerobic digester. The scaled up design was characterized in a spreadsheet model. The second step was economic analysis of the scaled-up model of the membrane system. The objective of the economic analysis was to create information to guide subsequent experiments towards commercial development of the technology. The economic analysis was performed by introducing market prices for components, inputs, and products and then calculating effects on costs and on performance of changes in design parameters.

What have we learned?

First, baseline costs and revenues were calculated for the scaled up experimental design. The commercial scale design of a modular gas-permeable membrane system was modeled to treat 6 days accumulation of digester effluent at 16,300 gallons per day resulting in a batch capacity of 97,800 gallons. The modeled large scale system is 19,485 times the capacity of the 5.02 gallon experimental pilot system. The installation cost of the commercial scale system was estimated to be $903,333 for a system treating 97,800 gallon batches over a 6 day period.

At $1/linear ft. and 7.9 ft./gallon of batch capacity, membrane material makes up 86% of the estimated installation cost. Other installation costs include PVC pipes, pumps, aerators, tanks, and other parts and equipment used to assemble the system, as well as water to dilute the concentrated acid prior to initiating circulation. The annual operating cost of the system includes concentrated sulfuric acid consumed in the process. Using limited experimental data on this point, we assume a rate of 0.009 gallons (0.133 pounds) of acid per gallon of digester effluent treated. At a price of $1.11 per gallon ($0.073/lb) of acid, acid cost per gallon of effluent treated is $0.010. Other operating costs include electric power, labor, and repairs and maintenance of the membrane and other parts of the system estimated at 2% of investment cost for non-moving parts and 6% of investment for moving parts. Potential annual revenue from the system includes the value of ammonium sulfate produced. Over the 6 day treatment period, if 85% of the TAN-N in the digester effluent is removed by the process, and if 100% of the TAN-N removed is recovered as ammonium sulfate, and given the TAN-N concentration in digester effluent was 0.012 pounds per gallon (1401 mg/l), then 0.01 pounds of TAN-N are captured per gallon of effluent treated. At an ammonium sulfate fertilizer price of $588/ton or $0.294/pound and ammonium sulfate production of 0.047 pounds (0.01 pounds TAN-N equivalent), potential revenue is $0.014 per gallon of effluent treated. No price is attached here for the elimination of internal and external costs associated with potential release to the environment of 0.01 pounds TAN-N per gallon of digester effluent or 59,073 pounds TAN-N per year from the system modeled here.

Several findings and questions, reported here, are relevant to next steps in experimental evaluation and commercial development of this technology.

1. Membrane price and/or performance can be improved to substantially reduce installation cost. Membrane material makes up 86% of the current estimated installation cost. Each 10% reduction in the product of membrane price and length of membrane tube required per gallon capacity reduces estimated installation cost per gallon capacity by 8.6%.

2. The longevity and maintenance requirements of the membrane in this system were not examined in the experiment. Installation cost recovery per gallon of effluent decreases at a declining rate with longevity. For example, Cost Recovery Factors (percentage of initial investment charged as an annual cost) at 6% annual interest rate vary with economic life of the investment as follows: 1 year life CRF = 106%, 5 year life CRF = 24%, 10 year life CRF = 14% . Repair costs are often estimated as 2% of initial investment in non-moving parts. In the case of the membrane, annual repair and maintenance costs may increase with increased longevity. Longevity and maintenance requirements of membranes are important factors in determining total cost per gallon treated.

3. Based on experimental performance data (TAN removal in Table 1) and projected installation cost for various design treatment periods ( HRT = 2, 3, 4, 5, or 6 days), installation cost per unit mass of TAN removal decreases and then increases with the length of treatment period. The minimum occurs at HRT = 4 days when 68% reduction of TAN-N in the effluent has been achieved.

Table 1. Comparison of installation cost and days of treatment capacity

4. Cost of acid relative to TAN removal from the effluent and relative to fertilizer value of ammonium sulfate produced per gallon of effluent treated are important to operating cost of the membrane system. These coefficients were beyond the scope of the experiment although some pertinent data were generated. Questions are raised about the fate of acid in circulation. What fraction of acid remains in circulation after a batch is completed? What fraction of acid reacts with other constituents of the effluent to create other products in the circulating acid solution? What fraction of acid escapes through the membrane into the effluent? Increased efficiency of TAN removal from the effluent per unit of acid consumed will reduce the cost per unit TAN removed. Increased efficiency of converting acid to ammonium sulfate will reduce the net cost of acid per gallon treated.

5. Several operating parameters that remain to be explored affect costs and revenues per unit of effluent treated. Among those are parameters that potentially affect TAN movement through the membrane such as: a) pH of the effluent and pH of the acid solution in circulation, b) velocity of liquids on both sides of the membrane, and c) surface area of the membrane per volume of liquids; effluent and acid solution, in the reactor. Similarly, the most profitable or cost effective method of raising pH of the digester effluent remains to be determined, as it was beyond the scope of the current study. Aeration was used in this experiment and in the cost modeling. Aeration may or may not be the optimum method of raising pH and the optimum is contingent on relative prices of alternatives as well as their effect on overall system performance. Optimization of design to maximize profit or minimize cost requires knowledge of these performance response functions and associated cost functions.

6. Management of ammonium sulfate is a question to be addressed in future development of this technology. Questions that arise include: a) how does ammonium sulfate concentration in the acid solution affect rates of TAN removal and additional ammonia sulfate production, b) how can ammonium sulfate be removed from, or further concentrated in, the acid solution, c) can the acid solution containing ammonium sulfate be used without further modification and in which processes, d) what are possible uses for the acid solution after removal of ammonium sulfate, e) what are the possible uses for the effluent after removal of some TAN, and f) what are the costs and revenues associated with each of the alternatives. Answers to these questions are important to designing the membrane system and associated logistics and markets for used acid solution and ammonium sulfate. The realized value of ammonium sulfate and the cost (and revenue) of used acid solution are derived from optimization of this p art of the system.

7. LCA work on various configurations and operating parameters of the membrane system remains to be done. Concurrent with measurement of performance response functions for various parts of the membrane system, LCA work will quantify associated use of resources and emissions to the environment. Revenues may arise where external benefits are created and markets for those benefits exist. Where revenues are not available, marginal costs per unit of emission reduction or resource extraction reduction can be calculated to enable optimization of design across both profit and external factors.

Future Plans

A series of subsequent experiments and analyses are suggested in the previous section. Suggested work is aimed at improving knowledge of performance response to marginal changes in operating parameters and improving knowledge of the performance of various membranes. Profit maximization, cost minimization, and design optimization across both financial and external criteria require knowledge of performance response functions over a substantial number of variables. The economic analysis presented here addresses the challenge of projecting commercial scale costs and returns with data from an early stage experimental small pilot; and illustrates use of such preliminary costs and returns projections to inform subsequent experimentation and development of the technology. We will continue to refine this economic approach and describe it in future publications.

Corresponding author, title, and affiliation

Kelly Zering, Professor, Agricultural and Resource Economics, North Carolina State University

Corresponding author email

kzering@ncsu.edu

Other authors

Yijia Zhao, Graduate Student at BAE, NCSU; Shannon Banner, Graduate Student at BAE, NCSU; Mark Rice, Extension Specialist at BAE, NCSU; John Classen, Associate Professor and Director of Graduate Programs at BAE, NCSU

Acknowledgements

This project was supported by NRCS CIG Award 69-3A75-12-183.

Recovery of Proteins and Phosphorus from Manure

Proceedings Home W2W Home w2w17 logo

*Purpose

The recovery of phosphorus and proteins from manure could be advantageous to both offset costs and to improve and lessen the environmental impacts of manure storage and treatment. Phosphorous in manure can contaminate rivers, lakes, and bays through runoff, if applied onto cropland at excessive rates. Thus, recovering phosphorous from manure can not only help reduce phosphorus loss in runoff, but also reduces the use of commercial fertilizer based upon phosphate rock. Phosphorus mines have limited reserves and viable alternatives for replacing rock phosphate as fertilizer do not exist. Protein is a natural resource used in a wide range of commercial applications from pharmaceuticals to dietary supplements, foods, feeds, and industrial applications.

What Did We Do?

A new method for simultaneous extraction of proteins and phosphorus from biological materials has been developed and is presented.  The experiments used swine manure solids fraction after solids-liquid separation.  From raw manure, wet solids are dissolved in acidic solution and then treated with a basic solution so phosphorus will precipitate and be reclaimed.  The proteins in the washed solids can be extracted and concentrated with ultrafiltration and flocculation.

Test tubes filled with proteins from manure

What Have We Learned?

On a dry-weight basis, it was found that the separated manure solids contained 15.2-17.4% proteins and 3.0% phosphorus.  Quantitative extraction of phosphorus and proteins from manures was possible with this new system. The phosphorus was first separated from the solids in a soluble extract, then the proteins were separated from the solids and solubilized with an alkali solvent.  Both phosphorus and protein recovery were enhanced about 19 and 22%, respectively, with the inclusion of a rinse after the washing. The recovered phosphorus solids had 20.4% phosphates (P2O5).  The protein extract was concentrated using ultrafiltration (UF) and lyophilization to obtain a protein solids concentrate.  UF of 5 and 10 kDa captured all the proteins, but 30 kDa resulted in 22% loss.  The protein solids were converted into amino-acids using acid hydrolysis.  Further, the system was proved effective in extracting phosphorus and proteins from other biological materials, such as algae or crops. The recovered proteins could be used for production of amino acids and the recovered phosphorus could be used as a recycled material that replaces commercial phosphate fertilizers.  This could be a potential new revenue stream from wastes.

Future Plans

Further research will be conducted to reduce process costs and separate the amino acids.

Corresponding author (name, title, affiliation)

Matias Vanotti, USDA-ARS

Corresponding author email address

matias.vanotti@ars.usda.gov

Other Authors

A.A. Szogi, P.W. Brigman

Additional Information

Vanotti, M.B. and Szogi, A.A.  (2016).  Extraction of amino acids and phosphorus from biological materials. US Patent Application SN 15/350,283. U.S. Patent & Trademark Office.

USDA-ARS Office of Technology Transfer, Invention Docket No: 080.15, Contact: thomas.valco@ars.usda.gov

Acknowledgements

This research is part of USDA-ARS Project 6082-12630-001-00D “Improvement of Soil Management Practices and Manure Treatment/Handling Systems of the Southern Coastal Plains.”  We acknowledge the field and laboratory assistance of William Brigman and Chris Brown, USDA-ARS, Florence, SC.  Support by The Kaiteki Institute, Mitsubishi Chemical Holdings Group through ARS Cooperative Agreement 58-6082-5-006-F is acknowledged.