
Renewable Energy Set-asides Push Biogas to Pipeline

Proceedings Home W2W Home w2w17 logo

Purpose

Deriving the most value from the harvesting of organic wastes, particularly waste produced through farming operations, can be quite challenging. This paper describes an approach to overcome the challenges of realizing the best value from harvested farming wastes through aggregation. Included in this description is an overview of the first swine waste-to-energy project in North Carolina based on aggregation of the value stream rather than aggregation of the feedstock, or manure. Also included in the description are an overview of the challenges encountered, approaches to overcome these challenges, and the solutions developed for this breakthrough approach that will foster further development of successful ventures to maximize the value derived from recycled farming wastes.

What did we do?

Increasingly, our civilization is turning to bioenergy sources as an environmentally-friendly, sustainable alternative to harvesting long-buried fossil fuel sources to supply our energy needs. As the land that farmers have cultivated for years becomes encroached more and more by non-farming land uses, society seeks innovations to address its concerns for our future food needs produced in a manner that addresses environmental concerns associated with modern food production, including nutrient recovery, water conservation and reuse, and controlling odors and emissions from agricultural wastes and manures. Collectively, these innovations have been described as ‘sustainable farming’ approaches.

North Carolina is a significant agricultural producer, and as such, a large producer of agricultural wastes. This state also became the first state in the Southeast to adopt a Renewable Energy Portfolio Standard, and is the only state in the U.S. to require a certain percentage of that renewable energy must be generated from agriculture waste recovery, with specific targets for swine and poultry waste. Naturally, the plentiful resources coupled with a regulatory driver for renewable energy worked together to create attention and efforts toward cost-effective and efficient means of supplying our energy needs through organic waste recovery, or bioenergy approaches.

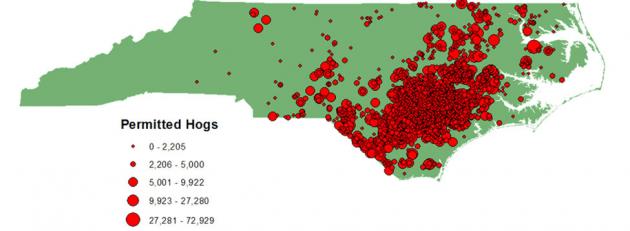
We are only beginning to see a surge in commercial development for the recovery of additional value stream from the waste, such as through the recovery of nutrients, enzymes, and monetized environmental attributes associated with pollution abatement. While manyOptima-KV swine waste to pipeline RNG project forward-thinking farmers have learned that their waste is valuable for supplying renewable energy, it has been unfortunately difficult for an individual farmer to implement and manage advanced value recovery systems primarily due to costs of scale. Rather, it seems, success may be easier achieved through the aggregation of these products from several farms and through the collaborative efforts of project developers, product offtakers, and policy. A shining example of such aggregation and collaboration can be observed from the Optima-KV swine waste to pipeline renewable gas project, located in eastern North Carolina in an area of dense swine farm population.

The Optima-KV project combines, or aggregates, the biogas created from the anaerobic digestion of swine waste from five (5) adjacently located farms housing approximately 60,000 finishing pigs. The Optima-KV project includes the construction of an in-ground anaerobic digester at each farm. The resulting biogas is captured from each farm, and routed to an adjacent, centralized biogas upgrading facility, or refinery, where the biogas undergoes purification and cleaning to pipeline quality specifications. The renewable natural gas produced from this system will be sold to an electric utility subject to the requirements of the North Carolina Renewable Energy Portfolio Standards, and will result in reduced emissions from both the receiving electricity generating unit and the farms, reduced emissions of odors from the farms, and reduced fossil fuel consumption for the production of electricity. The upgraded biogas (RNG) will be transmitted to the electricity generating unit through existing natural gas pipeline infrastructure.

What have we learned?

The innovative design, permitting, and financing for the project is very different than a conventional feedstock aggregation approach, and thus much has been learned. To deliver the RNG to the end user, in this case, multiple contracts with multiple utilities wereGraphic showing how it works required, which presented challenges of negotiating multiple utility connections and agreements. This learning curve was steepened as, at the time of the inception of Optima KV, the state of North Carolina lacked formal pipeline injection standards, so the final required quality and manner of gas upgrading was established through the development of the project.

The project is currently in the beginning stages of construction, and completion is expected by the end of 2017. Given this schedule, the Optima KV project will provide the first pipeline injection of gas – from any source – in the state of North Carolina (all natural gas presently consumed in the state is sourced from out of state).

Future Plans

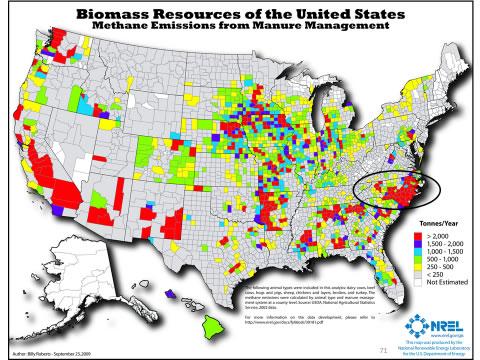
North Carolina’s potential for agricultural waste-to-energy projects is enormous, given its vast agricultural resources. Combining the potential from agriculture with the bioenergy potential from wastewater treatment plants and landfills, it is estimated to be third in capacity behind only California and Texas. The unique approach to aggregation of value streams from multiple sources, as exhibited by this project, will open the doors for similar aggregation strategies, including the anaerobic digestion of mixed feedstocks such as food waste, poultry and swine waste, animal mortality, fats, oils and grease and energy crops.

Corresponding author, title, and affiliation

Gus Simmons, P.E., Director of Bioenergy, Cavanaugh & Associates, P.A.

Corresponding author email

gus.simmons@cavanaughsolutions.com

Additional information

http://www.cavanaughsolutions.com/bioenergy/

1-877-557-8923

gus.simmons@cavanaughsolutions.com

https://www.biocycle.net/2016/11/10/anaerobic-digest-67/

The authors are solely responsible for the content of these proceedings. The technical information does not necessarily reflect the official position of the sponsoring agencies or institutions represented by planning committee members, and inclusion and distribution herein does not constitute an endorsement of views expressed by the same. Printed materials included herein are not refereed publications. Citations should appear as follows. EXAMPLE: Authors. 2017. Title of presentation. Waste to Worth: Spreading Science and Solutions. Cary, NC. April 18-21, 2017. URL of this page. Accessed on: today’s date.

Biofuels and Bioproducts from Wet and Gaseous Waste Streams: Challenges and Opportunities

Proceedings Home W2W Home w2w17 logo

Purpose

To provide an initial characterization of the wet and gaseous organic feedstocks available in the continental U.S., and to explore technological possibilities for converting these streams into biofuels and bioproducts.

What did we do?

The Bioenergy Technologies Office (BETO) of the U.S. Department of Energy commissioned an in depth resource assessment by teams at the the National Renewable Energy Lab (NREL) and the Pacific Northwest National Lab (PNNL). Concurrently, BETO conducted a series of workshops, informed by an extended literature review and several rounds of peer review to ascertain the states of technologies for making biofuels and bioproducts from these resources. These efforts resulted in a January 2017 report that is available here:

https://energy.gov/eere/bioenergy/articles/beto-publishes-analysis-biofu…

What have we learned?

Terrestrial feedstocks are currently the largest resource generated for the bioeconomy, estimated at 572 million dry tons for 2017 (Billion Ton 2016), and have traditionally constituted the primary focus of the Bioenergy Technologies Office (BETO). However, the resource assessment conducted by the National Renewable Energy Lab and Pacific Northwest National Lab indicates that wet waste feedstocks (Summarized in Table ES-1) could also make significant contributions to the bioeconomy and domestic energy security goals.

Summary of Annual Wet and Gaseous Feedstock Availability

Table 1. Annual Resource Generation

1 116,090 Btu/gal. This does not account for conversion efficiency.

2 The moisture content of food waste varies seasonally, ranging from 76% in the summer to 72% in the winter.

3 Methane potential. This does not include currently operational landfill digesters (>1,000 billion cubic feet [Bcf] annually) and may double count potential from wastewater residuals, food waste, and animal waste.

4 DDGS = Dried Distillers Grains with Solubles

BCF- Billion cubic feet

When combining the primary waste streams of interest: sludge/biosolids, animal manure, food waste, and fats, oils, and greases, a supplemental 77 million dry tons per year are generated. Of this total, 27 million dry tons is currently being beneficially used (e.g. fertilizer, biodiesel, compost), leaving 50 million dry tons available for conversion to biofuels, bioproducts or biopower. Gaseous waste streams (biogas and associated natural gas) contribute an additional 734 trillion Btu (TBtu), bringing the total energy potential of these feedstocks to over 2.3 quadrillion Btu. Additionally, these streams contain methane, the second most prevalent greenhouse gas, which constituted 12% of net U.S. emissions in 2014 according to the U.S. Environmental Protection Agency’s (EPA) greenhouse gas inventory. Thus, there is significant potential to valorize these energy dense streams while simultaneously reducing harmful emissions.

As illustrated by example in Figure ES-1, wet and gaseous waste streams are widely geographically distributed, frequently in areas of high population density, affording them unique current and emerging market opportunities. The size of publicly owned treatment works, landfills, rendering operations, and grease collectors overlay with the largest population centers nationwide. Therefore, when compared to terrestrial feedstocks, these waste streams are largely aggregated and any derivative biofuels, bioproducts, or biopower are close to end markets.

Figure ES-1. Spatial distribution and influent range of 14,581 US EPA 2012 Clean Water Needs Survey (CWNS) catalogued treatment plants

At the same time, however, this close proximity to populations markets often correlates with more stringent regulatory landscapes for disposal. Therefore, the value proposition presented by these waste streams commonly includes avoiding disposal costs as opposed to an independent biorefinery that requires stand-alone profitability. Aided by these and related factors, public and private entities are actively exploring and deploying novel solutions for waste stream valorization. Potential competition between biofuels, bioproducts, and other beneficial uses will likely be a key element of future markets, and clearly merits further analytical and modeling investigation.

Future Plans

This report concludes that wet and gaseous organic waste streams represent a significant and underutilized set of feedstocks for biofuels and bioproducts. They are available now, in many cases represent a disposal problem that constitutes an avoided cost opportunity, and are unlikely to diminish in volume in the near future. As a result, at least in the short and medium term, they may represent a low-cost set of feedstocks that could help jump start the Bioeconomy of the Future via niche markets. While much modeling, analysis, and technological de-risking remains to be done in order to bring these feedstocks to market at significant scales, the possible contributions to the overall mission of the Bioenergy Technologies Office merit further attention.

Corresponding author, title, and affiliation

Mark Philbrick, Waste-to-Energy Coordinator, Bioenergy Technologies Office, U.S. Department of Energy

Corresponding author email

mark.philbrick@hq.doe.gov

Other authors

see report

Additional information

Future activities are contingent upon Congressional appropriations.

Acknowledgements

see report

The authors are solely responsible for the content of these proceedings. The technical information does not necessarily reflect the official position of the sponsoring agencies or institutions represented by planning committee members, and inclusion and distribution herein does not constitute an endorsement of views expressed by the same. Printed materials included herein are not refereed publications. Citations should appear as follows. EXAMPLE: Authors. 2017. Title of presentation. Waste to Worth: Spreading Science and Solutions. Cary, NC. April 18-21, 2017. URL of this page. Accessed on: today’s date.

Manure Management Technology Selection Guidance

Proceedings Home W2W Home w2w17 logo

Purpose

Manure is an inevitable by-product of livestock production. Traditionally, manure has been land applied for the nutrient value in crop production and improved soil quality.With livestock operations getting larger and, in many cases, concentrating in certain areas of the country, it is becoming more difficult to balance manure applications to plant uptake needs. In many places, this imbalance has led to over-application of nutrients with increased potential for surface water, ground water and air quality impairments. No two livestock operations are identical and manure management technologies are generally quite expensive, so it is important to choose the right technology for a specific livestock operation. Information is provided to assist planners and landowners in selecting the right technology to appropriately address the associated manure management concerns.

What did we do?

As with developing a good conservation plan, knowledge of manure management technologies can help landowners and operators best address resource concerns related to animal manure management. There are so many things to consider when looking at selecting various manure treatment technologies to make sure that it will function properly within an operation. From a technology standpoint, users must understand the different applications related to physical, chemical, and biological unit processes which can greatly assist an operator in choosing the most appropriate technology. By having a good understanding of the advantages and disadvantages of these technologies, better decisions can be made to address the manure-related resource concerns and help landowners:

• Install conservation practices to address and avoid soil erosion, water and air quality issues.

• In the use of innovative technologies that will reduce excess manure volume and nutrients and provide value-added products.

• In the use of cover crops and rotational cropping systems to uptake nutrients at a rate more closely related to those from applied animal manures.

• In the use of local manure to provide nutrients for locally grown crops and, when possible, discourage the importation of externally produced feed products.

• When excess manure can no longer be applied to local land, to select options that make feasible the transport of manure nutrients to regions where nutrients are needed.

• Better understand the benefits and limitations of the various manure management technologies.

Picture of holding tank

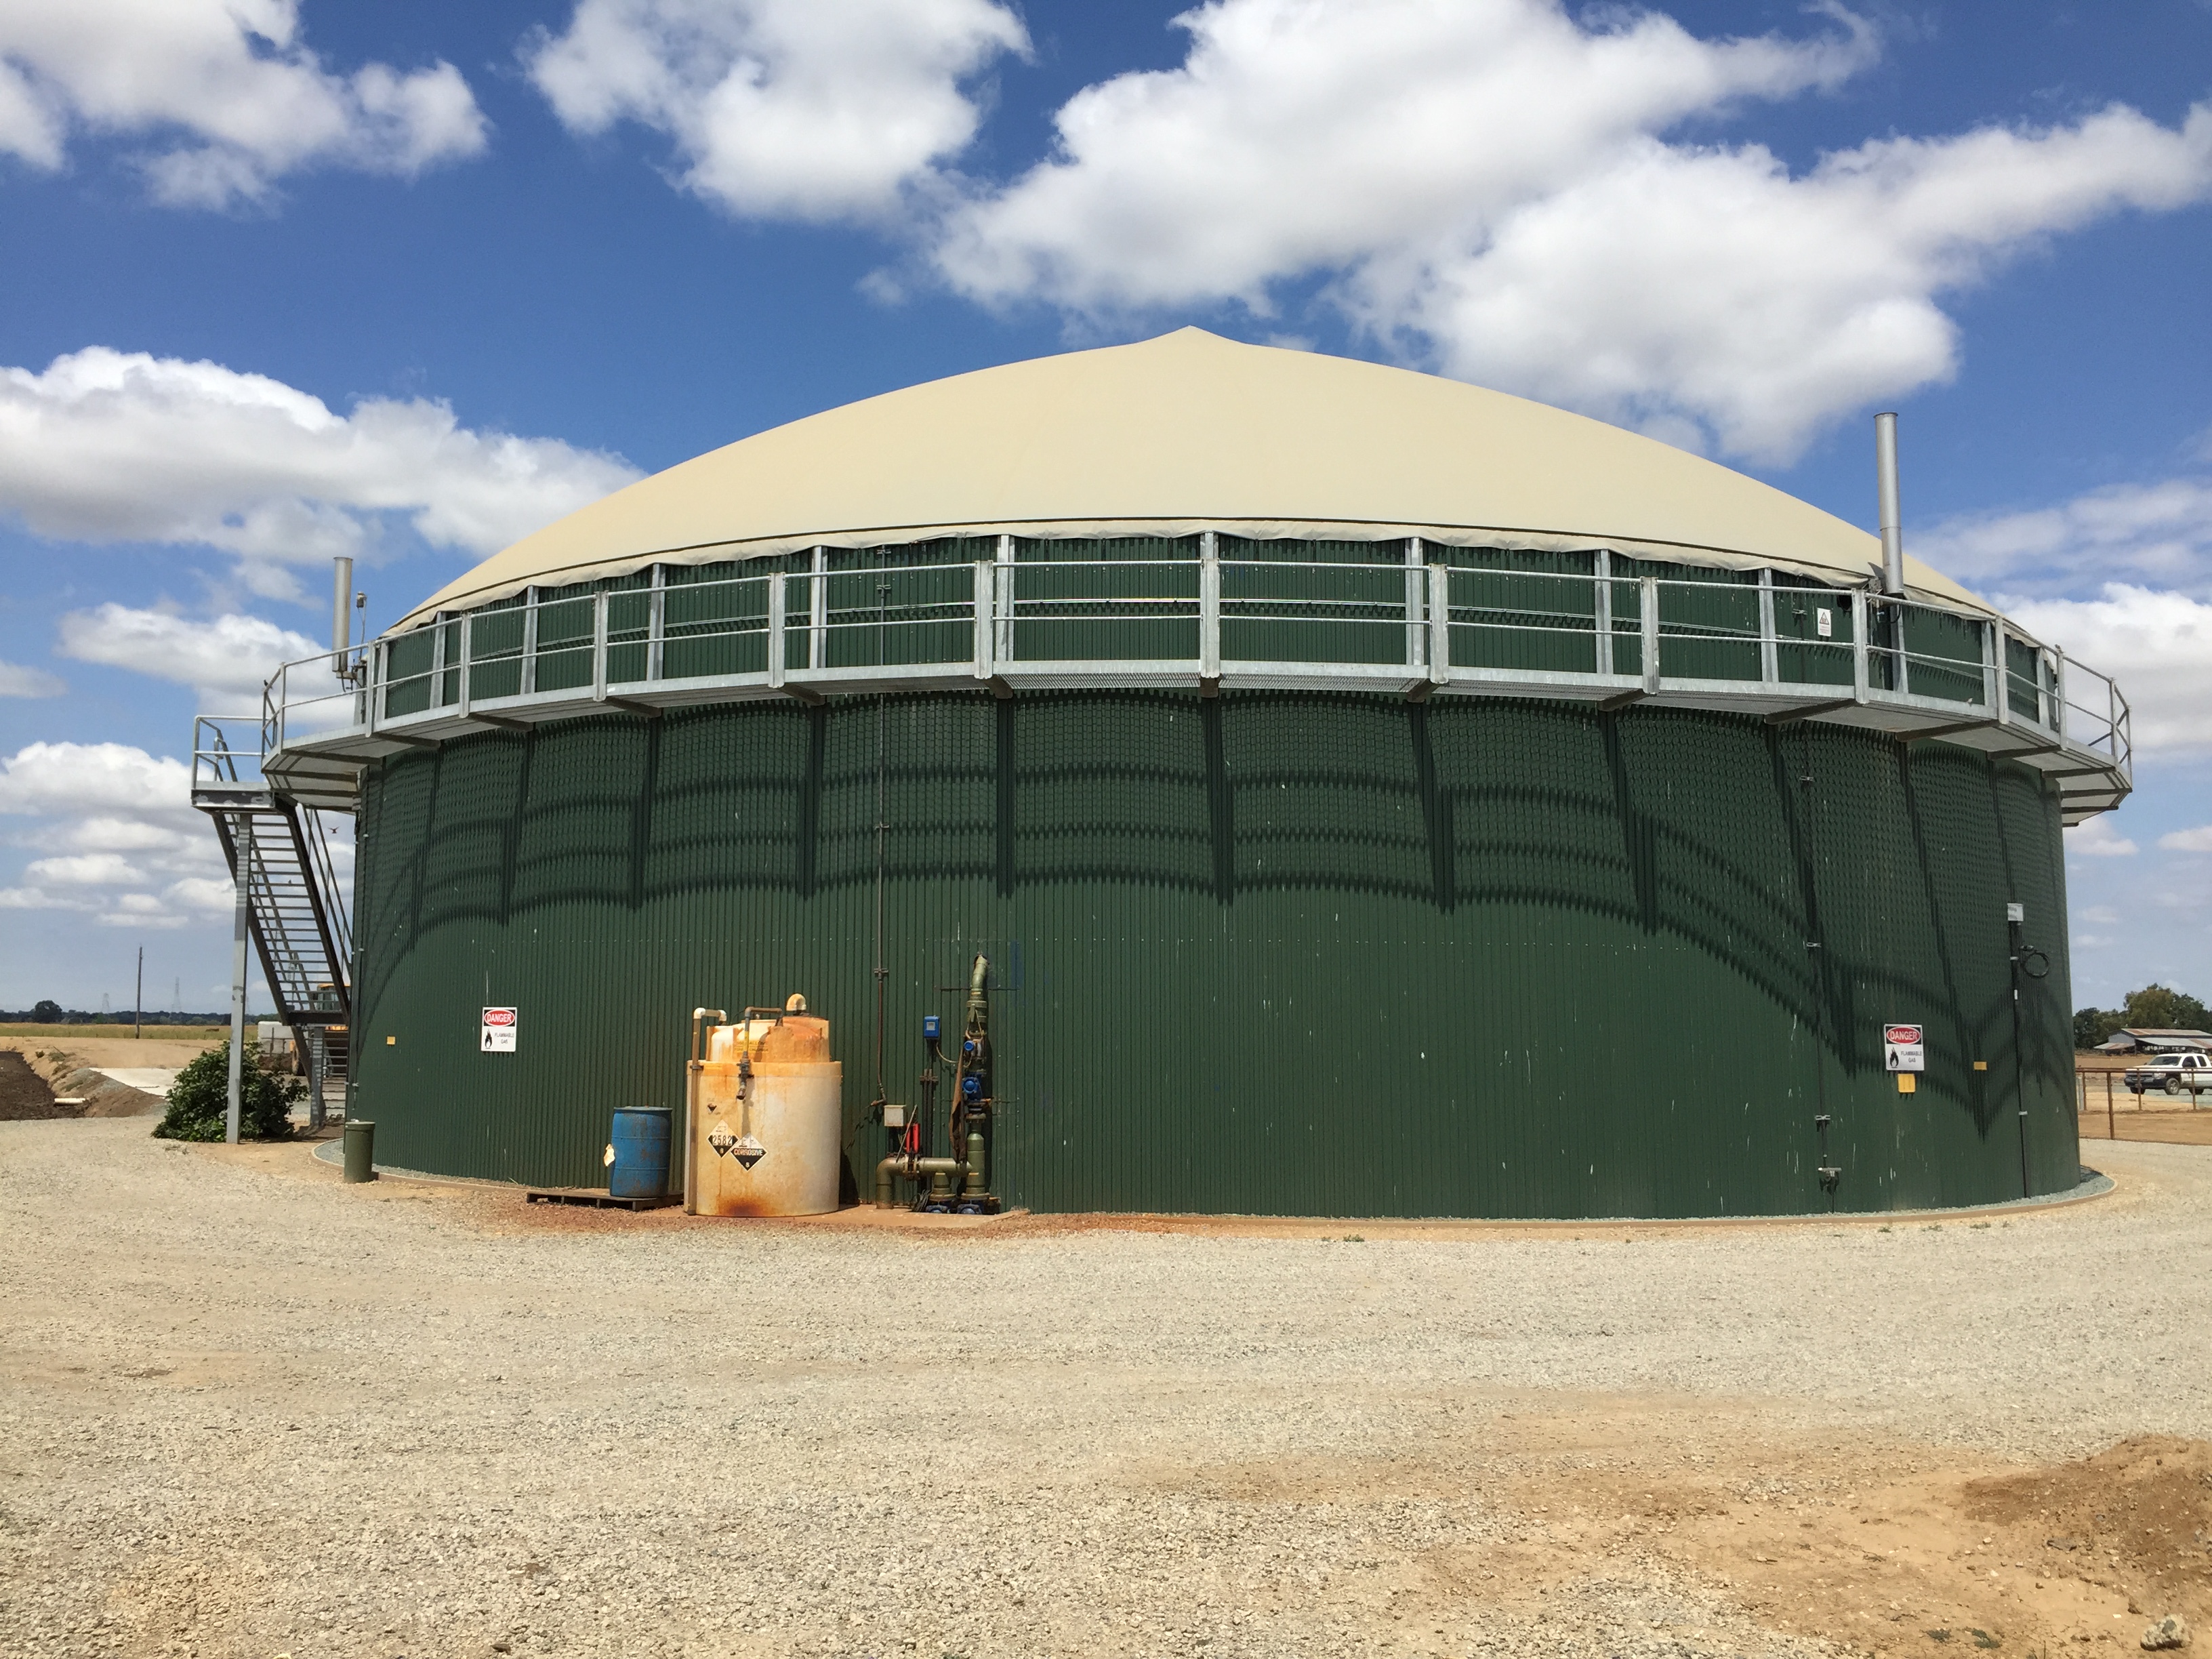
Complete-Mix Anaerobic Digester – option to reduce odors and pathogens; potential energy production

Picture of mechanical equipment

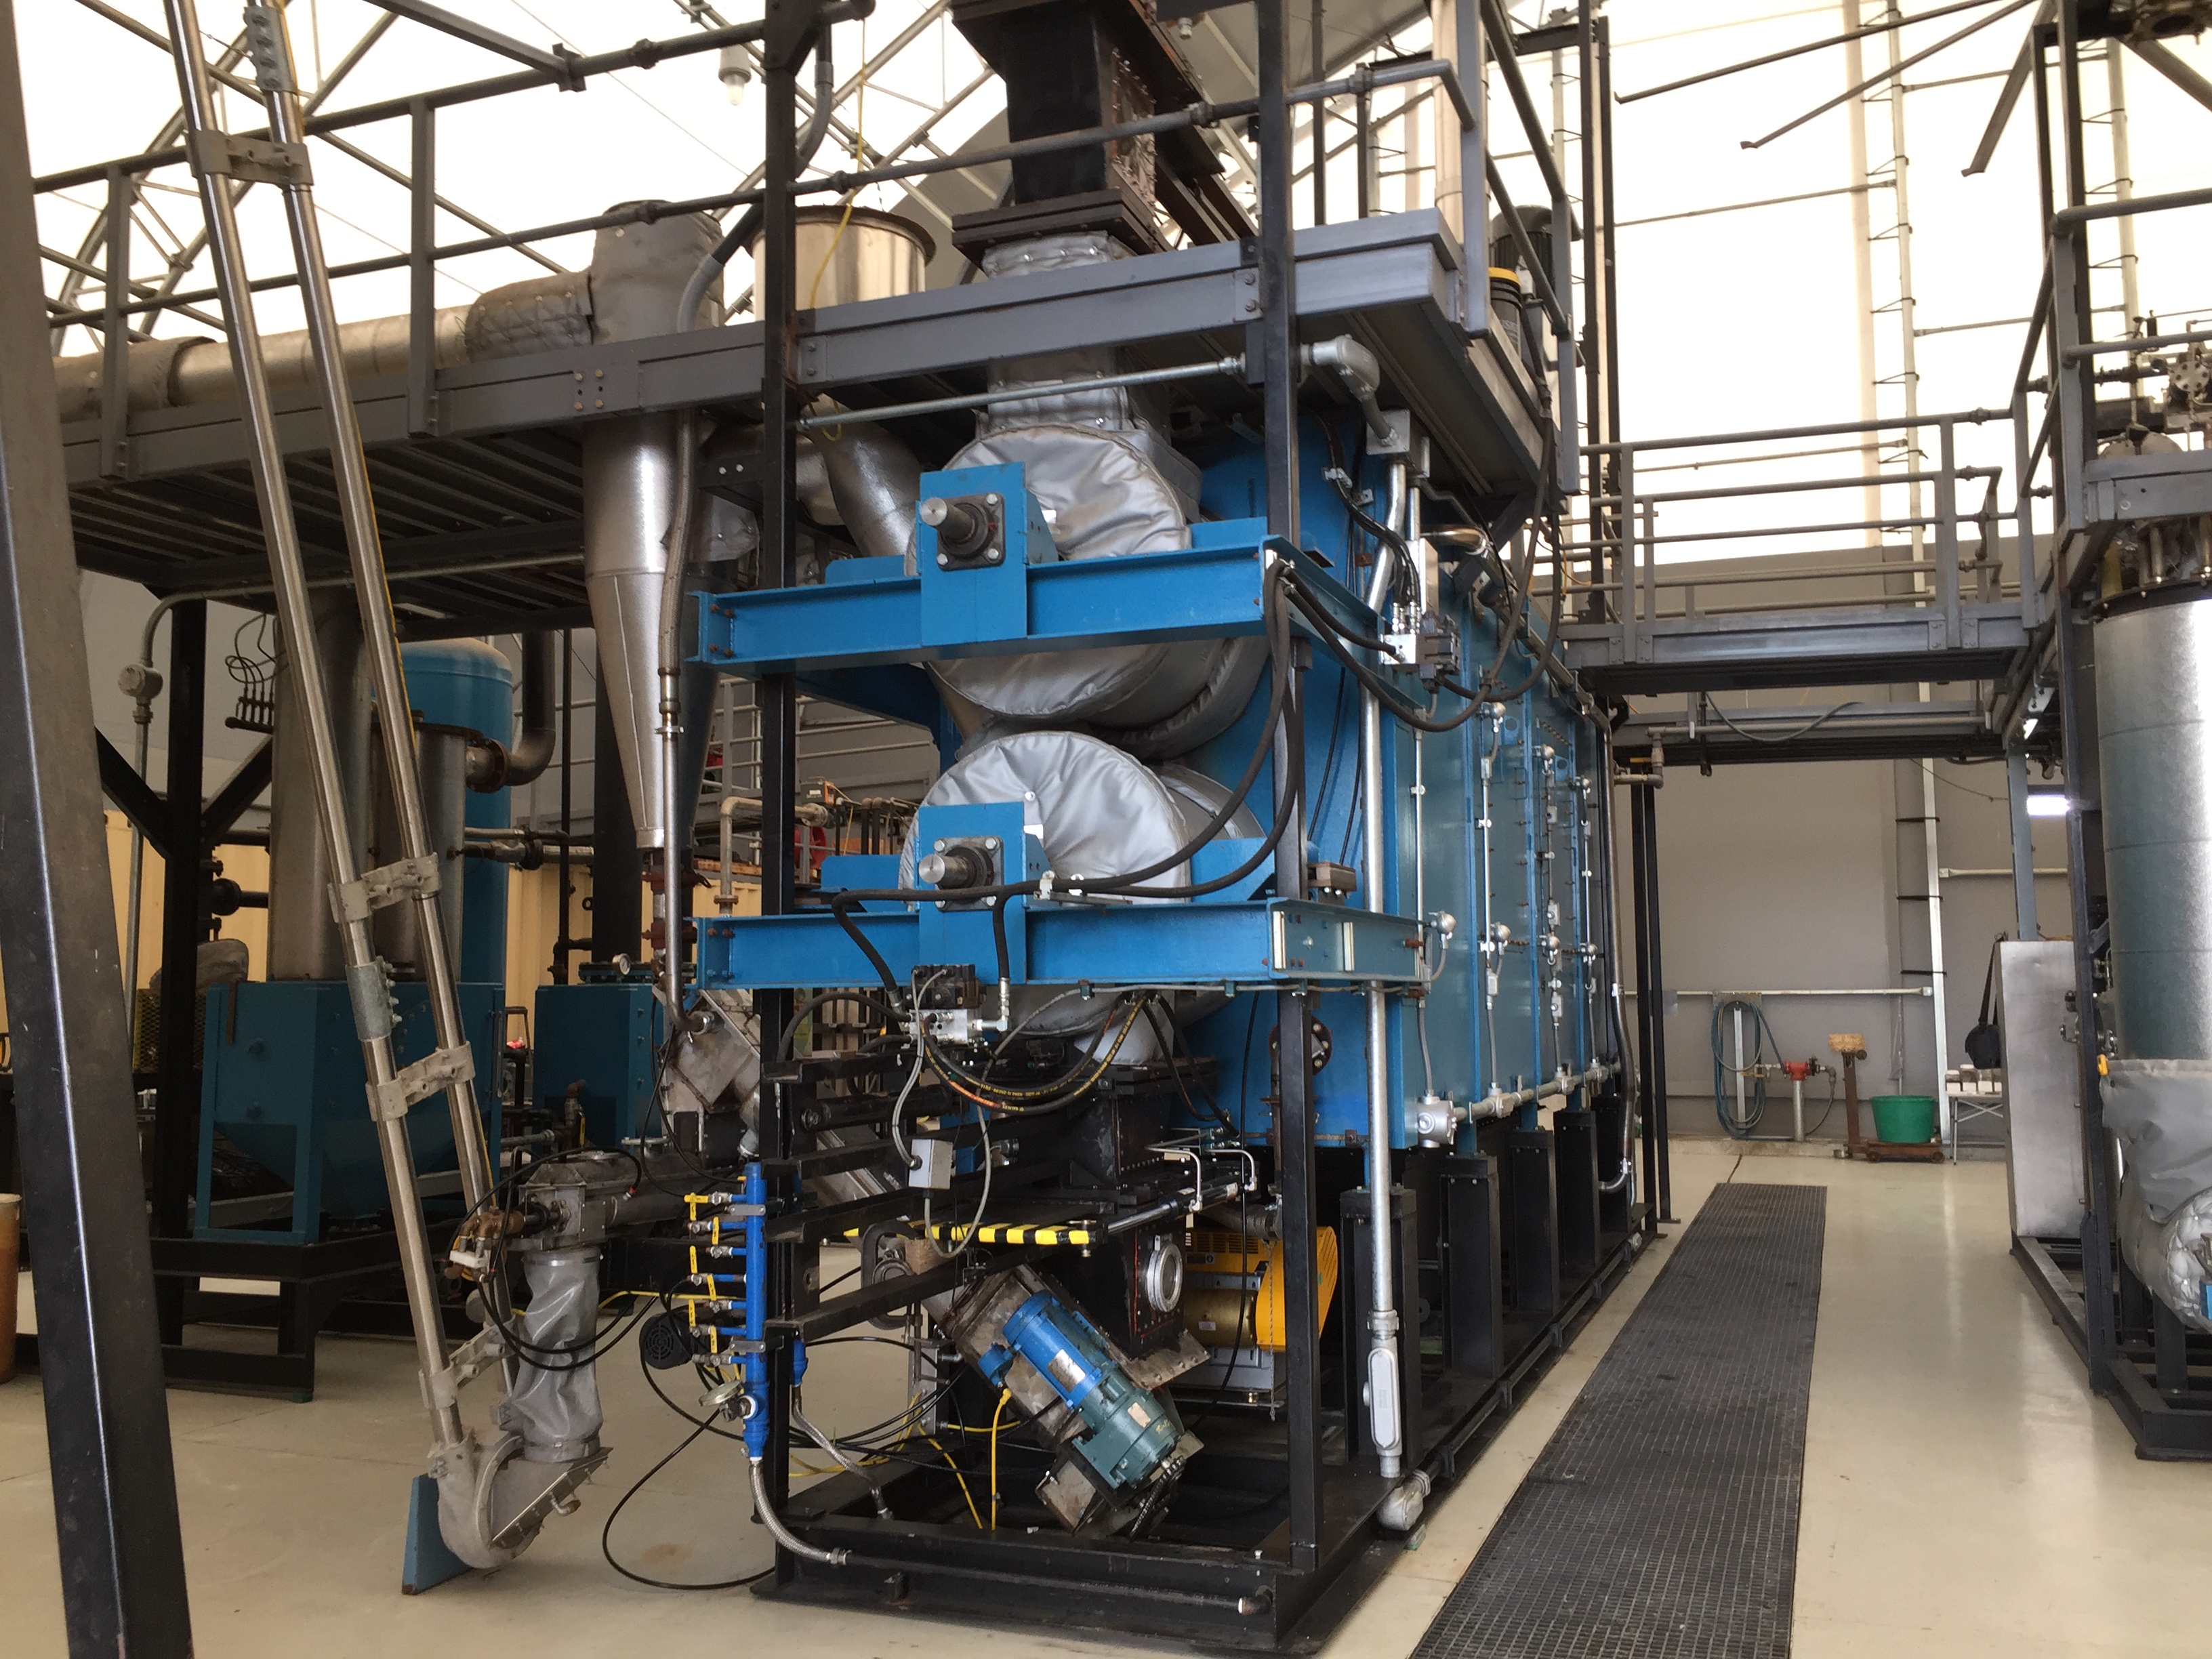
Gasification (pyrolysis) system – for reduced odors; pathogen destruction; volume reduction; potential energy production.

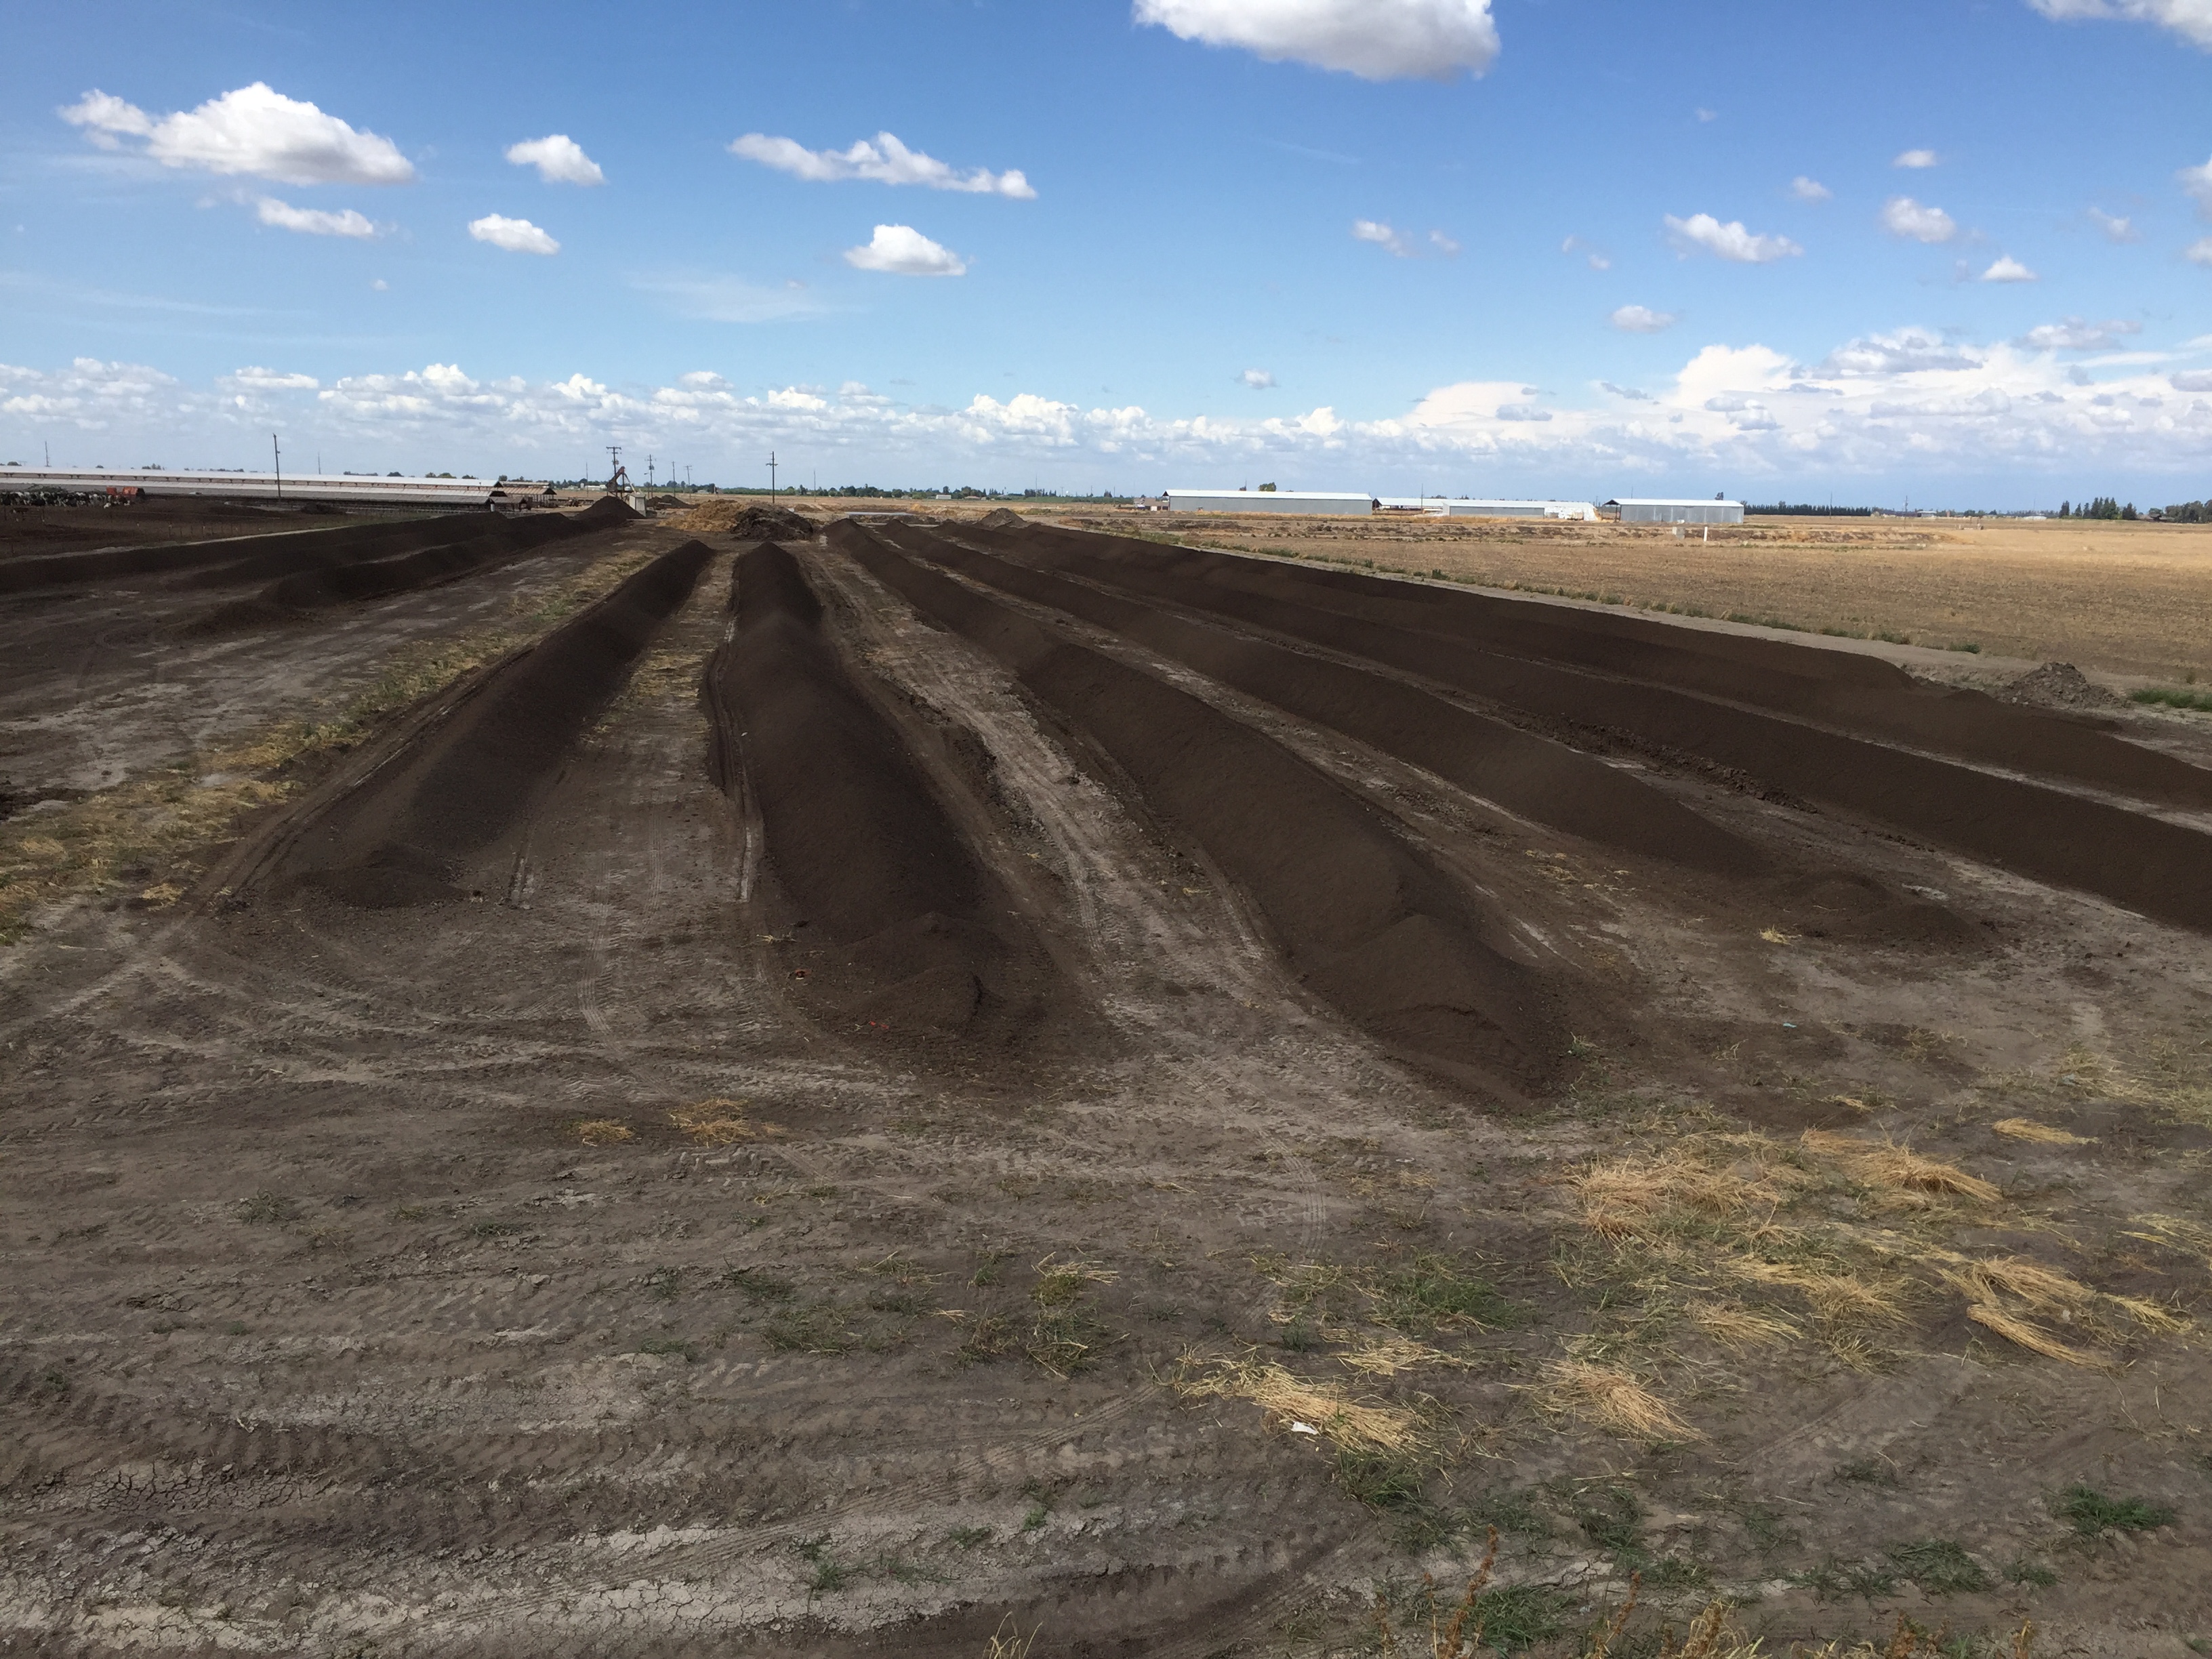
Picture of field

Windrow composting – reduce pathogens; volume reduction

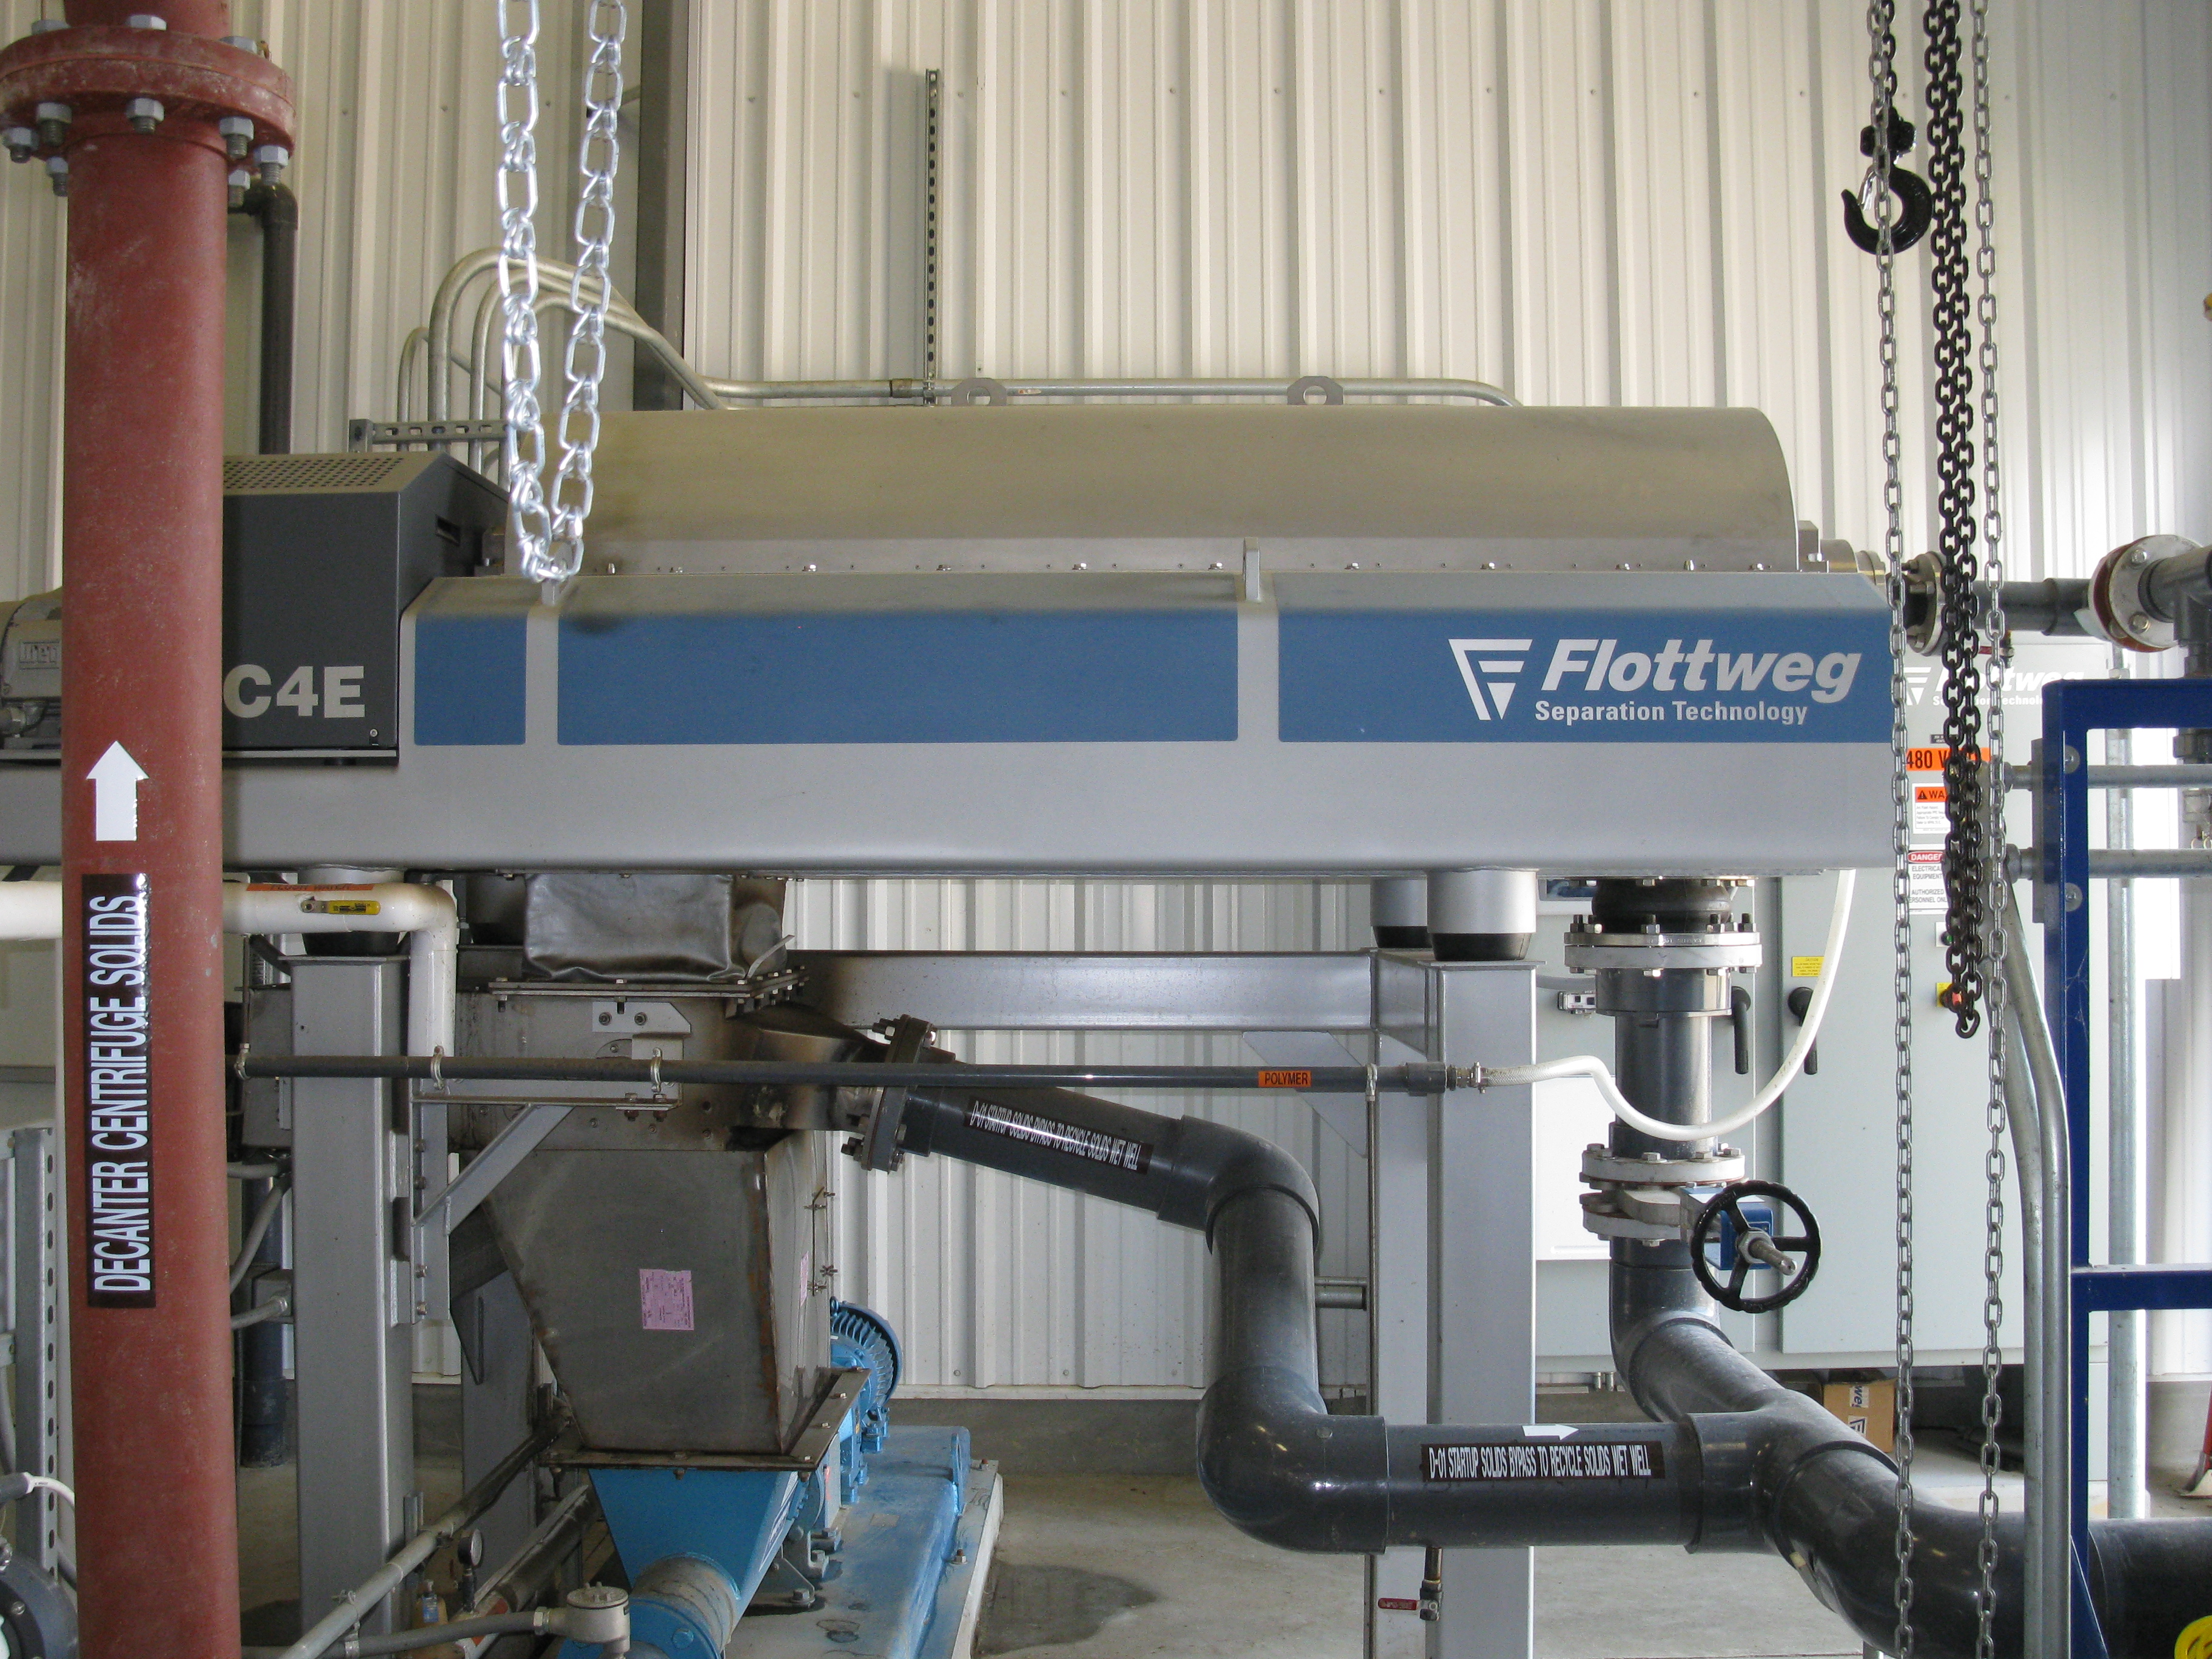
Picture of Flottweg separation technology

Centrifuge separation system – multiple material streams; potential nutrient
partitioning.

What have we learned?

• There are several options for addressing manure distribution and application management issues. There is no silver bullet.

• Each livestock operation will need to be evaluated separately, because there is no single alternative which will address all manure management issues and concerns.

• Option selections are dependent on a number of factors such as: landowner objectives, manure consistency, land availability, nutrient loads, and available markets.

• Several alternatives may need to be combined to meet the desired outcome.

• Soil erosion, water and air quality concerns also need to be addressed when dealing with manure management issues.

• Most options require significant financial investment.

Future Plans

Work with technology providers and others to further evaluate technologies and update information as necessary. Incorporate findings into NRCS handbooks and fact sheets for use by staff and landowners in selecting the best technology for particular livestock operations.

Corresponding author, title, and affiliation

Jeffrey P. Porter, P.E.; National Animal Manure and Nutrient Management Team Leader USDA-Natural Resources Conservation Service

Corresponding author email

jeffrey.porter@gnb.usda.gov

Other authors

Darren Hickman, P.E., National Geospatial Center of Excellence Director USDA-Natural Resources Conservation Service; John Davis, National Nutrient Management Specialist USDA-Natural Resources Conservation Service, retired

Additional information

References

USDA-NRCS Handbooks – Title 210, Part 651 – Agricultural Waste Management Field Handbook

USDA-NRCS Handbooks – Title 210, Part 637 – Environmental Engineering, Chapter 4 – Solid-liquid Separation Alternatives for Manure Handling and Treatment (soon to be published)

Webinars

Evaluation of Manure Management Systems – http://www.conservationwebinars.net/webinars/evaluation-of-manure-management-systems/?searchterm=animal waste

Use of Solid-Liquid Separation Alternatives for Manure Handling and Treatment – http://www.conservationwebinars.net/webinars/use-of-solid-liquid-separation-alternatives-for-manure-handling-and-treatment/?searchterm=animal waste

The authors are solely responsible for the content of these proceedings. The technical information does not necessarily reflect the official position of the sponsoring agencies or institutions represented by planning committee members, and inclusion and distribution herein does not constitute an endorsement of views expressed by the same. Printed materials included herein are not refereed publications. Citations should appear as follows. EXAMPLE: Authors. 2017. Title of presentation. Waste to Worth: Spreading Science and Solutions. Cary, NC. April 18-21, 2017. URL of this page. Accessed on: today’s date.

Aeration to Improve Biogas Production by Recalcitrant Feedstock

Proceedings Home W2W Home w2w17 logo

Purpose

Why aerate biogas digesters?

Most agricultural waste is largely composed of polymers such as lignin and complex carbohydrates that are slowly or nearly completely non-degradable in anaerobic environments. An example of such a waste is chicken litter in which wood chips, rice hulls, straw and sawdust are commonly employed bedding materials.  This makes chicken litter a poor candidate for anaerobic digestion because of inherently poor digestibility and, as a consequence, low gas production rates.

Previous studies, however, have shown that the addition of small amounts of air to anaerobic digestates can improve degradation rates and gas production. These studies were largely performed at laboratory-scale with no provision to keep the added air within the anaerobic sludge.

What Did We Do?

Picture of 4 digesters with sprayer tanksFour digesters were constructed out of 55 gallon sprayer tanks. The digestate was 132 L in volume with a dynamic headspace of 76 L. At the bottom of each tank a manifold was constructed from ½” PVC pipe in an “H” configuration and with a volume of approximately 230 mL. The bottom of the manifold had holes drilled in it to allow exchange with the sludge. Tanks were fed 400 g of used top dressing chicken litter (wood shaving bedding) obtained from a local producer (averaging 40% moisture and 15% ash) in 2 L of water through a port in the tank [labeled “1” in figure]. Two hundred mL of air were fed to the manifold through a flow meter [2] 0, 1, 4, or 10 times daily in 15-minute periods at widely spaced intervals by means of an air pump and rotary timer [4]. A gas port [3] at the top of the tank allowed for sampling and led to a wet tip flow meter (wettipflowmeters.com) to measure gas production. Digestate samples were taken out of a side port [5] for measurement of water quality and dissolved gases and overflow was discharged from the tank by means of a float switch wired in line with a ½” PVC electrically actuated ball valve.

Seven dried and weighed tulip poplar disks were added to each tank at the beginning of the experiment. At the end of the experiment, the disks were cleaned and dried for three days at 105 0C before re-weighing. Dissolved and headspace gases were measured on a gas chromatograph equipped with FID, ECD, and TCD detectors. Water quality was measured by standard APHA methods.

What Have We Learned?

Graph of chemical oxygen demand per liter and graph of liters of biogas per day

Adding 800 mL of air daily increased biogas production by an average of 73.4% compared to strictly anaerobic digestate. While adding 200 mL of air daily slightly increased gas production, adding 2 L per day decreased gas production by 16.7%.

Aerating the sludge improved chemical oxygen demand (COD) with the greatest benefit occurring at 2,000 mL added air per day. As noted, however, this decreased gas production in the control indicating toxicity to the anaerobic sludge.

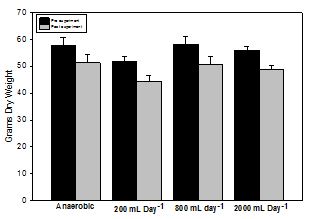
The experiment was stopped after 148 days. When the tanks were opened, there was widespread fungal growth both on the surface of the digestate and the wood disks in the aerated tanks [left], whereas non-aerated tanks showed little evidence of fungal growth [right]. While wood disks subjected to all treatments lost significant mass (t-test, α=0.05), disks in the anaerobic tank lost the least amount of weight on average (6.3 g) while all other treatments lost over 7 g weight on average.

Picture of widespread fungal growth on the surface of the digestate and the wood discs in aerated tanks

Future Plans

Research on other feedstocks and aeration regimes are being conducted as are 16s and 18s community analyses.

Chart of grams dry weight pre experiment and post experiment

Corresponding author (name, title, affiliation)

John Loughrin, Research Chemist, Food Animal Environmental Research Systems, USDA-ARS, 2413 Nashville Rd. B5, Bowling Green, KY 42104

Corresponding author email address

John.loughrin@ars.usda.gov.

Other Authors

Karamat Sistani, Supervisory Soil Scientist, Food Animal Environmental Research Systems. Nanh Lovanh, Environmental Engineer, Food Animal Environmental Research Systems.

Additional Information

https://www.ars.usda.gov/midwest-area/bowling-green-ky/food-animal-envir…

Acknowledgements

We thank Stacy Antle and Mike Bryant (FAESRU) and Zachary Berry (WKU Dept. of Chemistry) for technical assistance.

Nutrient Recovery Membrane Technology: Best Applications and Role in Conservation

Proceedings Home | W2W Home w2w17 logo
Purpose

Animal manure contains nutrients and organic matter that is valuable to crop producers if it can be efficiently applied to nearby fields, however this can be a significant source of environmental contamination if managed incorrectly. In most cases, concentrated animal production facilities are rarely close to sufficient cropland to fully utilize these resources and management becomes a disposal issue rather than a utilization opportunity. The goal of this work is to design and test a pilot-scale system to implement a hydrophobic, gas permeable, expanded polytetraflouroethylene (ePTFE) membrane (U.S. patent held by USDA) to recover ammonia from swine wastewater in a solution of sulfuric acid. The pilot-scale system results are described elsewhere; the purpose of this presentation is to explore the best applications for this and other recovery technologies in animal feeding operations.

What did we do?

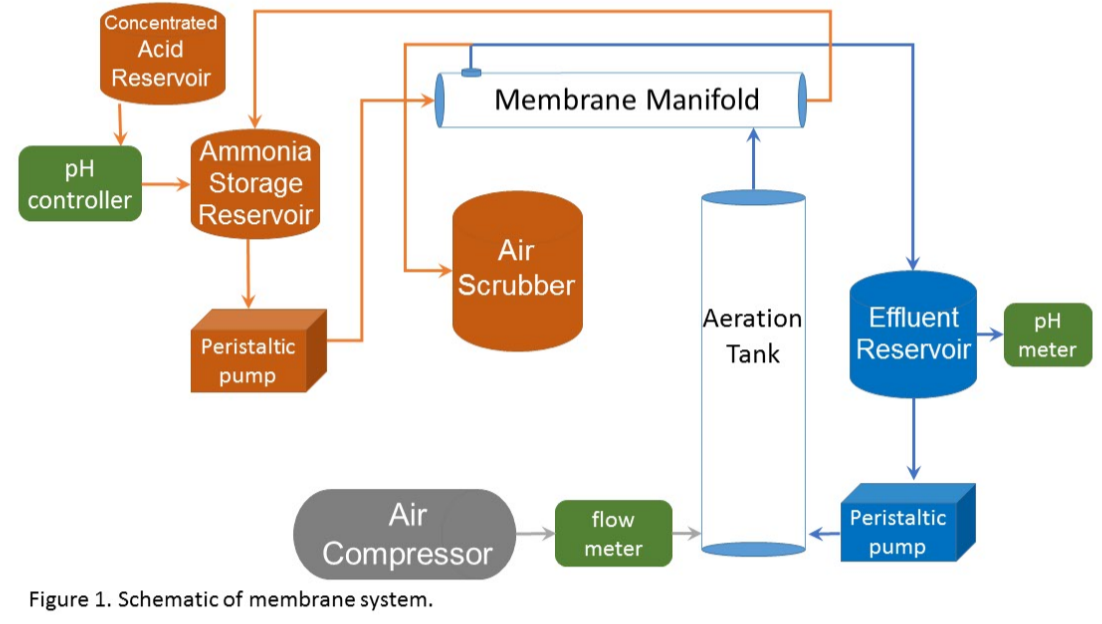
The reactor test (figure 1) system consisted of 19 membrane tubes (ID of 0.16 in, wall thickness of 0.023 in) within a 2.01 in diameter, 24.7 in long reactor giving a membrane density of 3.83 in2 in-3 of reactor. Wastewater first passed through a CO2 stripping column (4.016 in diameter, 55 in length) where a small air stream (0.0614 ft 3 min-1) stripped CO2 from the wastewater and raised the pH one full unit, shifting the equilibrium to NH3 and enhancing transport across the membrane. Batch tests (0.706 ft3) were run for 9-12 days with wastewater recirculating at a rate of 0.16 gal min-1. The recovery fluid inside the tubular membranes was a 0.01 N sulfuric acid solution with the pH automatically maintained below 4.0 standard units and recirculating at a rate of 1/100th the wastewater flowrate. Freshly collected settled wastewater and anaerobic digester effluent were tested to determine the mass of ammonia collected, the acid required to main! tain the low pH of the recovery solution and potential ammonia losses to the atmosphere.

Figure 1. Schematic of membrane system

What have we learned?

The batch volumes of the two sources contained about the same mass of nitrogen (35.6 g in freshly collected settled wastewater and 33.2 g in digester effluent) but the higher fraction of ammonia in digester effluent resulted in greater recovery (77% vs. 33%).

Future Plans

The best use of this and other recovery technologies cannot be determined by simply comparing the cost of installation and operation with the price of the recovered product. The question of where and how to implement such recovery technologies requires knowledge of the value added by each process and further needs an understanding of how various practices interact and contribute to a sustainable system. Process interactions will suggest one step come before another because of the characteristics produced by one and needed by the other. Anaerobic digestion effluent has different characteristics than the output of a hydrothermal process. As seen in the membrane results, freshly collected liquid waste has a different ammonia : organic nitrogen ratio than digester effluent. Source separated manure solids have high levels of organic phosphorus but digester effluent has high concentrations of dissolved phosphate.

Product recovery is only the beginning of the valuation process; as an industry and as a society, we value conservation for other reasons. We do not yet have a well-accepted way to quantify that value. The avoided cost of nitrogen removal from surface waters is a good start to estimate the value of keeping nitrogen out of drainage and runoff but what is the quantified value of preserving the ecosystem services that excess nitrogen disrupts? The cost of recovered phosphorus may be high relative the current price of virgin phosphate from ore but the value of that recovery process includes the avoided problems in rivers, lakes, and estuaries caused by excess nutrients. The fertilizer value of recovered ammonia that was prevented from escaping to the atmosphere may be small compared to the avoided cost of particulate pollution and the associated health problems.

In addition to improved operation of the membrane reactor system, at least three things are needed to fully realize the value of resource recovery:

1. Cost-effective dewater processes. Rejecting inert water can reduce the capital and/or operating cost of almost all waste management processes;

2. Process to quantify the value of ecosystem services and avoided costs of recovery;

3. Cooperation of and investment from major stakeholders in the form of research funding as well as collaboration regarding processes and feed stocks for fertilizer and feed formulations. Animal production companies have historically been involved but fertilizer companies, feed mill operators, animal nutritionists and others must also be involved.

Corresponding author, title, and affiliation

John J. Classen, Associate professor, Biological and Agricultural Engineering, NC State University

Corresponding author email

john_classen@ncsu.edu

Other authors

J. Mark Rice, Extension Specialist, Biological and Agricultural Engineering, NC State University, Kelly Zering, Professor and Extension Specialist, Agricultural and Resource Economics, NC State University

Additional information

John J. Classen

Biological and Agricultural Engineering

Campus Box 7625

North Carolina State University

919-515-6755

Acknowledgements

This project was supported by NRCS CIG Award 69-3A75-12-183. The authors are grateful for the analytical work of the BAE Environmental Analysis Laboratory, Dr. Cong Tu, manager.

The authors are solely responsible for the content of these proceedings. The technical information does not necessarily reflect the official position of the sponsoring agencies or institutions represented by planning committee members, and inclusion and distribution herein does not constitute an endorsement of views expressed by the same. Printed materials included herein are not refereed publications. Citations should appear as follows. EXAMPLE: Authors. 2017. Title of presentation. Waste to Worth: Spreading Science and Solutions. Cary, NC. April 18-21, 2017. URL of this page. Accessed on: today’s date.

Composting of Dairy Manure with the Addition of Zeolites to Reduce Ammonia Emissions

Proceedings Home W2W Home w2w17 logo

Purpose

The purpose of this project was to demonstrate the effects of adding natural clinoptilolite zeolites to a dairy manure compost mix at the moment of initiating the composting process on ammonia emissions, nitrogen retention, composting performance, and characteristics of the final compost product. A typical dairy cow in the U.S. produces approximately 148 lb of manure daily (feces and urine, not counting bedding; Lorimor et al., 2000). This amounts to millions of tons of monthly manure production. On-farm composting of manure is one of the most-used practices to manage dairy manure in Idaho. Composting reduces manure volume between 35 and 50%, which allows the material to be significantly more affordable to transport than fresh, wet manure. Composting converts the nitrogen (N) present in the raw manure into a more stable form, which is released slowly over a period of years and thereby not totally lost to the environment. Composting contributes to alleviating problems associated with ground and surface water contamination and also reduces odor complaints (Rink et al., 1992; Fabian et al., 1993). During the manure handling and composting process, between 50 and 70% of the nitrogen can be lost as ammonia if additional techniques are not used to increase nitrogen retention. In most cases, manures from dairies and other livestock operations don’t have the proper carbon to nitrogen (C:N) ratio to be composted efficiently without added carbon (usual straw bedding has a C:N of 60 to 90). Dairy cow manure is rich in nitrogen (C:N ratios below 18:1), causing a great proportion of the available nitrogen to be lost as ammonia due to the lack of carbon to balance the composting process. The loss of nitrogen from manures as ammonia reduces the nutrient value of the manure, produces an inefficient composting process, and generates local and regional pollution. Lack of carbon also results in a lower-grade compost that can carry elevated concentrations of salts, potassium and phosphorous. In many arid zones there are not enough sources of carbon to balance the nitrogen present in the manure.

Zeolite is a mineral defined as a crystalline, hydrated aluminosilicate of alkali and alkaline earth cations having an infinite, open, three-dimensional structure. Zeolites are able to further lose or gain water reversibly and to exchange cations with and without crystal structure (Mumpton, 1999). Zeolites are mined in several western U.S. states where dairy production also is concentrated. This paper showcases a project that explored the effects of adding natural zeolites to dairy manure at the time of composting as a tool to reduce ammonia emissions and retain nitrogen in the final composted product.

What did we do?

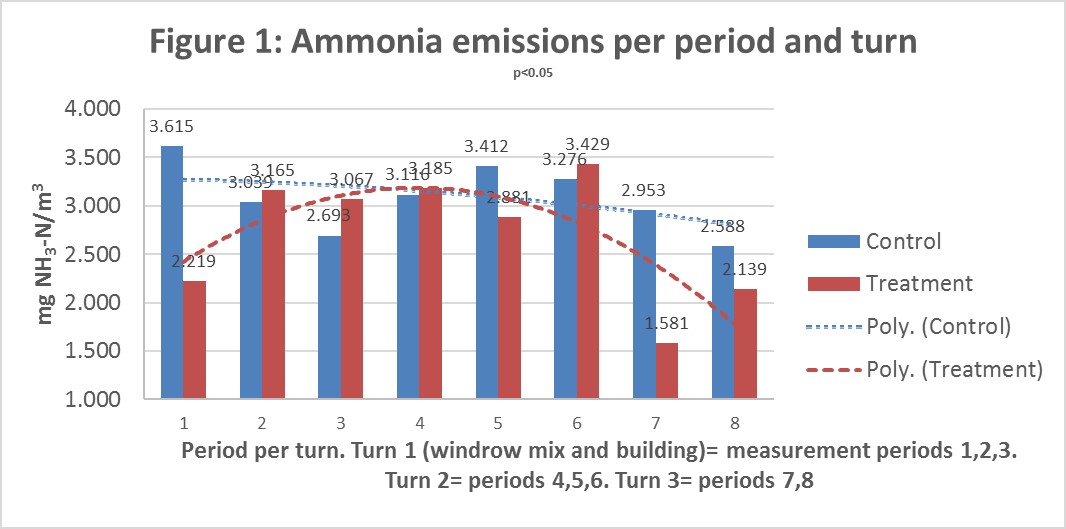
This on-farm research and demonstration study was conducted at an open-lot dairy in southern Idaho with 100 milking Jersey cows. Manure stockpiled during the winter and piled after the corral’s cleaning was mixed with freshly collected manure from daily operations and straw from bedding and old straw bales, in similar proportions for each windrow. The compost mixture was calculated using a compost spreadsheet calculator (WSU-Puyallup Compost Mixture Calculator, version 1.1.; Puyallup, WA). Moisture was adjusted by adding well water to reach approximately 50% to 60% moisture on the initial mix. Windrows were mixed and mechanically turned using a tractor bucket. Three replications were made on control and treatment. The control consisted of the manure and straw mix as described. The treatment consisted of the same mix as the control, plus the addition of 8% of clinoptilolite zeolite by weight during the initial mix. Windrows were actively composted for four months or more. Ammonia emissions were measured using passive samplers (Ogawa & Co., Kobe, Japan) for the first five to seven days after building each windrow (called turn 1 in Figure 1) and after the two subsequent turns. Ammonia emissions per measurement period and per turn were obtained. Three periods of one to three days at the time of building each windrow and after the first turn were measured. After the second turn, two measurement periods of three to four days were made. Values of mg NH3-N/m3 are time-corrected by minutes of sampling (Figure 1). Complete initial manure (compost feedstock mix) and final screened compost nutrient lab analyses were performed for each windrow. Analyses of variance (ANOVA) on lab data and on ammonia samples were performed using SAS 9.4 (SAS Institute, Cary, NC).

Figure 1. Ammonia emissions per period and turn

What have we learned?

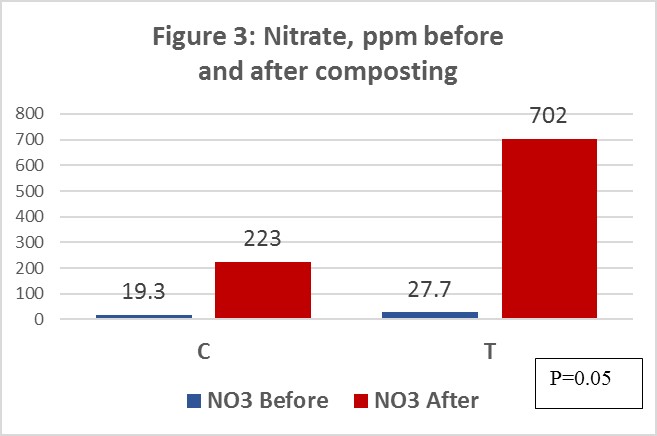
The addition of 8% w/w natural zeolites to the dairy manure compost mix on a mechanically turned system using a tractor bucket reduced cumulative ammonia emissions by 11% during the first three turns (Figure 2) and showed a significant reduction trend in ammonia emissions. Figure 1 shows the differences and trend line in ammonia emissions per monitoring period and per turn. Treated windrows’ cumulative emissions were significantly lower (P<0.05) at 2.76 mg NH3-N/m3 from control windrows at 3.09 mg NH3-N/m3. Nitrates (NO3) on the composted treatment (702 ppm) were 3 times greater (p=0.05) than the control (223 ppm) (Figure 3). These results demonstrate that the addition of natural zeolites has a positive effect on reducing ammonia emissions during the composting process and increasing the conversion to nitrates, retaining nitrogen in the compost in a form that is more available to crops.

Figure 2. Cumulative ammonia emissions

Figure 3. Nitrate, ppm before and after composting

Future Plans

Field days and journal publications about this project are expected to occur within the next year.

Corresponding author, title, and affiliation

M. E. de Haro-Martí. Extension Educator. University of Idaho Extension, Gooding County, Gooding, Idaho.

Corresponding author email

mdeharo@uidaho.edu

Other authors

M. Chahine. Extension Dairy Specialist. University of Idaho Extension, Twin Falls R&E Center, Twin Falls, Idaho. H. Neibling. Extension Irrigation Engineer. University of Idaho Extension, Kimberly R&E Center, Kimberly, Idaho. L. Chen. Extension Waste Management Specialist,

Additional information

References:

Fabian, E. F., T. L. Richard, D. Kay, D. Allee, and J. Regenstein. 1993. Agricultural composting: a feasibility study for New York farms. Available at: http://compost.css.cornell.edu/feas.study.html . Accessed 04/28/2011.

Lorimor, J., W. Powers, A. Sutton. 2000. Manure Characteristics. Manure Management System Series. Midwest Plan Service. MPWS-18 Section 1. Iowa State University.

Mumpton, F.A. 1999. La roca magica: Uses of Natural Zeolites in Agriculture and Industry. Proceedings of the National Academy of Sciences of the United States of America, Vol. 96, No. 7 (Mar. 30, 1999), pp. 3463-3470

Rink, R., M. van de Kamp, G.B. Willson, M.E. Singley, T.L. Richard, J.J. Kolega, F.R. Gouin, L.L. Laliberty Jr., D.K. Dennis. W.M. Harry, A.J. Hoitink, W.F.Brinton. 1992. On-Farm Composting Handbook. NRAES-54. Natural Resource, Agriculture, and Engineering Service. Cooperative Extension. Ithaca, New York.

Acknowledgements

This project was made possible through a USDA- ID NRCS Conservation Innovation Grants (CIG) # 68-0211-11-047. The authors also want to thank the involved dairy farmer and colleagues that helped during this Extension and research project. Thanks to Dr. April Leytem and her technicians at USDA-ARS in Kimberly, ID, for the loan of the Ogawa passive samplers and for sample analysis.

Nutrient Recovery Membrane Technology: Pilot-Scale Evaluation

Proceedings Home W2W Home w2w17 logo

Purpose

Animal manure contains nutrients and organic matter that are valuable to crop production.  Applying manure to nearby fields can be a significant source of environmental contamination, however, if managed incorrectly. In many cases, concentrated animal production facilities are not close enough to sufficient cropland to fully utilize these resources and management of manure becomes more of a disposal issue rather than a utilization opportunity. One potential solution is to remove and concentrate manure nutrients so they can be cost effectively transported longer distances to cropland that is lacking in nutrients.  The objective of this work was to design and test a pilot-scale system to implement a hydrophobic, gas-permeable, ePTFE (a synthetic fluoropolymer) membrane (U.S. patent held by USDA) to recover ammonia from swine wastewater in a solution of sulfuric acid. The pilot-scale system was designed to replicate the laboratory results and to determine critical operational controls that will assist in design of farm-scale systems.

What did we do?

Through a series of preliminary experiments, we established operational criteria and selected a membrane with an inside diameter of 0.16 in., wall thickness of 0.023 in., and a density of 0.016 lb in-3. A test system was developed (Figure 1) with 19 membrane tubes within a 2.01-inch diameter, 24.7-inch-long reactor, giving a membrane density of 3.83 sq. in. per cubic inch of reactor volume. Wastewater first passed through a CO2 stripping column (4.016 in. diameter, 55 in. length) where a small air stream (0.0614 cfm) stripped CO2 from the wastewater and raised the pH one full unit, shifting the equilibrium to NH3 and enhancing transport across the membrane. Batch tests (0.706 ft3) were run for 9-12 days with wastewater recirculating at a rate of 0.16 gpm. The recovery fluid inside the tubular membranes was a 0.01 N sulfuric acid solution with the pH automatically maintained below 4.0 standard units and recirculating at a rate of 1/100th the wastewater flow rate. Freshly collected settled wastewater and anaerobic digester effluent were tested to determine the mass of ammonia collected, the acid required to maintain the low pH of the recovery solution, and potential ammonia losses to the atmosphere.

Figure 1. Schematic of membrane system

What have we learned?

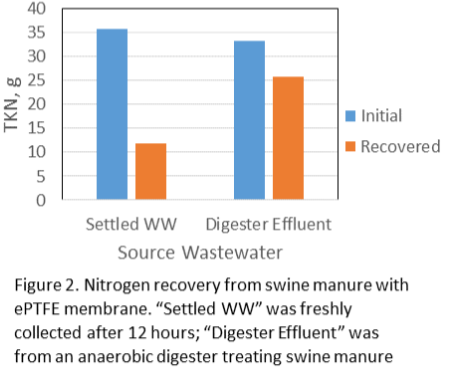
The freshly collected wastewater had an initial mass of 35.6 g nitrogen but the NH3 was only 14.5 g, leading to a recovery of 11.8 g (33% of initial content) over 12 days. The anaerobic digester effluent had an initial mass of 33.2 g nitrogen with an NH3 mass of 31.3 g. The higher fraction of ammonia helped push the recovery to 25.7 g or 77% of the initial nitrogen content (see Figure 2). Very little ammonia was lost with the exhaust air.

Figure 2. Nitrogen recovery from swine manure with ePTFE membrane

Future Plans

An optimized membrane reactor could be a viable tool in ammonia nitrogen recovery from a manure treatment system if used in conjunction with digestion. Higher economic value could be generated by further concentrating the ammonium sulfate product.

Corresponding author, title, and affiliation

John J. Classen, Associate Professor, Biological & Agricultural Engineering, NCSU

Corresponding author email

john_classen@ncsu.edu

Other authors

J. Mark Rice, Extension Specialist, NCSU; Alison Deviney, Graduate Research Assistant, NCSU

Additional information

John J. Classen

Biological and Agricultural Engineering

Campus Box 7625

North Carolina State University

919-515-6755

Acknowledgements

This project was supported by NRCS CIG Award 69-3A75-12-183. The authors are grateful for the analytical work of the BAE Environmental Analysis Laboratory, Dr. Cong Tu, manager.

Additive to Mitigate Odor and Hydrogen Sulfide Gas Risk from Gypsum Bedded Dairy Manure

Proceedings Home W2W Home w2w17 logo

Purpose

Dangerous levels of hydrogen sulfide (H2S) gas released from gypsum-bedding-laden dairy manure storages have imposed risks to animal and human health, as demonstrated both on-farm and in bench scale studies (Fabian-Wheeler et al., 2017; Hile, 2016). Gypsum bedding is popular with some producers for advantages to cow comfort and health along with agronomic benefits. This project demonstrated the effect of iron oxide (FeO2) as a promising additive to dairy manure storages on mitigating H2S releases and odor.

What did we do?

Two bench-scale trials comprised three replicates each (15 kg manure each vessel) of three treatments: (1) control (dairy manure only), (2) manure with gypsum added 0.35% by weight, and (3) manure with gypsum and iron oxide added at a 1:1 molar ratio with gypsum. Headspace gas concentrations were measured using a Fourier transform infrared analyzer (FTIR model 700, California Analytical, Inc., Orange, CA) from each experimental vessel prior to and during manure agitation. Nutrient analyses were performed upon initial mixing and at the end of the incubations (PSU Agricultural Analytical Laboratory and Fairway Laboratories). Final incubation of the first trial included an odor evaluation of headspace gas according to international standard EN 13725 using qualified human assessors at the Penn State Odor Assessment Laboratory (abe.psu.edu/research/natural-resource-protection/odors). Odor quality testing on undiluted headspace gas used the labelled magnitude scale (LMS), Odor Intensity Referencing Scale (OIRS) and Hedonic Tone (pleasantness).

What have we learned?

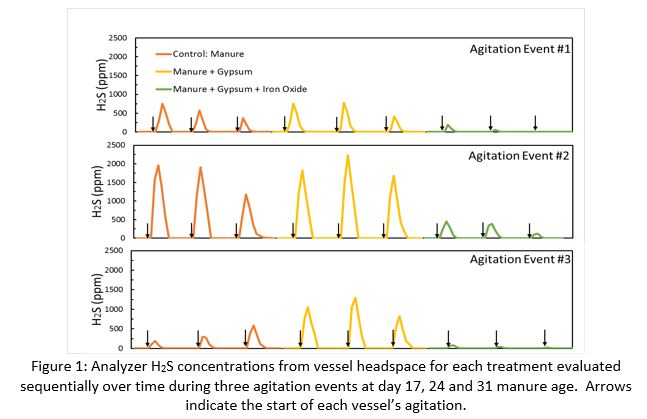
High total sulfur in gypsum-laden manure confirms that gypsum provides the sulfur source that is converted to H2S. However, introduction of iron oxide maintained 98.8% total sulfur of manure sample by the end of incubation. The H2S concentrations remain low (below 5 ppm) in static conditions until gases are immediately released as soon as manure is agitated. Maximum H2S concentrations were reduced 83% to 96% in gypsum-laden manure by adding iron oxide (Figure 1). Despite anecdotal field reports of increased malodor associated with gypsum bedded manure, odor detection threshold (DT) did not increase with addition of gypsum compared to the control (manure only). However a 1:1 molar ration of iron oxide reduced the DT by approximately 50%. Odor quality results show that gypsum-laden manure created a less pleasant odor when compared to control manure.

Figure 1. Analyzer H2S concentrations from vessel headspace for each treatment evaluated sequentially over time during three agitation events at day 17, 24, and 31 manure age

Future Plans

Field-scale research would strengthen these findings and document management and economics associated with the iron oxide treatment use on farm. Additional odor surveys would confirm odor intensity reduction via iron oxide.

Corresponding author, title, and affiliation

Eileen E. Fabian (Wheeler), Professor in Agricultural and Biological Engineering (ABE) at Penn State (PSU)

Corresponding author email

fabian@psu.edu

Other authors

Long Chen, Ph.D. Candidate in ABE at PSU, Dr. Michael Hile, Project Associate in ABE at PSU and Dr. Mary Ann Bruns, Associate Professor in Ecosystems Science & Management at PSU

Additional information

Fabian-Wheeler, E., M. L. Hile, D. J. Murphy, D. E. Hill, R. Meinen, R. C. Brandt, H. A. Elliott, D. Hofstetter. 2017. Operator Exposure to Hydrogen Sulfide from Dairy Manure Storages Containing Gypsum Bedding. Journal Agricultural Safety and Health 23(1): 9-22.

Hile. M. L. 2016. Hydrogen sulfide production in manure storages on Pennsylvania dairy farms using gypsum bedding. Ph.D. dissertation. University Park, PA.: The Pennsylvania State University, Department of Agricultural and Biological Engineering.

Acknowledgements

This work was a partnership of Penn State College of Agricultural Sciences graduate student competitive grant program, Penn State Extension, and USA Gypsum

The authors are solely responsible for the content of these proceedings. The technical information does not necessarily reflect the official position of the sponsoring agencies or institutions represented by planning committee members, and inclusion and distribution herein does not constitute an endorsement of views expressed by the same. Printed materials included herein are not refereed publications. Citations should appear as follows. EXAMPLE: Authors. 2017. Title of presentation. Waste to Worth: Spreading Science and Solutions. Cary, NC. April 18-21, 2017. URL of this page. Accessed on: today’s date.
Developing Science-Based Estimates of Best Management Practice Effectiveness for the Phase 6 Chesapeake Bay Watershed Model

Proceedings Home W2W Home w2w17 logo

Purpose

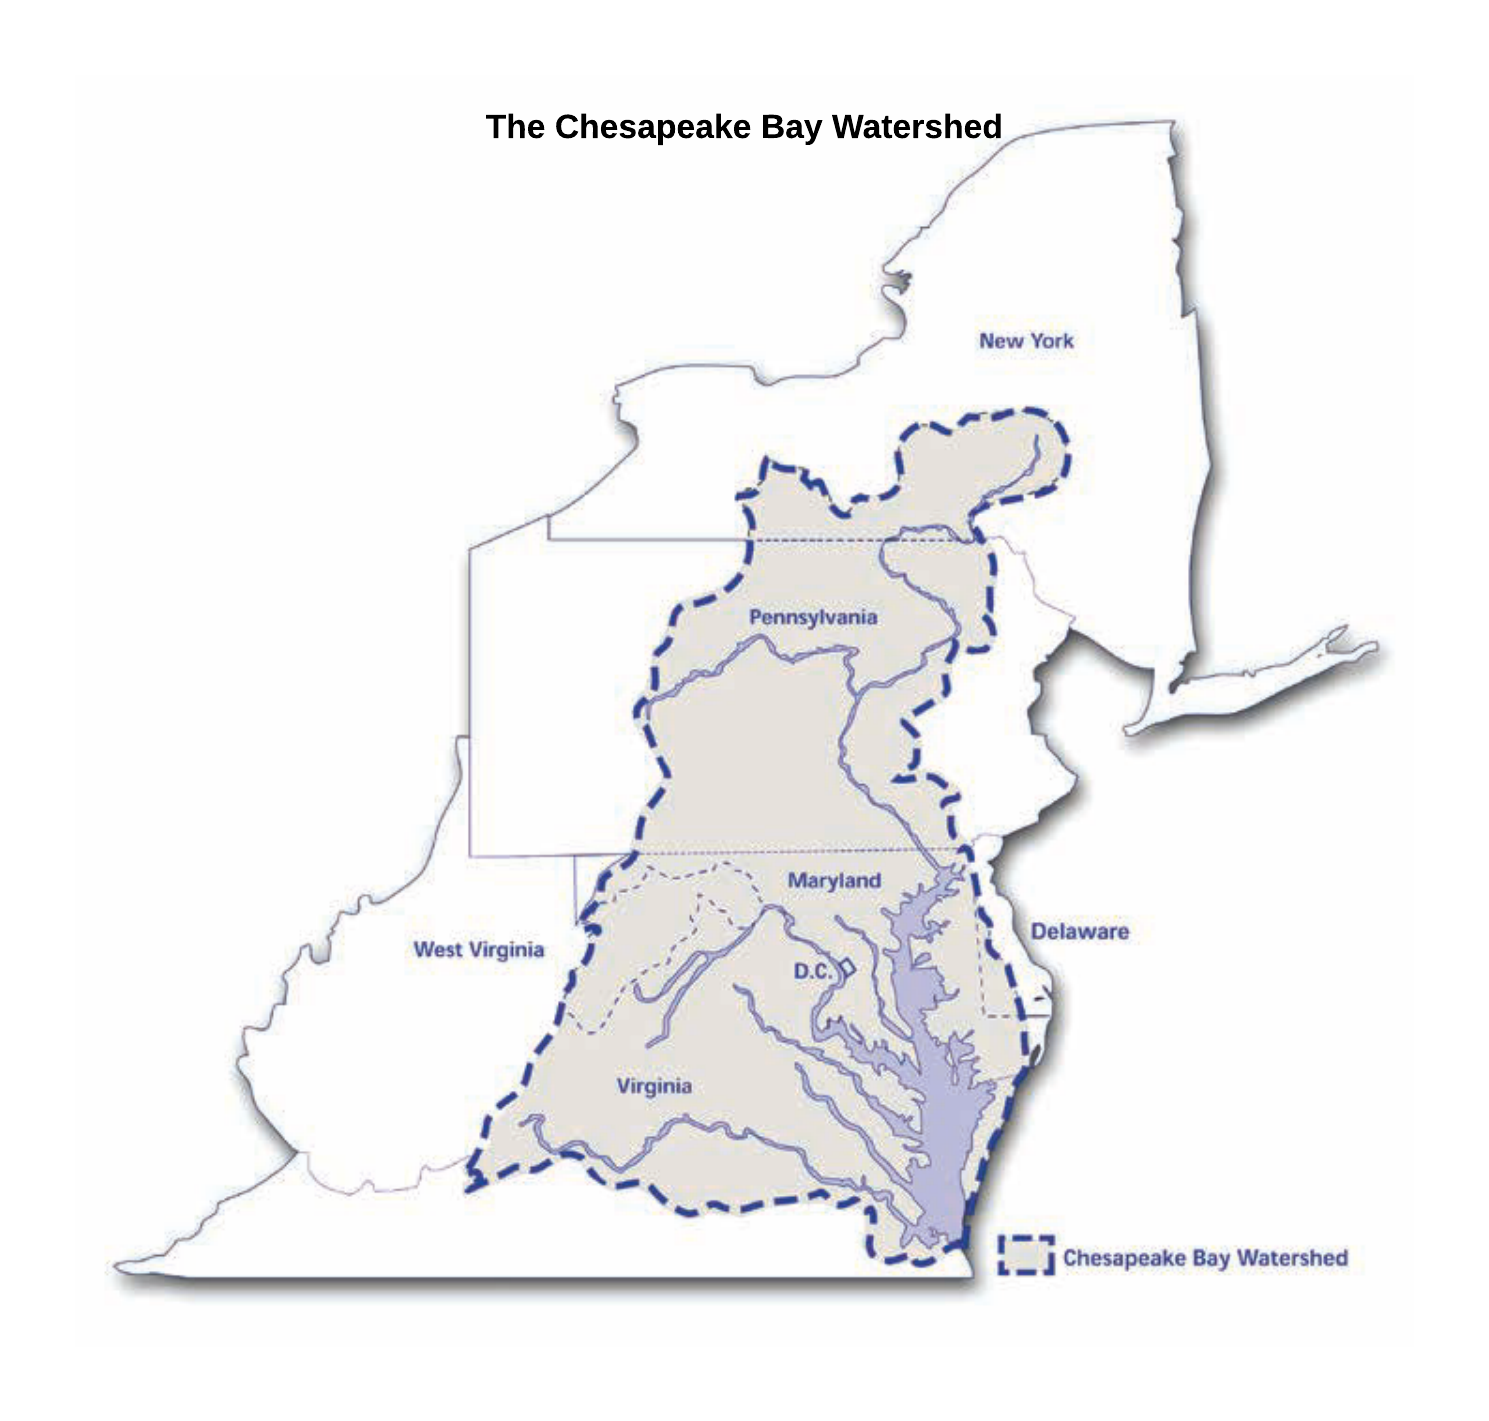
The Chesapeake Bay Program (CBP) is a regional partnership that leads and directs Chesapeake Bay restoration and protection. The CBP uses a suite of modeling and planning tools to estimate nutrient (nitrogen and phosphorus) and sediment loads contributed to the Bay from its watershed, and guide restoration efforts. Non-point source (NPS) pollutant sources (e.g., agricultural and urban runoff) are largely related to diverse land uses stretching across six states and the District of Columbia. On-the-ground pollutant reductions are achieved by implementing both management and structural best management practices (BMPs) on those diverse land uses. Short and long-term reductions in NPS pollutant loads that result from BMP implementation are estimated using the CBP modeling suite of tools. The CBP recognizes (i.e., represents pollutant reduction credits for) over 150 BMPs across 66 land uses total for all sectors in its Phase 6 suite of modeling tools. The estimated pollutant reduction performance (i.e., effectiveness) of each BMP is parameterized in the CBP modeling suite. Within the CBP, BMP effectiveness is determined by groups of qualified scientific and technical experts (BMP Expert Panels) that review the relevant literature and make an independent determination regarding BMP performance which are reviewed and approved by the CBP partnership before being integrated in to the modeling tools by the CBP modeling team.

BMP Expert Panels are primarily convened under the auspices of the CBP’s Water Quality Goal Implementation Team and tasked to specific sector workgroups for oversight and management. Panels are tasked with addressing a specific BMP, or a suite of related BMPs. Panel members, in coordination with the CBP partnership, are selected based on their scientific expertise, practical experience with the BMP, and expertise in fate and transport of nutrients and sediment. Panels review the relevant literature and through a deliberative process and form recommendations on BMP pollutant production performance, and how the BMP(s) should be accounted for/incorporated into the CBP modeling tools and data reporting systems. Convening BMP Expert Panels is an ongoing focus and priority of the CBP partnership, given the integral role BMP implementation plays in achieving the pollution reduction goals required by the 2010 Chesapeake Bay Total Maximum Daily Load (TMDL).

What Did We Do?

Expert panels follow the process and adhere to expectations outlined in the Chesapeake Bay Program Partnership’s Protocol for the Development, Review, and Approval of Loading and Effectiveness Estimates for Nutrient and Sediment Controls in the Chesapeake Bay Watershed Model (aka the “BMP Protocol”). The expert panel process functions as an independent peer review, similar to that of the National Academy of Sciences.

Each panel reviews and discusses all current published literature and available unpublished literature and data related to the BMP(s), and formulates recommendations using the guidance provided in the BMP Protocol to help weigh the applicability of each data source.  Consensus panel recommendations are recorded in a final report, which is presented to relevant CBP partnership groups, including the CBP partnership’s Agriculture Workgroup for feedback and approval.

Panel recommendations are built into the modeling tools following CBP partnership approval of the panel’s report.

Chesapeake Bay Watershed Map

Basic Diagram of the Chesapeake Bay Program Expert Panel BMP Review Process

What Have We Learned?

The availability of published, peer-reviewed data varies greatly based on the scope of the panel. Some panels have dozens of articles to analyze while others may have a limited number of published studies to supplement gray literature, unpublished data and their best professional judgment. Even panels with a large amount of relevant literature at their disposal identify important gaps and future research needs. Given the wide range of stakeholders in the CBP partnership, regular updates and communication with interested parties as the panel formulates its recommendations is extremely important to improve understanding and acceptance of final panel recommendations.

Future Plans

The Chesapeake Bay Program evaluates BMP effectiveness estimates as new research or new conservation and production practices become available. Thus, expert panels sometimes revisit BMPs that were previously reviewed, but new and innovative BMPs are also considered. The availability of resources and new research limit the frequency of these reviews in conjunction with the priorities of the CBP partnership. Given the CBP partnership’s interest in adaptive management and continually improving its scientific estimates of BMP effectiveness, there will continue to be BMP expert panels for the foreseeable future.

Corresponding author (name, title, affiliation)

Jeremy Hanson, Project Coordinator – Expert Panel BMP Assessment, Virginia Tech

Corresponding author email address

jchanson@vt.edu

Other Authors

Mark Dubin, Agricultural Technical Coordinator, University of Maryland Extension

Brian Benham, Professor and Extension Specialist, Virginia Tech

Each expert panel has at least several other authors and contributors, which is not practical for listing here. Each individual report identifies the panel members and other contributors for that specific panel.

Additional Information

The BMP Review Protocol is available online at http://www.chesapeakebay.net/publications/title/bmp_review_protocol

All final expert panel reports are posted on the Chesapeake Bay Program website under “publications”: http://www.chesapeakebay.net/groups/group/bmp_expert_panels

Acknowledgements

These BMP expert panels would not be possible without the generosity of expert panel members who volunteer their valuable time and perspectives. Staff support, coordination and funding for these panels is provided by the EPA Chesapeake Bay Program, specifically through Cooperative Agreements with Virginia Tech and University of Maryland, with additional contract support from Tetra Tech as needed. The work of these expert panels is strengthened through the participation, review and comments of the CBP partnership.

The authors are solely responsible for the content of these proceedings. The technical information does not necessarily reflect the official position of the sponsoring agencies or institutions represented by planning committee members, and inclusion and distribution herein does not constitute an endorsement of views expressed by the same. Printed materials included herein are not refereed publications. Citations should appear as follows. EXAMPLE: Authors. 2017. Title of presentation. Waste to Worth: Spreading Science and Solutions. Cary, NC. April 18-21, 2017. URL of this page. Accessed on: today’s date.
Recommendations of the Chesapeake Bay Program Expert Panel on Manure Treatment Technologies

Proceedings Home W2W Home w2w17 logo

Purpose

The US EPA Chesapeake Bay Program assesses nutrient loading to the Chesapeake Bay. There is a need to determine the impact of manure treatment technologies on reducing the nitrogen and phosphorus loading from agriculture. Furthermore, many states within the Chesapeake Bay Watershed control nutrient discharges through watershed nutrient trading programs. Tables of standard nutrient removal efficiencies of various technologies will allow states to implement these programs.

What did we do?

The panel standing on the dock of the Chesapeake Bay

An expert panel was convened by the EPA Chesapeake Bay Program to determine nutrient removal potential of manure treatment technologies. The following seven technology categories were reviewed: thermochemical processing, anaerobic digestion, composting, settling, mechanical solid-liquid separation, and wet chemical treatment. Within these categories, the panel defined 24 named technologies for detailed review. The scientific literature was reviewed to determine the ability of each technology to transfer volatile nitrogen to the atmosphere and transfer nutrients to a waste stream more likely to be used off-farm (or transported out of the Chesapeake Bay Watershed).

What have we learned?

Manure treatment technologies are used reduce to odors, solids, and organic matter from the manure stream, with only minor reductions in nutrient loading. The panel determined that Thermo-Chemical Processing and Composting have the potential to volatilize nitrogen, and all of the technologies have the ability to transfer nutrients into a more useful waste stream. The greatest effect of treatment technologies is the transformation of nutrients to more stable forms – such as precipitation of insoluble phosphorus from dissolved phosphorus.

Future Plans

The panel’s report is undergoing final authorization from the Chesapeake Bay Program for release to the public. Future panels may choose to revisit the issue of nutrient reduction from manure treatment technologies. The current panel recommends future panels expand the categories of technologies to include liquid aerobic treatment, and examine more named technologies as they become available within the Chesapeake Bay Watershed.

Corresponding author, title, and affiliation

Douglas W. Hamilton, Associate Professor Oklahoma State University

Corresponding author email

dhamilt@okstate.edu

Other authors

Keri Cantrell, KBC Consulting;John Chastain, Clemson University; Andrea Ludwig, University of Tennessee; Robert Meinen, Penn State University; Jactone Ogejo, Virginia Tech; Jeff Porter, USDA Natural Resource Conservation Service, Eastern Technology Suppor

Additional information

https://www.chesapeakebay.net/

http://osuwastemanage.bae.okstate.edu/

Two related presentations given at the same session at Waste to Worth 2017

Acknowledgements

Funding for this panel was provided by the US EPA Chesapeake Bay Program and Virginia Tech University through EPA Grant No. CB96326201

The authors are solely responsible for the content of these proceedings. The technical information does not necessarily reflect the official position of the sponsoring agencies or institutions represented by planning committee members, and inclusion and distribution herein does not constitute an endorsement of views expressed by the same. Printed materials included herein are not refereed publications. Citations should appear as follows. EXAMPLE: Authors. 2017. Title of presentation. Waste to Worth: Spreading Science and Solutions. Cary, NC. April 18-21, 2017. URL of this page. Accessed on: today’s date.