As livestock and poultry production has intensified it is no surprise that regulations have become a more prominent part of the business. This module introduces the Clean Water Act (CWA) and it application to animal agriculture. This material was developed for use in beginning farmer and extension programs, high school classrooms, and for self-study or professional continuing education.
Agriculture Professionals and Farmers
Check out this self-study module “Playing By the Rules“. This module is estimated to take 60 minutes and offers a certificate upon successful completion.
Teachers, Extension, Consultants
Educators are welcome to use the following materials in their classrooms and educational programs. More modules…
Instruction Guide – includes lesson plan, links to additional information, connections to national agriculture education standards (AFNR Career Content Cluster Standards), application to Supervised Agricultural Experience (SAE) projects, sample quiz/review questions, and enrichment activities.
Reviewers: Paul Hay, University of Nebraska, Lyle Holmgren, Utah State University, Jill Heemstra, University of Nebraska, Elizabeth Burns Thompson, Drake University (law student), Mary Catherine Barganier, NYFEA, Shannon Arnold, Montana State.
Why Look at Barriers in Nutrient Management Information Flow?
The issue of manure nutrient management has been the subject of controversy and new policies in recent years as the non-point source discharge of nutrients and bacteria is substantial if manure is not managed properly. Unfortunately, there are barriers between organizations and individuals that prevent the flow of important, timely information between audience types and limits the impact and usefulness of research results. These barriers may be in the form of institutional language differences, job descriptions, or a mismatch between information outputs and inputs.
What did we do?
A national team of researchers, Extension specialists, consultants and government staff developed a survey to quantify the role, programming, and barriers to information flow between organizations and individuals regarding manure nutrient management. The electronic survey was disseminated via cooperating agencies, organizations and personal contacts to technical service providers, producers, university personnel, regulatory personnel, private sales or service enterprises and other professionals who contribute to manure nutrient management in South Dakota. Respondents were asked to indicate the relevance of information sources (inputs), information products (outputs) and collaborators (links), as well as barriers to their use. The relevance selections were transformed into scalar data and an analysis of variance was performed on the average relevance scores to test for differences based on input/output/link type and organization type.
What have we learned?
There were 139 surveys started, and 80 surveys completed. Data from partially completed surveys were, however, included in the analysis. The main categories of self-identified respondents were NRCS (n=36), Producers (n=29), University personnel (n=15) and Regulatory personnel (n=9). The remaining categories respondents were grouped into an Other category (n=22). The average relevance score for each of the information sources, information products and collaborations listed in the survey were consistent (no significant difference between organization types). As sources of information, consultation, eXtension and field days were ranked most relevant, with classroom and social media being least relevant. Similarly, consultation, field days and eXtension were ranked the most relevant means of sharing information; social media was ranked least relevant. Barriers to information sources and products were specific to the activity or product. The select ion “No barriers to use” was not an indicator of relevance. All organization types deemed producers the most relevant collaborator, followed by state, university and federal agencies.
Future Plans
The South Dakota-based survey was a pilot test for a nationwide survey being conducted in 2015. From feedback and data review, the survey has been refined and shortened to elicit the key input, output and collaborator data. With the national data in hand later in 2015, the project team looks forward to linking information producers and users in effective pathways for manure nutrient management information transmission, and ultimately, adoption.
Authors
Erin Cortus, Assistant Professor and Environmental Quality Engineer at South Dakota State University erin.cortus@sdstate.edu
Nichole Embertson, Nutrient Management Specialist, Sustainable Livestock Production Program, Whatcom Conservation District; Jeffrey Jacquet, Assistant Professor, Sociology and Rural Studies, South Dakota State University
The nationwide team who contribute to and guide the Pathways project are gratefully acknowledged. Funding provided through the South Dakota SARE Mini-Grant Program supported data collection and analysis for the survey pilot test.
The authors are solely responsible for the content of these proceedings. The technical information does not necessarily reflect the official position of the sponsoring agencies or institutions represented by planning committee members, and inclusion and distribution herein does not constitute an endorsement of views expressed by the same. Printed materials included herein are not refereed publications. Citations should appear as follows. EXAMPLE: Authors. 2015. Title of presentation. Waste to Worth: Spreading Science and Solutions. Seattle, WA. March 31-April 3, 2015. URL of this page. Accessed on: today’s date.
Currently, there is limited regulation of ammonia (NH3) emissions as a matter of federal policy. The Clean Air Act (CAA) provides the federal authority for regulation of these emissions. Although there are reporting requirements for NH3 under the Comprehensive Environmental Response, Compensation and Liability Act and Emergency Planning and Community Right-To-Know Act, these statutes do not provide authority to regulate emissions of NH3. There is increasing pressure to change NH3 policy primarily due to concerns about nutrient enrichment of large water bodies, such as the Chesapeake Bay and the Gulf of Mexico. Recently, the EPA has been petitioned to list NH3 as a criteria pollutant; and this request is somewhat supported by the report from the EPA’s Integrated Nitrogen Panel to the Science Advisory Board. There is also the immediate concern of EPA’s treatment of NH3 as a precursor to fine particulate matter (PM2.5). Regulation of NH3 as a precursor to PM2.5 will make it a regulated pollutant under the CAA. It will be difficult to regulate only the ‘excess’ portion of reactive N, particularly since ‘excess’ cannot be defined as a constant. Roughly 60- 85% of NH3 emissions in the U.S. are estimated to come from agricultural sources, a sector that varies considerably from the traditional industrial sources addressed by the environmental statutes. In fact, in most of these statutes, there is recognition that agricultural sources are different; and some regulatory exemptions are provided. Most likely, Congress did not anticipate the application of the CAA to agricultural sources or it would have included some exemptions in it as well. Nevertheless, regulation of NH3 emissions under the CAA will make it extremely difficult for EPA to consider the positive value and need for fertilizer NH3, which could have huge implications for the viability of the domestic and global food supply.
Purpose
Members of the U.S. Department of Agriculture’s Agricultural Air Quality Task Force (AAQTF) recognize the ever increasing pressure to change ammonia policy in the United States and to regulate sources of ammonia emissions under various environmental statutes including the Clean Air Act (CAA). Ammonia is not your ordinary air pollutant and will be difficult to regulate appropriately under the current construct of the CAA. Therefore, members of the AAQTF developed and approved a paper outlining information that regulators should consider before regulating ammonia emissions entitled, “Ammonia Emissions: What to Know Before You Regulate.”
What did we do?
Consideration of NH3 as an air pollutant will require the EPA to acknowledge and address the role of NH3 in the full nitrogen (N) cycle and specifically address emission reduction measures that do not merely transfer NH3 from one environmental medium to another. It will be difficult to regulate only the “excess” portion of reactive N, particularly since “excess” cannot be defined as a constant. Regulation of NH3 emissions under the CAA will make it extremely difficult for EPA to consider the positive value and need for fertilizer NH3, which could have huge implications for the viability of the domestic and global food supply.
To date, pollutants regulated under the CAA are considered “bad” for public health and for the environment; and the statute is designed to limit the impacts of these pollutants by reducing or eliminating their emissions. As EPA moves to regulate greenhouse gases, it is encountering difficulty in applying the existing statute in its consideration of carbon dioxide as a pollutant, which is a necessary component of the life cycle of plants and animals. Regulation of NH3 emissions within the constraints of the existing CAA will prove no less daunting and may lead to costly and illogical outcomes with little actual benefit to the environment or human health.
Prior to regulating ammonia emissions, EPA regulators must fully understand ammonia’s role in agriculture. Not only must there be an understanding of the nitrogen cycle from a chemical perspective, but there must be a full understanding from a biological perspective as well. These biological processes cannot be easily predicted or controlled and are based on many factors such as geographic region, cropping system, management practices, soil characteristics, climate and field variability. In animal production systems, there must be an understanding of diets and nitrogen use efficiency of the various species and the impacts of the housing systems, manure characteristics and management, and climate variables.
The EPA regulators must also not only understand the fate, transport, and transformation of atmospheric ammonia but must be able to quantify these processes. Any regulation of agricultural sources of ammonia should be informed by knowledge of management practices that will reduce emissions without negatively impacting animal and plant health and production levels. Ammonia reduction strategies must be considered across the entire production spectrum and not on individual aspects of production.
Underlying any regulation must be accurate measurement of the emissions and the ability to measure compliance, i.e., reductions and impacts. However, ammonia emissions are fugitive, vary spatially and temporally, and are readily influenced by many factors (e.g., source, climate, management practices, etc.) making it difficult to determine at a farm level, a precise emission factor. There are currently no easy and economical ways to directly monitor emissions from commercial livestock and cropping farms, which will make emissions estimation and enforcement challenging. Proceeding to regulation without proven methodologies for measurement of agricultural sources of ammonia and the ability to demonstrate scientifically the effectiveness of reduction practices, does not seem appropriate.
Nitrogen is essential to both crop and animal production, and when not supplied in sufficient amounts, will decrease both crop yield and animal productivity, risk declining soil system health and sustainability, and generate a loss for producers and perhaps even increase the overall environmental footprint of agricultural activities. Certain management or mitigation practices may be too costly for many producers given the current market value of agricultural commodities, so any regulation must considered how these costs will be covered.
What have we learned?
A collaborative dialogue with the agricultural community needs to occur prior to considering regulation. Current approaches of voluntary and incentive-based efforts are accomplishing significant improvements in soil health and reducing erosion and loss of nutrients, and agencies should recognize these improvements.
EPA can assist constructive dialog by avoiding regulatory silos and embracing holistic approaches in development of policies as it focuses on the agricultural sector; avoiding “One size fits all” style requirements; and avoiding multiple regulations on the same practice.
Farmers of the U.S. and the world must meet the food, fiber, and fuel needs of the predicted nine billion people by 2050. Therefore, any regulation of ammonia under the Clean Air Act must address its impact on the sustainability of domestic and global food supply as part of the mandatory statutory requirement to evaluate public health and welfare effects and the vitality of rural communities.
Future Plans
The AAQTF will continue to address these issues and attempt to facilitate future dialogue with EPA and USDA on these issues.
The contributions of members of the AAQTF to the discussions of these issues and to the development of the paper are recognized and greatly appreciated.
The authors are solely responsible for the content of these proceedings. The technical information does not necessarily reflect the official position of the sponsoring agencies or institutions represented by planning committee members, and inclusion and distribution herein does not constitute an endorsement of views expressed by the same. Printed materials included herein are not refereed publications. Citations should appear as follows. EXAMPLE: Authors. 2015. Title of presentation. Waste to Worth: Spreading Science and Solutions. Seattle, WA. March 31-April 3, 2015. URL of this page. Accessed on: today’s date.
This project was started to work with regional CIG projects to calibrate and harmonize Phosphorus Indices across the U.S., demonstrate their accuracy in identifying the magnitude and extent of phosphorus loss risk, and provide suggestions to refine or improve existing Indices. This research is important to provide consistency among state Phosphorus Indices and their subsequent recommendations.
What did we do?
We will combine and compare results from each of the four regional and state Phosphorus Index CIG-funded projects, in order to synthesize, summarize, and describe the science-based information and lessons learned from the individual Phosphorus Index assessment projects (i.e., Chesapeake Bay Watershed, Heartland Region, Southern States and Ohio Lake Erie Basin) and build a harmonized framework that yields consistent Phosphorus-based risk assessment across the U.S. by doing this, we plan to ensure that the refinement of Phosphorus Indices is grounded in the best available science, reflects local environmental and agronomic conditions, anticipates impacts to water quality and farm management, and provides consistent recommendations within and across varied physiographic regions of the U.S.
What have we learned?
Despite the success of the Phosphorus Index concept in state-level nutrient management planning strategies as part of the NRCS 590 Standard, there remain concerns about the effectiveness of the Indexing approach for attaining water quality goals. Different versions of the Phosphorus Index have emerged to account for regional differences in soil types, land management, climate, physiographic and hydrologic controls, manure management strategies, and policy conditions. Along with this development, differences in Phosphorus Index manure management recommendations under relatively similar site conditions have also emerged. To date, we have learned that the individual projects with slightly differing objectives have shown there to be a paucity of field measured runoff, against which to reliably compare Index performance. Thus, several off-the shelf and pre-calibrated models (e.g., APEX) were tested to provide adequate phosphorus runoff information to validate Indices. Use of off-the-shelf models can provide unreliable estimates of phosphorus runoff, while calibrate models can provide more reliable estimates when given adequate site information.
Future Plans
It is planned to have extend the research for one more year to the end of 2016 to continue model assessment, compile field runoff databases, conduct statistical and uncertainty analyses, and compile cross project findings.
Authors
Andrew Sharpley, Distinguished Professor, Division of Agriculture University of Arkansas System sharpley@uark.edu
Deanna Osmond, Professor and Soil Science Department Extension Leader; David Radcliff, Professor; Peter Kleinman, Research Leader; Doug Beegle, Distinguished Professor of Agronomy; John Lory, Associate Professor of Extension; and Nathan Nelson, Professor.
Additional information
Sharpley, A.N., D. Beegle, C. Bolster, L. Good, B. Joern, Q. Ketterings, J. Lory, R. Mikkelsen, D. Osmond, and P. Vadas. 2011. Revision of the 590 Nutrient Management Standard: SERA-17 Recommendations. Southern Cooperative Series Bulletin No. 412. Published by SERA-IEG-17, Virginia Tech. University, Blacksburg, VA. Available at https://sera17dotorg.files.wordpress.com/2015/02/590-sera-17-recommendations.pdf 2011.
Sharpley, A.N., D. Beegle, C. Bolster, L. Good, B. Joern, Q. Ketterings, J. Lory, R. Mikkelsen, D. Osmond, and P. Vadas. 2011. Revision of the 590 Nutrient Management Standard: SERA-17 Supporting Documentation. Southern Cooperative Series Bulletin No. 412. Published by SERA-IEG-17, Virginia Tech. University, Blacksburg, VA. Available at https://sera17dotorg.files.wordpress.com/2015/02/590-sera-17-recommendations.pdf
Sharpley, A.N., D.G. Beegle, C. Bolster, L.W. Good, B. Joern, Q. Ketterings, J. Lory, R. Mikkelsen, D. Osmond, and P.A. Vadas. 2012. Phosphorus indices: Why we need to take stock of how we are doing. J. Environ. Qual. 41:1711-1718.
Osmond, D.L., A.N. Sharpley, C. Bolster, M. Cabrera, S. Feagley, B. Lee, C. Mitchell, R. Mylavarapu, L. Oldham, F. Walker, and H. Zhang. 2012. Comparing phosphorus indices from twelve southern USA states against monitored phosphorus loads from six prior southern studies. J. Environ. Qual. 41:1741-1750.
The authors are solely responsible for the content of these proceedings. The technical information does not necessarily reflect the official position of the sponsoring agencies or institutions represented by planning committee members, and inclusion and distribution herein does not constitute an endorsement of views expressed by the same. Printed materials included herein are not refereed publications. Citations should appear as follows. EXAMPLE: Authors. 2015. Title of presentation. Waste to Worth: Spreading Science and Solutions. Seattle, WA. March 31-April 3, 2015. URL of this page. Accessed on: today’s date.
The great Texas Oil Boom, also referred to as the Gusher Age, provided for dramatic economic growth in the US in the early 20th century, and ushered in rapid development and industrial growth. Although we typically think of the Middle East when we consider the impacts of oil discoveries on local economies (reference Dubai), at the time of its discovery, the oil finds in Texas were unprecedented; and the US quickly became the world’s top producer of petroleum.
As we all know, the rest of the world came to the party, and the US was soon falling in the ranks of top petroleum producers. Though the US oil reserves are vast, increasing concerns over the environmental impacts of finding, mining, extracting, refining, and consuming fossil fuels has incentivized the development of renewable energy resources, such as solar, wind, hydro, and bioenergy. Of these forms of renewable energy, bioenergy holds the promise for replacement of fossil fuels for transportation use.
What did we do?
Bioenergy may be described as fuels derived from organic materials, such as agricultural wastes, through processes like anaerobic digestion. The US has even more organic resources above the Earth’s surface than are identified in the petroleum and natural gas deposits yet to be exploited, yet the development of agricultural bioenergy systems seems to be progressing at a snail’s pace, as compare to the great Oil Boom. There is enormous potential in producing biogas from agricultural, industrial, municipal solid waste, sewage and animal byproducts which can be used to fuel vehicles. The EPA estimates that 8,200 US dairy and swine operation could support biogas recovery systems, as well as some poultry operations. Biogas can be collected from landfills and used to power natural gas vehicles or to produce energy. Wastewater treatment plants are estimated by the EPA to have the potential of about 1 cubic foot of digester gas per 100 gallons of wastewater, this energy could potentially meet 12% of the US electricity demand. Industrial, commercial and institutional facilities provide another source of biogas, in particular supermarkets, restaurants, and educational facilities with food spoilage.
What have we learned?
This presentation compares and contrasts the historical development of fossil fuel reserves with the potential for development of bioenergy from agricultural sources, such as animal wastes and crop residues. The US energy potential from these sources is grossly quantified, and current development inhibitions are identified and discussed. Opportunities for gathering biogas and bioenergy from multiple regional sources, similar to the processes used in the Texas oil fields, are discussed. The presentation offers insight into overcoming these obstacles, and how the US may once again rise to the top of the energy development rankings through efficient use and stewardship of our organic resources.
Future Plans
Biogas and bioenergy resources present an enormous opportunity for renewable energy development, and progression toward energy independence for the U.S. The U.S. currently has more than 2,000 active biogas harvesting sites, but claims more than 11,000 additional sites can be developed in the U.S., with the potential to power more than 3 million American homes if used to fuel electricity generating power plants. The USDA, EPA and DOE recently created a US Biogas Opportunities Roadmap which is off to a good start, which hopefully will initiate biogas programs, and foster investment in biogas systems to improve the market vitality in each state. To move the process forward, policy-makers, investors and the public need to have improved collaboration and communication on the state level. We need to develop a clear plan and strategy for developing these valuable biogas resources to promote environmental sustainability and economic growth of our b ioenergy sector.
The authors are solely responsible for the content of these proceedings. The technical information does not necessarily reflect the official position of the sponsoring agencies or institutions represented by planning committee members, and inclusion and distribution herein does not constitute an endorsement of views expressed by the same. Printed materials included herein are not refereed publications. Citations should appear as follows. EXAMPLE: Authors. 2015. Title of presentation. Waste to Worth: Spreading Science and Solutions. Seattle, WA. March 31-April 3, 2015. URL of this page. Accessed on: today’s date.
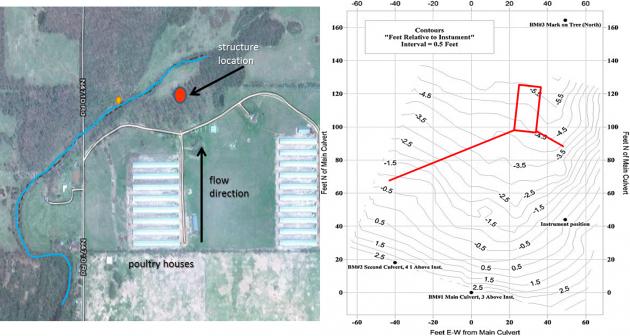
To illustrate a case study design and construction of a phosphorus removal structure on a poultry farm, and to present the basics of how to properly design a structure.
What did we do?
We constructed a phosphorus (P) removal structure on a poultry farm in Eastern OK; this is a BMP that can remove dissolved P loading in the short term until soil legacy P concentrations decrease below levels of environmental concern. A P removal structure contains P sorbing materials (PSMs) and are placed in a location to intercept runoff or subsurface drainage with high dissolved P concentrations. As high P water flows through the PSMs, dissolved P is sorbed onto the materials by several potential mechanisms, allowing low P water to exit the structure. While they vary in form, P removal structures contain three main elements: 1) use of a filter material that has a high affinity for P, 2) containment of the material, and 3) the ability to remove that material and replace it after it becomes saturated with P and is no longer effective.
A site was identified which met all criteria for justification of construction of a P removal structure: 1) elevated dissolved P concentrations in runoff (>0.2 ppm), 2) hydraulic connectivity between the runoff/drainage produced and a surface water body, and 3) flow convergence: the site possessed potential to channel the runoff water to a single point in order to treat the water. This site was located on a poultry farm in Eastern OK.
The site was surveyed in order to obtain the necessary inputs for properly designing the P removal structure. This involved a basic NRCS survey to estimate watershed size, peak flow rates, and average annual runoff volume. In addition, several runoff grab samples were taken and analyzed for dissolved P. This information was used to determine the average annual dissolved P load, which was 45 lbs.
Knowing flow and P load parameters, we additionally chose P removal targets and desired lifetime of the structure. We chose to design a structure that would remove 20 lbs of dissolved P during the first year and be able to handle 700 gpm flow rate. Several hypothetical designs were made based on the available P sorbing materials (PSMs), such as drinking water treatment residuals, acid mine residuals, and gypsum. We chose to use a treated steel slag material as the PSM in the structure; this required about 35 tons of material.
After construction, the performance of the structure was monitored by measuring flow rates and dissolved P concentrations at the inlet and outlet. In addition, we developed software to aid in proper design of a site specific P removal structure using any PSM, in order to meet desired P removal goals and lifetime. Alternatively, this software can be used to predict the performance and lifetime of a P removal structure that has been already constructed. Licensing of software is available for private industry.
We constructed a P removal structure on a poultry farm in Eastern OK; this is a BMP that can remove dissolved P loading in the short term until soil legacy P concentrations decrease below levels of environmental concern. A P removal structure contains P sorbing materials (PSMs) and are placed in a location to intercept runoff or subsurface drainage with high dissolved P concentrations. As high P water flows through the PSMs, dissolved P is sorbed onto the materials by several potential mechanisms, allowing low P water to exit the structure. While they vary in form, P removal structures contain three main elements: 1) use of a filter material that has a high affinity for P, 2) containment of the material, and 3) the ability to remove that material and replace it after it becomes saturated with P and is no longer effective.
A site was identified which met all criteria for justification of construction of a P removal structure: 1) elevated dissolved P concentrations in runoff (>0.2 ppm), 2) hydraulic connectivity between the runoff/drainage produced and a surface water body, and 3) flow convergence: the site possessed potential to channel the runoff water to a single point in order to treat the water. This site was located on a poultry farm in Eastern OK.
The site was surveyed in order to obtain the necessary inputs for properly designing the P removal structure. This involved a basic NRCS survey to estimate watershed size, peak flow rates, and average annual runoff volume. In addition, several runoff grab samples were taken and analyzed for dissolved P. This information was used to determine the average annual dissolved P load, which was 45 lbs.
Knowing flow and P load parameters, we additionally chose P removal targets and desired lifetime of the structure. We chose to design a structure that would remove 20 lbs of dissolved P during the first year and be able to handle 700 gpm flow rate. Several hypothetical designs were made based on the available P sorbing materials (PSMs), such as drinking water treatment residuals, acid mine residuals, and gypsum. We chose to use a treated steel slag material as the PSM in the structure; this required about 35 tons of material.
After construction, the performance of the structure was monitored by measuring flow rates and dissolved P concentrations at the inlet and outlet. In addition, we developed software to aid in proper design of a site specific P removal structure using any PSM, in order to meet desired P removal goals and lifetime. Alternatively, this software can be used to predict the performance and lifetime of a P removal structure that has been already constructed. Licensing of software is available for private industry.
What have we learned?
The P removal structure has removed approximately 67% of all dissolved P that has flowed into it over a 16-month time period. In addition, it has handled all flow volume from every event, including a runoff event that resulted in 600 gpm. That single event delivered 2/3 lb of dissolved P, in which the structure removed 66%. While the structure is removing P as predicted based on P loading, the structure has greatly outlasted the goal of removing 45% of cumulative dissolved P in one year. This is due to the below average rainfall received over the last two years.
We also learned about the potential positives and negatives of using certain PSMs. For example, although we could have used other PSMs, in much smaller quantities (2-10 tons) that would remove equal amounts of P, we would have had to build a structure that was much larger in surface area, due to the fact that the hydraulic conductivity of these PSMs is relatively low. It is also possible to build these structures with other materials for the frame, such as concrete, earth, or wood. Structures can be constructed in ditches or potentially in the subsurface to treat tile drainage.
Last, we have some sense of economics for P removal structures and the general cost of P removal compared to other BMPs.
Future Plans
We will continue to monitor the structure. In addition, we are cooperating with several people throughout the US in helping to design P removal structures. We are also releasing design software for licensing in an attempt to promote commercialization of this BMP through private industry. A NRCS standard is currently underway and the goal is for this BMP to become cost-shared. Last, we are continuing to investigate the economics of P removal structure over a large scale area.
Authors
Chad Penn, Associate professor of agricultural and environmental chemistry, Oklahoma State University chad.penn@okstate.edu
Josh Payne, Animal waste specialist, Oklahoma State University; James Bowen, graduate assistant; Stuart Wilson, senior research specialist, Oklahoma State University; Josh McGrath, associate professor of nutrient management, University of Kentucky
The authors are solely responsible for the content of these proceedings. The technical information does not necessarily reflect the official position of the sponsoring agencies or institutions represented by planning committee members, and inclusion and distribution herein does not constitute an endorsement of views expressed by the same. Printed materials included herein are not refereed publications. Citations should appear as follows. EXAMPLE: Authors. 2015. Title of presentation. Waste to Worth: Spreading Science and Solutions. Seattle, WA. March 31-April 3, 2015. URL of this page. Accessed on: today’s date.
The anaerobic digestion (AD) industry often is in need of laboratory testing to assist them with issues related to project development, digester performance and operation, and co-digestion incorporation. This presentation will highlight laboratory procedures that can be carried out through a University partnership, including biochemical methane productivity (BMP), specific methane activity assays (SMA), anaerobic toxicity assays (ATA), solids, nutrient and elemental proximate analysis for inputs, outputs and co-products, as well as a host of other activities. The presentation will illustrate the lessons that can be learned from the results of these tests, using real-life examples of testing already completed for industry partners.
Why Provide Guidance on Laboratory Testing for Anaerobic Digestion?
Laboratory testing allows characterization of anaerobic digestion (AD) inputs, outputs, and process stability. Testing can be carried out within AD industry laboratories, and they can also be carried out through partnerships with active AD research laboratories at academic institutions. The purpose of this project was to provide a document that summarizes common laboratory procedures that are used to evaluate AD influents, effluents, and process stability and to illustrate real-life examples of laboratory test results.
What did we do?
The overview of common laboratory procedures was written based on the need to introduce third-party AD developers and government agencies to evaluating AD outputs and process stability. The authors are practiced at performing AD laboratory tests and have expertise and valuable information concerning these types of evaluations. Following a description of each test, we included the purpose of the test and an example of how the test results can be interpreted.
What have we learned?
Laboratory testing of AD samples is performed to determine the concentration of certain constituents such as organic carbon, volatile fatty acids, ammonia-N, organic-N, phosphorus, and methane. Contaminants can be tested for such as fecal coliform indicator pathogens, pesticides, and pharmaceuticals. Understanding the concentration of specific constituents enables informed decisions to be made about appropriate effluent management.
Biochemical methane potential (BMP) and specific methanogenic activity (SMA) tests are used to estimate the biogas and methane that can be produced from an organic waste or wastewater during AD. These tests are often used by industry during the design phase to predict total biogas output, allowing for correct sizing of engines and estimation of potential revenue.
Anaerobic toxicity assays (ATAs) test the effect of different materials on biogas production. Unknown inhibitors may reside within new feedstock materials which can lead to an unanticipated reduction in digester performance, so it is important to use ATAs to test the effect of new feedstock material on the AD system before it is used. A common example is when energy-rich organic materials are added to a digester that practices co-digestion.
Future Plans
Future plans are to prepare an extension fact sheet about the basics of anaerobic digestion effluents and processes, including the overview of common laboratory testing used to evaluate AD influents, effluents, and process stability.
This research was supported by funding from USDA National Institute of Food and Agriculture, Contract #2012-6800219814; and by Biomass Research Funds from the WSU Agricultural Research Center.
The authors are solely responsible for the content of these proceedings. The technical information does not necessarily reflect the official position of the sponsoring agencies or institutions represented by planning committee members, and inclusion and distribution herein does not constitute an endorsement of views expressed by the same. Printed materials included herein are not refereed publications. Citations should appear as follows. EXAMPLE: Authors. 2015. Title of presentation. Waste to Worth: Spreading Science and Solutions. Seattle, WA. March 31-April 3, 2015. URL of this page. Accessed on: today’s date.
Several renewable natural gas (RNG) projects are either recently completed or on the books as potential new projects. With such a new business model, Washington State University, in concert with State officials embarked on a feasibility study to investigate costs/revenues as well as project consideration, hurdles and options for production of RNG as compared to an industry standard combined heat and power (CHP) model. The feasibility study was for an existing dairy anaerobic digestion project located near the Yakima Valley of Washington State.
What Are Some of the Benefits of Anaerobic Digestion?
One of the major advantages of anaerobic digestion (AD) is the environmental benefits that accompany the technology. AD systems mitigate greenhouse gas (GHG) emissions, can contribute to reducing nutrient export from dairies to surface and ground water, can reduce the risk of pathogen spread, and can improve air quality. In the field of economics, many of these types of environmental benefits and harms fall into the realm of market externalities. Externalities are outputs of a production process that are “external” to the producers’ decision-making process, such as methane emitted from a manure lagoon. A common way governments have attempted to reduce harmful environmental externalities is through emissions regulations. An alternative way to mitigate negative externalities that we have seen in recent years has been the formation of markets for environmental attributes. This induces producers to internalize the environmental costs and benefits of production. Existing environmental markets contribute revenue gains to AD adopters, and with further development have the potential to result in even larger revenue gains for AD projects.
What did we do?
We explored available and potential environmental credits that could be available to AD projects and classified them by environmental attribute. These include carbon credits, renewable energy / fuel credits, tax and utility credits, and nutrient credits. We present examples of types of these environmental credits and their impacts on AD project profitability under various scenarios. We further discuss questions of eligibility and considerations for project developers and managers in the context of positioning for future environmental credit opportunities.
Table 1: Available sources of environmental revenues for anaerobic digester owners based on combined heat and power (CHP) or compressed natural gas (CNG) generation.
AD Methane Use
Environmental Credit
Market Price
Yearly Revenue $/Head
Market Price
Yearly Revenue $/Head
Market Price
Yearly Revenue $/Head
Low Scenario
Medium Scenario
High Scenario
Combined Heat & Power
Carbon Credit
$10/tCO2e
$42.13
$15/tCO2e
$63.19
$20/tCO2e
$84.25
REC
$2.00/MWh
$3.08
$4/MWh
$6.16
$8/MWh
$12.32
Compressed Natural Gas
Carbon Credit
$10/tCO2e
$42.13
$15/tCO2e
$63.19
$20/tCO2e
$84.25
RIN
$0.005/Mbtu
$158.34
$0.01/Mbtu
$316.68
$0.02/Mbtu
$633.36
LCFS
$12/tCO2e
$380.02
$24/tCO2e
$760.04
$48/tCO2e
$1,520.07
What have we learned?
Environmental crediting options are highly variable both in terms of the types and mechanisms for the credit and their availability across space (jurisdiction) and time. History indicates there is likely to be continued variability and limited predictability for environmental crediting. Economic analyses show that AD projects can be profitable under many different scenarios, but is most sustainable when it allows for multiple revenues from electricity or renewable fuel, fiber products, nutrients, and carbon credits for avoided methane emissions. Environmental incentives like carbon credits and RFS credits (i.e., RIN) have a significant contribution to the profitability of an AD project, particularly when the project produces renewable natural gas.
Products
AD-Combined heat and power (CHP)
AD-Boiler
AD-Renewable natural gas
Table 2: Net present values of alternative anaerobic digester (AD) systems given different revenue streams.
Energy1
-$2.1 million
NA
-$4.8 million
Energy, and fiber and nutrients
$4.8 million
$1.3 million
$1.5 million
Energy, fiber and nutrients and environmental incentives2
$8.0 million
$3.6 million
$4.1 million
Note: NA – means not applicable for AD-Boiler Project because it does not produce electricity. 1Energy refers to electricity produced by the AD-CHP and AD-Boiler Projects, and electricity and renewable natural gas produced by the AD-RNG Project. 2Environmental incentives include the: Washington Energy Initiative, Renewable Energy Certificates, and carbon credits.
Future Plans
We will be publishing a Fact Sheet through WSU Extension providing more detailed discussion of environmental credits for AD projects. This fact sheet is part of an Anaerobic Digestion Systems Manual under development with support from USDA NIFA.
Greg Astill, Graduate Student WSU Econ; Suzette Galinato, Research Associate, WSU IMPACT Center; Craig Frear, Assistant Professor, WSU Biological Systems Engineering; Georgine Yorgey, Associate in Research, WSU CSANR; Jim Jensen
Additional information
Coppedge, B., G. Coppedge, D. Evans, J. Jensen, E. Kanoa, K. Scanlan, B. Scanlan, P. Weisberg and C. Frear. 2012. Renewable Natural Gas and Nutrient Recovery Feasibility for DeRuyter Dairy: An Anaerobic Digester Case Study for Alternative Off-take Markets and Remediation of Nutrient Loading Concerns within the Region. A Report to Washington State Department of Commerce. <http://csanr.wsu.edu/publications/deRuyterFeasibilityStudy.pdf>.
Galinatto, S.P., C.E. Kruger, and C.S. Frear (2015). Anaerobic Digester Project and System Modifications: An Economic Analysis. WSU Extension Publications EM090
Acknowledgements
The preparation of this fact sheet was funded by the WSU ARC Biomass Research Program, and USDA National Institute of Food and Agriculture Award #2012-6800219814.
The authors are solely responsible for the content of these proceedings. The technical information does not necessarily reflect the official position of the sponsoring agencies or institutions represented by planning committee members, and inclusion and distribution herein does not constitute an endorsement of views expressed by the same. Printed materials included herein are not refereed publications. Citations should appear as follows. EXAMPLE: Authors. 2015. Title of presentation. Waste to Worth: Spreading Science and Solutions. Seattle, WA. March 31-April 3, 2015. URL of this page. Accessed on: today’s date.
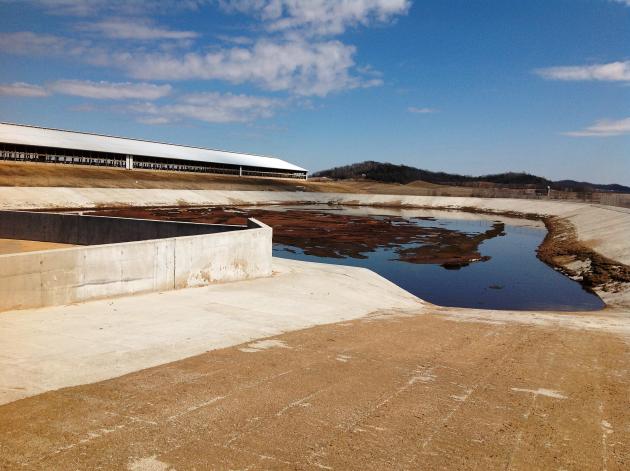
Does Siting Matter Relative to Cattle Feeding and Water Quality?
The site selection and management of cattle feeding facilities has a substantial impact on water quality in Kansas. Site location within the prevailing topography and management of cattle feeding pens is imperative to maintaining quality in the waters of the state. There are several factors which should receive consideration when selecting a site that cattle feeding pens will be constructed, as well as factors that demand attention when managing an existing facility.
What did we do?
Cattlemen planning to build a new cattle feeding facility, or perhaps expand an existing facility consider several aspects in relation to water quality. The number of the cattle that will be in the facility, and the size of those cattle are the first considerations. Feeding facilities that feed 300 animal units or more are required to register with KS Department of Health and Environment.. The amount of time cattle are in the pen is a major consideration. Many facilities will have cattle in the pens year-round, but some will only feed cattle for six months or less.
Other considerations when determining a cattle feeding facility include the slope of pen area, which is preferably 1 to 3 percent. The slope of the pen to soils designated as “flooded” is best if relatively flat, no more than 2 percent preferred. The greater the distance to the “flooded” soil, the better. The amount of rainfall and the rainfall intensity for the specific area of the state is noted, and all extraneous drainage should be diverted upslope of the pen area.
A buffer down-slope of the pen area is essential to managing water quality. The buffer area should be on permeable soils and covered with dense grass. The buffer size should be more than equal to the footprint of the pen, and it is preferred that it be twice the area of the pen. Size of the buffer is influenced by the soils, The more permeable the soil, the greater the infiltration rate, reducing the need for increased size of the buffer area.
Groundwater is carefully protected in Kansas, and livestock feeding facilities must be located in areas that are not deemed “ground water sensitive.” Depth to groundwater of all facilities is recorded as well as distance to any existing wells.
Management
The management of the feeding pen system is imperative to maintaining quality water. Pens need to be cleaned regularly to reduce solids leaving the pen and to ensure buffer vegetation is vigorous and free of weeds. The buffer should be hayed to remove nutrients from the system. The pens should be designed and maintained so that runoff leaving pens should flow evenly into and across the buffer to avoid channeling.
The management of livestock waste in cattle feeding facilities deserves the same attention to detail as ration formulation and health protocols.
What have we learned?
The Kansas Center for Agricultural Resources and the Environment, a department of Kansas State Research and Extension, employees a team of five Watershed Specialists who assist cattle producers who routinely keep cattle confined. These specialists work closely with the producer, K-State and the Kansas Department of Health and Environment to make sure cattle facilities are designed in a water quality responsible manner. In addition, these specialists provide educational outreach, design and promote “off stream” water development, encourage restricting cattle from ponds, and advise on proper grazing management of forage resources.
In the past 4 years, these specialists have consulted with 805 livestock producers, affecting over 34,000 animal units. From their efforts, Kansas waterways have seen a reduction in each year of 211,000 pounds of nitrogen, 88,000 pounds of phosphorus and 346 tons of sediment.
Future Plans
Continue educating cattle producers about the importance of properly sited and managed livestock feeding facilities, and helping them achieve water quality responsible goals.
EPA 319 funds are a major contributor to this program
The authors are solely responsible for the content of these proceedings. The technical information does not necessarily reflect the official position of the sponsoring agencies or institutions represented by planning committee members, and inclusion and distribution herein does not constitute an endorsement of views expressed by the same. Printed materials included herein are not refereed publications. Citations should appear as follows. EXAMPLE: Authors. 2015. Title of presentation. Waste to Worth: Spreading Science and Solutions. Seattle, WA. March 31-April 3, 2015. URL of this page. Accessed on: today’s date.
Why Look at Manure Applicator Educational Programs?
Based on 2013 statistics, Wisconsin has a dairy herd of 1.2 million cows that produce 12,000,000,000 gallons of manure and waste water. Custom manure haulers in Wisconsin handle an estimated fifty percent of the dairy manure and forty per cent of all livestock manure generated in Wisconsin. Because custom manure applicators are a critical component of nutrient management plan (NMP) implementation, University of Wisconsin Extension initiated manure hauler education across the state in the early 1990’s. In 2000, the applicators sought UW – Extension advisory support in forming the Professional Nutrient Applicators Association of Wisconsin (PNAAW). This began a long term relationship between UW – Extension and the professional applicators in Wisconsin and across the upper Midwest.
Following a needs assessment of the industry, the board of directors of PNAAW expressed an interest in a voluntary training and certification program. The overall goal of the training was to educate the custom manure haulers and their employees in safe handling and application practices, spill response, regulations and nutrient management. Road safety, neighbor relations, and confined space safety education modules were added later.
What did we do?
In March of 2002, the board of directors of the PNAAW and a group of Michigan manure applicators independently approached Extension in each state to initiate a voluntary certification and training program. Over the next 5 months, applicators and Extension staff examined the 5 existing manure applicator certification programs and created the program currently in use in Wisconsin, Illinois and Michigan.
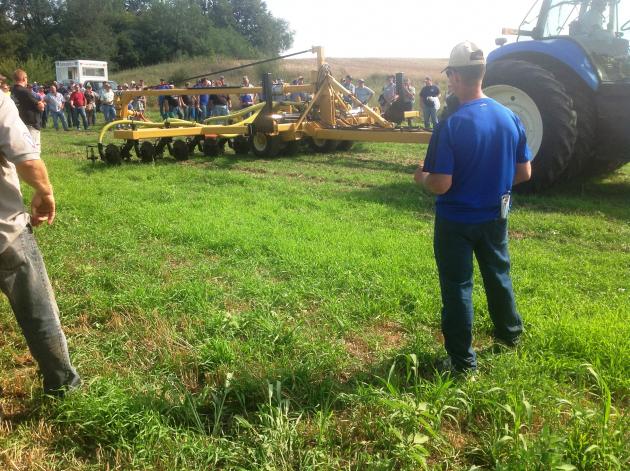
Manure expo 2012, checking out a new dragline applicator.
The UW – Extension Nutrient Management Team’s Custom Manure Hauler Workgroup joined with Extension faculty in Illinois and Michigan to develop a three-state certification program with three levels of training/certification. The certification includes a partnership with the insurance industry to provide a market-based incentive to participate. Business and employee management issues are addressed during an annual multi-state regional symposium coordinated by UW-Extension.
Certification: The program is segmented into three certification levels. Firms must meet level 1 requirement to gain level 2, and meet level 2 requirements to achieve level 3.
Level 1: Requires each employee to be trained and tested on spill response techniques, state specific regulations (including CAFO regulations) and common sense application techniques. Firms that document compliance are eligible for a 10% vehicle liability premium reduction. Training is ~3 hours in length and is completed annually.
Level 2: Requires crew supervisors and business owners to attend 6 hours of continuing education over a 2 year period. Classes are offered at field days and the annual conference. Once a firm has achieved Level 2, they may conduct Level 1 training in-house.
Level 3: Develop and implement an EMS (Environmental Management System). The EMS requires the firm to document their process and ensure all employees know their job responsibilities. Insurance auditors will evaluate each firm’s EMS annually to insure compliance. Premium reductions include 10-40% on vehicle liability and 50% on environmental liability.
Not your typical Wisconsin “boat” show. PNAAW 2014 manure boat agitation demonstration, organized with UW-Extension.
All certification levels also require that the firm complete the PNAAW Performance Standards Checklist at least once per year.
Membership in the state’s applicator association is required for certification, as certification is granted by the association and not by Extension. Each state association may also require additional performance standards, such as documentation of equipment calibration, to grant certification.
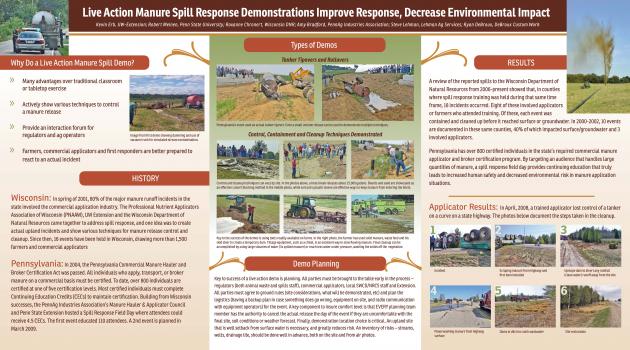
One area of continuing education began in 2002, when UW – Extension with permission from Wisconsin Department of Natural Resources (WDNR), conducted manure spill response training using actual manure. The basic educational focus was containing, controlling, cleaning up, and then meeting reporting requirements of a spill. Since 2002, 20 live action demonstrations have occurred. Training has expanded to include calibrating of manure equipment and determining manure application rate per acre.
What have we learned?
PNAAW requested that Extension assist in filling an educational need not met by current farm shows – being able to compare different manure agitation and application equipment side by side in the field (using actual manure) to help determine which best meets individual needs. The result was the first Manure Expo in August 2001, which drew 432 people from 5 states and Canada.
The Manure Expo has grown to an annual 2-day educational and demonstration event. 2015 is the 13th Expo; the event has been hosted by Extension and custom applicators in Wisconsin, Michigan, Minnesota, Ohio, Iowa, Missouri, Nebraska, and Pennsylvania in the US and Guelph, Ontario, Canada. An average Expo will draw over 1,000 people from industry, university, farm, and application professionals.
PNAAW 2014
The pit before the boat demonstration begins 2014.
The voluntary certification program has saved Wisconsin and Michigan over $100,000 annually because regulatory mandates require state finances for staff and office to run mandated programs. In addition to the sharing of curriculum in multiple Midwestern universities the training and educational sessions are a success in the formation/enhancement of three state associations in Michigan (now inactive), Pennsylvania, and Indiana/Ohio.
Applicator and industry partnerships contributed to a multi – state agriculture weight study based at the Minnesota DOT/University of Minnesota, MN Road Research Center. Over $640,000 was pooled from applicators and Applicator Associations (WI, MI, MN, IA, and OH), industry and agencies to fund research on the impact of larger manure hauling and agriculture equipment on pavement.
Custom manure applicators are a key component in the environmental application of manure. The Wisconsin Department of Agriculture, Trade, and Consumer Protection (DATCP) has tracked crop acres managed with a NMP. In 2004, 0.7 million crop acres were managed using a NMP; in 2014 the NMP managed acres increased to 2.58 million acres in Wisconsin.
Future Plans
Each year a new need will arise. Education will be provided for employee relations, business planning, family/work balance and the need to review new technology. A few projects that began in 2014: manure boat agitation field day and precision manure application. Education will be developed in the future as a need arises from the manure application industry.
George Koepp, Columbia County UWEX Agriculture Agent, Jerry Clark,Chippewa County UWEX Crops/Soils Educator, Ted Bay, Grant County UWEX Crops/Farm Management Agent, Kevin Erb, UWEX Conservation Professional Devp. & Training Cord., Becky Larsen, UW Biowaste Specialist, Jim Leverich, UW On Farm Research, Kim Meyer, UW Arlington ARS, Cheryl Skjolaas, UW Agriculture Safety Specialist
Additional information
In 2014, over 400 custom manure applicators in Wisconsin were certified in at least one level of the program. Eight PNAAW member application firms revised their level 3 status in 2013 and are saving $44,000 annually on pollution insurance policies, while PNAAW firms achieving level 1 and level 2 certification reduced pollution insurance policies premiums by an additional $78,000 per year.
The collaboration of PNAAW, University of Wisconsin Extension, University of Wisconsin Specialists, WDNR, DATCP and UW – Extension County Agents has provided the foundation of a proactive approach to education and training, leading to problem solving results from a knowledgeable application industry.
Bulletin for manure spill response developed by UW-Extension nutrient management team PNAAW workgroup.
The authors are solely responsible for the content of these proceedings. The technical information does not necessarily reflect the official position of the sponsoring agencies or institutions represented by planning committee members, and inclusion and distribution herein does not constitute an endorsement of views expressed by the same. Printed materials included herein are not refereed publications. Citations should appear as follows. EXAMPLE: Authors. 2015. Title of presentation. Waste to Worth: Spreading Science and Solutions. Seattle, WA. March 31-April 3, 2015. URL of this page. Accessed on: today’s date.
Manage Cookie Consent
To provide the best experiences, we use technologies like cookies to store and/or access device information. Consenting to these technologies will allow us to process data such as browsing behavior or unique IDs on this site. Not consenting or withdrawing consent, may adversely affect certain features and functions.
Functional
Always active
The technical storage or access is strictly necessary for the legitimate purpose of enabling the use of a specific service explicitly requested by the subscriber or user, or for the sole purpose of carrying out the transmission of a communication over an electronic communications network.
Preferences
The technical storage or access is necessary for the legitimate purpose of storing preferences that are not requested by the subscriber or user.
Statistics
The technical storage or access that is used exclusively for statistical purposes.The technical storage or access that is used exclusively for anonymous statistical purposes. Without a subpoena, voluntary compliance on the part of your Internet Service Provider, or additional records from a third party, information stored or retrieved for this purpose alone cannot usually be used to identify you.
Marketing
The technical storage or access is required to create user profiles to send advertising, or to track the user on a website or across several websites for similar marketing purposes.


 What did we do?
 gpm flow rate. Several hypothetical designs were made based on the available P sorbing materials (PSMs), such as drinking water treatment residuals, acid mine residuals, and gypsum. We chose to use a treated steel slag material as the PSM in the structure; this required about 35 tons of material.
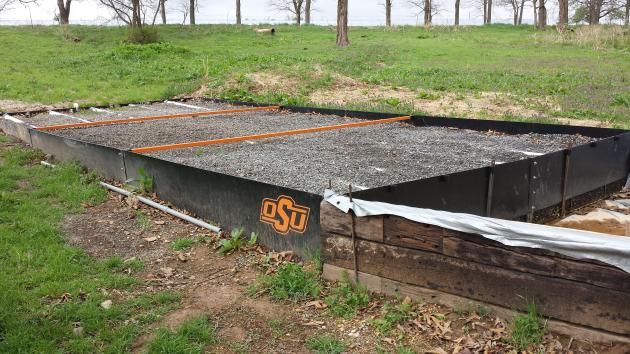 We constructed a P removal structure on a poultry farm in Eastern OK; this is a BMP that can remove dissolved P loading in the short term until soil legacy P concentrations decrease below levels of environmental concern. A P removal structure contains P sorbing materials (PSMs) and are placed in a location to intercept runoff or subsurface drainage with high dissolved P concentrations. As high P water flows through the PSMs, dissolved P is sorbed onto the materials by several potential mechanisms, allowing low P water to exit the structure. While they vary in form, P removal structures contain three main elements: 1) use of a filter material that has a high affinity for P, 2) containment of the material, and 3) the ability to remove that material and replace it after it becomes saturated with P and is no longer effective.
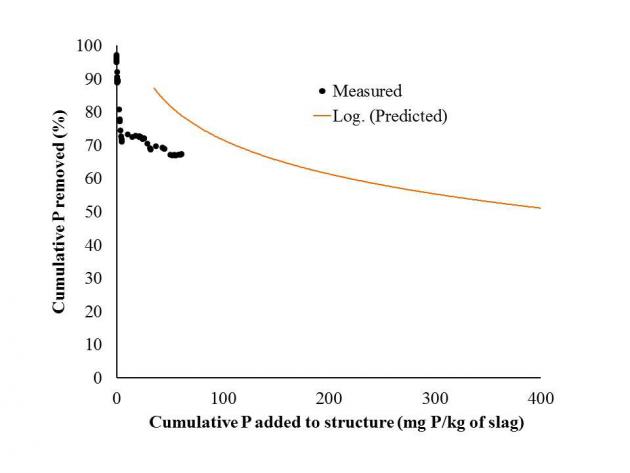 The P removal structure has removed approximately 67% of all dissolved P that has flowed into it over a 16-month time period. In addition, it has handled all flow volume from every event, including a runoff event that resulted in 600 gpm. That single event delivered 2/3 lb of dissolved P, in which the structure removed 66%. While the structure is removing P as predicted based on P loading, the structure has greatly outlasted the goal of removing 45% of cumulative dissolved P in one year. This is due to the below average rainfall received over the last two years.
 We will continue to monitor the structure. In addition, we are cooperating with several people throughout the US in helping to design P removal structures. We are also releasing design software for licensing in an attempt to promote commercialization of this BMP through private industry. A NRCS standard is currently underway and the goal is for this BMP to become cost-shared. Last, we are continuing to investigate the economics of P removal structure over a large scale area.
 A buffer down-slope of the pen area is essential to managing water quality. The buffer area should be on permeable soils and covered with dense grass. The buffer size should be more than equal to the footprint of the pen, and it is preferred that it be twice the area of the pen. Size of the buffer is influenced by the soils, The more permeable the soil, the greater the infiltration rate, reducing the need for increased size of the buffer area.