Anaerobic digestion (AD) is a growing technology that uses a series of microbial activities to breakdown organic material such as food waste and manure, to produce biogas for renewable energy, digestate for nutrient recycling as fertilizer, and large reductions in greenhouse gas (GHG) emissions and odors. Currently there are millions of AD systems in China and India, with a vast majority of these systems operating on a small-scale basis, while European nations such as Germany and Italy, have thousands of agricultural- based AD systems, that are large scale and more technologically advanced. Europe with over 17,000 biogas plants has steady increases in AD adoption each year, as more countries are setting sustainability goals that include increasing renewable energy use and reducing GHG emissions. The US however, has less than 300 agricultural-based AD systems and 1500 AD systems at wastewater treatment facilities. An in depth analysis was performed of US policies related to AD adoption and how these policies compare to policies in other countries with higher AD adoption rates. A survey was developed for farmers, policy makers, and extension associates to understand policy effects on AD adoption rates and identify challenges to increasing AD adoption rates in the US. The survey data, along with the AD policy analysis, was used to compare and contrast policies, programs and overall legislative climate between countries and understand the timeline in which policies were administered. While policy is the product of a multitude of variables, including general perceptions, institutional involvement, legal framework, and societal /economic benefits, the survey and subsequent analyses seek to understand how these variables interact. The results of the survey and policy analysis will be presented to detail the general perceptions around AD policies, challenges with AD adoption, operation, and maintenance, and overall perceptions of the AD field in the US.
Authors
Carlton Poindexter, University of Maryland-College Park, cpoindex@umd.edu
Lansing, Stephanie (University of Maryland-College Park)
The authors are solely responsible for the content of these proceedings. The technical information does not necessarily reflect the official position of the sponsoring agencies or institutions represented by planning committee members, and inclusion and distribution herein does not constitute an endorsement of views expressed by the same. Printed materials included herein are not refereed publications. Citations should appear as follows. EXAMPLE: Authors. 2019. Title of presentation. Waste to Worth. Minneapolis, MN. April 22-26, 2019. URL of this page. Accessed on: today’s date.
To better understand the state of the science and to lessen the present risk of winter manure application, a literature review was conducted that examined a wealth of studies dating back to 1945. Interest in winter manure application has increased, in part, due to the high-profile nutrient impacts to the Great Lakes and the several resulting new policies that have been implemented within the surrounding states. Based on this literature review, research needs and future directions were identified.
What did we do?
A comprehensive literature review was conducted that included scientific, technology transfer, and regulatory documents. Contaminants of concern, emerging pollutants, case studies, existing best management practices, state level policy, and key data gaps were identified.
What we have learned?
The US Environmental Protection Agency (EPA) and the Natural Resource Conservation Service (NRCS) discourages the application of manure in winter because of the elevated risk of nutrient loss to the environment as demonstrated by several field, laboratory, and modeling studies (Srinivasan et al., 2006). The emergence of environmental issues downstream of livestock operations such as algae blooms and fish kills has led some States to ban winter manure application all together, although some states still allow emergency applications and exempt smaller farms from the regulations. Additionally, the loss of nutrients during spring thaws means a loss of soil productivity for farmers and added expense to purchase soil amendments. There are several parameters that ultimately determine the impact winter manure spreading will have on the environment and the nutrient content that remains in the soil after application. Included, but not limited to, are slope, soil type, depth of freeze, rate of thaw, depth of snow, presence of cover crops, tilling practices, manure moisture content, and timing of application. Several are interdependent, often resulting in difficulty isolating the relative effects of any particular parameter compared to another and, in some cases, contradictory research results are found. However, several general findings may still be derived, as discussed below.
Nutrients
Runoff from winter-applied manure can be an important source of annual nutrient loadings to water bodies, with nitrogen and phosphorous being the most often reported. In a 1985 study, Moore and Madison (1985) estimated that 25% of annual phosphorus load to a Wisconsin lake was directly attributable to winter spreading of animal wastes. Brown et al. (1989) investigated the Cannonsville Reservoir in New York and determined that snowmelt runoff from winter manured cropland contributed more phosphorus to the reservoir than runoff from barnyards. Clausen and Meals (1989) estimated that 40% of Vermont’s streams and lakes experienced significant water quality impairments from the addition of just two winter-spread fields in their watersheds. Plot studies of winter-applied manure found 23.5 to 1,086 mg/L of total Kjeldahl nitrogen (TKN) and 1.6 to 15.4 mg/L of phosphorus in runoff (Lorimor and Melvin, 1996; Thompson et al., 1979). In two Vermont field studies, Clausen (1990; 1991) reported 165 to 224% increases in total phosphorus concentration, 246 to 1,480% increases in soluble phosphorus, 114% increases in TKN, and up to a 576% increase in NH3-N following winter application of dairy manure. Mass losses of nutrients are highly variable across studies. Several studies have noted elevated, though moderate, mass losses of nitrogen ranging from 10-22% of applied nitrogen (Converse et al., 1976; Hensler et al., 1970; Klausner et al., 1976; Lorimor and Melvin, 1996; Midgley and Dunklee, 1945; Phillips et al., 1981). However, Owens et al. (2011) reported total nitrogen losses of 35-94%, by mass. These numbers are highly variable due the extreme variance in weather conditions, with flash events contributing more nutrient loss than slower melt events. Authors noted that it is possible for nearly all loss to occur in a single storm event (Klausner et al., 1976; Owens et al., 2011).
Steenhuis et al., (1979) reported decreases in ammonia volatilization rates for winter spread manure relative to spring due to lower temperatures. Lauer et al. (1976) showed that manure covered by snow had no signs of ammonia volatilization. These results suggested that limiting ammonia volatilization may be critical to nutrient retention in soil. However, Williams et al. (2010) showed that manure applied under snow did not truly maintain this ammonia but lost it through runoff. No case studies have quantified the reduction of other odor causing compounds such as di-hydrogen sulfide in winter applied manure relative to other seasonal applications.
Losses are contingent upon fields exhibiting certain risk factors (Klausner et al., 1976; Young and Holt, 1977; Young and Mutchler, 1976). Important are variations in local weather conditions, depth and type of soil freeze, the position of manure relative to the snowpack, and the timing of application relative to snow melt. Because of the large number of unconstrained variables in the natural environment, there continue to be disagreements on best management practices to limit nutrient movement. Additionally, the form of nutrient is critical. All of these factors impact the mechanisms of nutrient loss: plant uptake, sorption, polymerization, microbial degradation, volatilization, advective movement, and dispersive transport. Consequently, the fate of particulate forms may be very different than soluble, depending on the site and management-specific conditions.
As such, the industry will benefit from continued experiment and field research in an effort to account for very specific, definable variables and nutrient form. Further, because of the extensive list of relevant variables, the development of precise and accurate mathematical models is essential as experimentally modeling the infinite number of site and management-specific conditions is impossible.
Pathogens
Several varieties of pathogens are common in livestock excrement, though not all pose human health risks. Pathogens of concern include the following (USEPA 2004; Rogers and Haines 2005; Sobsey et al. 2006; Pappas et al. 2008; Bowman 2009).
Bacteria: Escherichia coli (E. coli) O157:H7 and other shiga-toxin producing strains, Salmonella spp., Campylobacter jejuni, Yersinia enterocolitica, Shigella sp., Listeria monocytogenes, Leptospira spp., Aeromonas hydrophila, Clostridium perfringens, Bacillus anthraxis (in endemic area) in mortality carcasses.
Parasites: Giardia lamblia, Cryptosporidium parvum, Balantidium coli, Toxoplasma gondii, Ascaris suum and lumbricoides, Trichuris trichuria.
Viruses: Rotavirus, hepatitis E virus, influenza A (avian influenza virus), enteroviruses, adenoviruses, caliciviruses (e.g., norovirus).
As with nutrients, application of animal manure to impervious surfaces such as frozen ground can increase the risk of pathogen loss through runoff events relative to application in other seasons (Reddy, et al., 1981). Cool temperatures have been shown to improve the survival of fecal bacteria (Reddy et al., 1981; Kibbey, et al., 1978). However, field studies found that freezing conditions can be lethal to fecal bacteria (Kibbey, et al., 1978). While these reports hint at fecal bacteria being able to survive cool but not freezing conditions, Kudva, et al. (1998) reported E. coli surviving more than 100 days in manure frozen at minus 20°C. Conversely, freezing and thawing of a soil manure mixture was found to reduce E. coli levels by about 90% (Bicudo, 2003).
More research on this topic is needed to identify conflicting results. Of particular interest is the impact of warming soil temperatures. Slight variations can result in substantial microbial ecological changes. Further, it is well understood that the use of fecal coliform as a pathogen indicator is flawed. New microbial genetics techniques enable the identification of pathogens of greatest risk. Research should monitor for these specific, likely pathogens and their fate during freeze-thaw cycles.
Emerging Pollutants
Land application of both solid and slurry excrement has been cited as a vector for introduction of antimicrobials into the environment (Boxall 2008; Klein et al. 2008). In the early 2000s, it was estimated that approximately 60% to 80% of livestock and poultry routinely received antimicrobials through feed or water, injections, or external application (NRC 1999; Carmosini and Lee 2008). Though new best management practices involving non-therapeutic use of antibiotics in livestock are likely to decrease these percentages, estimated changes are not available. Livestock animals are estimated to discharge 70-90% of antibiotics administered through excrement (Massé et al., 2014). Approximately 55% of antimicrobial compounds administered to livestock and poultry are also used to treat human infections (Benbrook 2001; Kumar et al. 2005; Lee et al. 2007). The utilization of such overlapping antibiotics has been cited as a potential cause of antimicrobial resistance (Sapkota et al. 2007), a grave concern in modern medicine (Levy and Marshall 2004; Sapkota et al. 2007).
Antimicrobials are hydrophilic and do not readily break down in the environment and are, consequently, at high risk of introduction into water bodies through runoff events (Chee-Sanford et al. 2009; Zounková et al. 2011). Critically, these compounds show high adsorptive tendencies in soils and clays (Chee-Sanford et al. 2009), thus providing a potential for interception by soil.
Because antibiotics are highly hydrophilic, movement with melt water results, similar to soluble nutrients. Although this mechanism seems clear, movement during winter application is poorly understood. The mechanisms that determine their fate are the same as those listed for nutrients. However, this fate is poorly understood, especially regarding the amount that will reach the field and streams when comparing different seasonal applications. Further, some studies suggest prolonged storage in aerobic manure environments helps facilitate breakdown particularly at higher temperatures (Kumar et al. 2005; Lee et al. 2007; Boxall et al. 2008). However, the question remains whether these effects are present in winter storage.
Fate studies under diverse farm field conditions are essential. Further, the original compound may be broken down into metabolites, some of which may be even more dangerous. All original and breakdown products should be reviewed.
Benefits of Winter Manure Application
The soil health benefits of winter manure application appear to be limited. However, the literature suggests that soil compaction and nitrogen volatilization can be reduced when applying to frozen soil, but at the potential expense of nutrient runoff. There are also many benefits to agriculturalists, as Fleming and Fraser (2000) noted:
Reducing size and number of manure storage structures.
Spreading the manure when logistics suite the farmer.
Reducing soil compaction by avoiding equipment use during compressible soil conditions.
Management Practices
There is little standardization in regard to winter manure application and most states cite the NRCS conservation practice standard 590 for nutrient management (NRCS, 2013). In regard to winter manure application, this standard states the following. “Nutrients must not be surface-applied if nutrient losses offsite are likely. This precludes spreading on: frozen and/or snow-covered soils, and when the top two inches of soil are saturated from rainfall or snow melt. Exceptions for the above criteria can be made for surface-applied manure when specified conditions are met and adequate conservation measures are installed to prevent the offsite delivery of nutrients” (NRCS, 2013). As a continuation of standard 590, the NRCS states that at a minimum the following factors should be considered before winter manure application (NRCS, 2013):
Field slope
Organic residue and living covers
Amount and form of nutrients to be applied
Setback distances to protect local water quality
Application timing
The ambiguity in standard practices for winter manure application has led to several different State policies. States with winter manure application guidelines include Ohio, Pennsylvania, Michigan, and Illinois. States that have some form of bans include Vermont, Iowa, Maryland, Indiana, Minnesota, and Wisconsin. States not listed have policies that are identical to the NRCS standard 590.
Future Plans
Based on this literature review, needed research has been identified:
Review the incidences of emergency spreading on frozen ground versus incorporation during cold weather. Understanding the frequency and timing of emergency spread events is critical to crafting policy and best management practices.
Evaluate compliance with new rules and if intended impacts are realized, including comparing watershed level of target pollutants across state lines and time lines to view the impacts of this policy change.
Determine if application in early spring, when soil is saturated and precipitation events are frequent, is more desirable than in winter application before a deep freeze allows for incorporation. Related is the impact of soil moisture content on the fate of target pollutants during thaw events.
Determine the economic impact on producers and the potential loss of small to medium sized farms. One of the most often cited criticisms of unconditional winter manure application bans is that it can disproportionately disadvantage smaller producers. In a Michigan survey of small producers, 27% of non-CAFO dairy farmers suggested that they would need to suspend operations if such a ban were instituted (Miller et al., 2017). This same survey found that a total ban on winter application in Michigan would collectively cost small farms in that state an estimated $30 million dollars (Miller et al., 2017). An important task is to survey, with time, states that have banned winter manure application to determine if significant shift with regard to average producer size occurred. If so, it is important to consider the resulting economics of the environmental benefits and if national biosecurity decreased with a reduction in producers.
Verify the effectiveness of risk indices such as the Manure Application Risk Index (MARI), Wisconsin’s Online Manure Advisory System, and other individual states’ P-indices. Many of these indices were developed based on recommendations from research and the practical experience of experts, but literature verifying this is scarce.
Determine the impact of climate change on winter manure application policies. Climate change effects the duration and intensity of winter temperatures and the frequency and intensity of precipitation events. Such conditions may require more adaptable metrics such as frost depth, depth of snow, ability to incorporate, and forecasted thaw events.
Authors
Steven I. Safferman1, Jason S. Smith2, and Rachelle L. Crow3
1Associate Professor; Michigan State University, Biosystems and Agricultural Engineering; Corresponding Author: SteveS@msu.edu
2Teaching Specialist, Michigan State University, Engineering CoRe
3Undergraduate Research Assistant, Michigan State University, Biosystems and Agricultural Engineering
Additional information
Benbrook, C.M. 2001. Quantity of antimicrobials used in food animals in the United States. American Society for Microbiology 101st Annual Meeting. May 20-24, 2001. Orlando, FL.
Bicudo, J. R., Goyal, S.M. 2003. Pathogens and manure management systems: a review. Environmental technology 24.1 (2003): 115-130.
Bowman, J. 2009. Manure pathogens: manure management, regulations, and water quality protection. p. 562.Water Environmental Federation, McGraw-Hill, New York.
Boxall, A. 2008. Fate and transport of veterinary medicines in the soil environment. p 123-137. In D.S. Aga (ed.) Fate and transport of pharmaceuticals in the environment and water treatment systems. 1st ed. CRC Press, Boca Raton, FL.
Brown, M.P., Longabucco, P., Rafferty, M.R., Robillard, P.D., Walter, M.F., Haith, D.A. 1989. Effects of animal waste control practices on nonpoint-source phosphorus loading in the West Branch of the Delaware River watershed. J. Soil Water Conserv. 44, 67–70.
Carmosini, N., Lee, L.S. 2008. Sorption and Degradation of selected pharmaceuticals in soil and manure. p 139-165. In D.S. Aga (ed.) Fate and transport of pharmaceuticals in the environment and water treatment systems. 1st ed. CRC Press, Boca Raton, FL.
Chee-Sanford, J.C., Mackie, R.I., Koike, S., Krapac, I.G., Lin, Y., Yannarell, A.C., Maxwell, S., Aminov. R.I. 2009. Fate and transport of antibiotic residues and antibiotic resistance genes following land application of manure waste. Journal of Environmental Quality. 38(3):1086-1108.
Clausen, J.C. 1990. Winter and Fall application of manure to corn land. Pages 179 – 180 invMeals, D.W. 1990. LaPlatte River Watershed Water Quality Monitoring and AnalysisProgram: Comprehensive Final Report. Program Report No. 12. Vermont WatervResource Research Center, University of Vermont, Burlington.
Clausen, J.C. 1991. Best manure management effectiveness. Pages 193 – 197 in Vermont RCWP Coordinating Committee. 1991. St. Albans Bay Rural Clean Water Program, Final Report. Vermont Water Resources Research Center, University of Vermont, Burlington
Clausen, J.C., Meals, D.W. 1989. Water quality achievable with agricultural best management practices. J. Soil Water Conserv. 44, 593–596.
Converse, J.C., Bubenzer, G.D., Paulson, W.H. 1976. Nutrient losses in surface runoff from winter spread manure. Trans. ASAE 19, 517–519.
Fleming, R., Fraser, H. 2000. Impacts of winter spreading of manure on water quality: Literature review. Ridgetown, Ontario, Canada Ridget. Coll. Univ. Guelph.
Hensler, R.F., Olsen, R.J., Witzel, S.A., Attoe, O.J., Paulson, W.H., Johannes, R.F. 1970. Effect of method of manure handling on crop yields, nutrient recovery and runoff losses. Trans. ASAE 13, 726–731.
Kibbey, H.J., Hagedorn, C., and McCoy, E.L. 1978. Use of fecal streptococci as indicators of pollution in soil. Applied Environmental Microbiology. 35:711-717.
Klausner, S.D., Zwerman, P.J., Ellis, D.F. 1976. Nitrogen and phosphorus losses from winter disposal of dairy manure. J. Environ. Qual. 5, 47–49.
Klein C., O’Connor, S., Locke, J., Aga, D. 2008. Sample preparation and analysis of solid-bound pharmaceuticals. p. 81-100. In D.S. Aga (ed.) Fate and transport of pharmaceuticals in the environment and water treatment systems. 1st ed. CRC Press, Boca Raton, FL.
Kudva, I. T., Blanch, K., Hovde, C. J. 1998. Analysis of Escherichia coli O157: H7 survival in bovine or bovine manure and manure slurry. Applied and environmental microbiology, 64(9), 3166-3174.
Kumar, K., Gupta, S.C., Chander, Y., Singh, A.K. 2005. Antibiotic use in agriculture and its impact on the terrestrial environment. Advances in Agronomy. 87:1-54.
Lauer, D.A., Bouldin, D.R., Klausner, S.D. 1976. Ammonia volatilization from dairy manure spread on the soil surface. J. Environ. Qual. 5, 134–141.
Lee, L.S., Carmosini, N., Sassman, S.S., Dion, H.M., Sepúlveda, M.S. 2007. Agricultural contributions of antimicrobials and hormones on soil and water quality. Advances in Argronomy.93:1-68.
Levy, S.B., Marshall, B. 2004. Antibacterial resistance worldwide: causes, challenges and responses. Nature Medicine Supplement. 10(12):S122-S129.
Lorimor, J.C., Melvin, J.C. 1996. Nitrogen losses in surface runoff from winter applied manure. Final Report. Univ. Iowa, Ames, Iowa.
Massé, I.D., Saady, M.N., Gilbert, Y. 2014. Potential of Biological Processes to Eliminate Antibiotics in Livestock Manure: An Overview. Anim. . doi:10.3390/ani4020146
Midgley, A.R., Dunklee, D.E. 1945. Fertility runoff losses from manure spread during the winter. Agricultural Experiment Station; Burlington.
Miller, S.R., Mann, J.T., Leschewski, A., Rozeboom, D., Safferman, S., Smith, J. 2017. Survey of Small Michigan Livestock Winter Manure Handling and Economic Assessment of Policy Change, in: 2017 ASABE Annual International Meeting. American Society of Agricultural and Biological Engineers, p. 1.
Moore, I.C., Madison, F.W. 1985. Description and application of an animal waste phosphorus loading model. J. Environ. Qual. 14, 364–369.
NRC. 1999. The use of drugs in food animals: benefits and risks. Food and Nutrition Board, Institute of Medicine. National Academy Press, Washington, DC.
NRCS. 2013. Conservation Practice Standard 590: Nutrient Management [WWW Document]. URL https://www.nrcs.usda.gov/Internet/FSE_DOCUMENTS/stelprdb1192371.pdf (accessed 1.8.17).
Owens, L.B., Bonta, J. V, Shipitalo, M.J., Rogers, S. 2011. Effects of winter manure application in Ohio on the quality of surface runoff. J. Environ. Qual. 40, 153–165.
Pappas, E. A., Kanwar, R. S., Baker, J. L., Lorimor, J. C., Mickelson, S. 2008. Fecal indicator bacteria in subsurface drain water following swine manure application. Transactions of the ASABE, 51(5), 1567-1573.
Phillips, P.A., Culley, J.L.B., Hore, F.R., Patni, N.K. 1981. Pollution potential and corn yields from selected rates and timing of liquid manure applications. Trans. ASAE 24, 139–144.
Reddy, K. R., Khaleel, R., Overcash, M. R. 1981. Behavior and transport of microbial pathogens and indicator organisms in soils treated with organic wastes. Journal of Environmental Quality, 10(3), 255-266.
Rogers, S., and J. Haines. 2005. Detecting and mitigating the environmental impact of fecal pathogens originating from confined animal feeding operations: review. EPA-600-R-06-021. USEPA, Office of Research and Development, National Risk Management Research Laboratory. Cincinnati, OH.
Sapkota, A.R., F.C. Curriero, K.E. Gibson, and K.J. Schwab. 2007. Antibiotic-resistant enterococci and fecal indicators in surface water and groundwater impacted by a concentrated swine feeding operation. Environmental Health Perspectives. 115(7):1040-1045.
Sobsey, M.D., Khatib, L.A., Hill, V.R., Alocilja, E., Pillai, S. 2006. Pathogens in animal wastes and the impacts of waste management practices on their survival, transport and fate. p. 609-666. In J.
Srinivasan, M.S., Bryant, R.B., Callahan, M.P., Weld, J.L. 2006. Manure management and nutrient loss under winter conditions: A literature review. J. Soil Water Conserv. 61, 200–209.
Steenhuis, T.S., Bubenzer, G.D., Converse, J.C. 1979. Ammonia volatilization of winter spread manure. Trans.of ASAE. p 152-157, 161.
Thompson, D.B., Loudon, T.L., Gerrish, J.B. 1979. Animal manure movement in winter runoff for different surface conditions, in: Best Management Practices for Agriculture and Silviculture Proceedings of the 1978 Cornell Agricultural Waste Management Conference, P 145-157, 1979. 1 Fig, 4 Tab, 16 Ref.
USEPA. 2004. Risk management evaluation for concentrated animal feeding operations. EPA-600-R-04-042.USEPA, Office of Research and Development, National Risk Management Research Laboratory, Cincinnati, OH.
Williams, M.R., Feyereisen, G.W., Beegle, D.B., Shannon, R.D., Folmar, G.J., Bryant, R.B. 2010. Manure application under winter conditions: Nutrient runoff and leaching losses, in: 2010 Pittsburgh, Pennsylvania, June 20-June 23, 2010. American Society of Agricultural and Biological Engineers, p. 1.
Young, R.A., Holt, R.F. 1977. Winter-applied manure: Effects on annual runoff, erosion, and nutrient movement. J. Soil Water Conserv.
Young, R.A., Mutchler, C.K. 1976. Pollution potential of manure spread on frozen ground. J. Environ. Qual. 5, 174–179.
Zounková, R., Klimešová, Z., Nepejchalová, L., Hilscherová, K., Bláha, L. 2011. Complex evaluation of ecotoxicity and genotoxicity of antimicrobials oxytetracycline and flumequine used in aquaculture. Environmental Toxicology and Chemistry, 30(5), 1184-1189.
Acknowledgements
This project was funded by the North Central Regional Water Network Manure and Soil Heath Working Group and the Soil Health Institute.
The authors are solely responsible for the content of these proceedings. The technical information does not necessarily reflect the official position of the sponsoring agencies or institutions represented by planning committee members, and inclusion and distribution herein does not constitute an endorsement of views expressed by the same. Printed materials included herein are not refereed publications. Citations should appear as follows. EXAMPLE: Authors. 2019. Title of presentation. Waste to Worth. Minneapolis, MN. April 22-26, 2019. URL of this page. Accessed on: today’s date.
The Runoff Risk project was started in Wisconsin in 2011, with the realization at that time, there was no real-time runoff risk guidance available for manure applicators. The project has grown, with four states (Michigan, Minnesota, Ohio and Wisconsin) now operating real-time runoff risk forecast websites.
Figure 1. Minnesota Runoff Risk Advisory Forecast from July 1, 2018.
The Minnesota Runoff Risk Advisory Forecast (RRAF) system is a tool developed by the Minnesota Department of Agriculture (MDA) and the National Weather Service (NWS). It is designed to help farmers and commercial applicators determine the best time to apply manure to reduce the runoff risk of valuable nutrients and protect water resources. It is part of a regional risk advisory forecast project that utilizes existing NWS weather and watershed models in a water quality application. Figure 1 shows a screenshot of the website from July 1, 2018, indicating the runoff risk forecast in the central part of the state.
Runoff Risk Analysis
The NWS models continuously simulate soil moisture and temperature conditions as well as incorporating future precipitation and temperature forecasts and current and future snowpack. An algorithm that looks at chosen model state values is evaluated for a variety of risk conditions, such as runoff and soil saturation. Based on over 20 years of simulations, basin specific thresholds were created. Finally, there was post–processing of that data that is run on the output to produce risk events. This information is provided daily to the project partners through data servers. The data is processed and the website is updated twice daily. The graphic displays the different risk events predicting the likelihood of today (Day 1), tomorrow (Day 2), and Day 3 or multi-day (Day 1 through Day 3 combined) runoff events. Farmers and commercial applicators use an interactive map to locate their field and find their forecasted risk. Users can also sign up for email or text messages for their county that alert them to a severe runoff risk for that day.
Figure 2. Tabular 5 day forecast from June 24, 2019 in Bandon Township, Renville County, Minnesota.
Runoff risk is grouped into four categories: No event, Low, Moderate and Severe. When the risk is Moderate or Severe, it is recommended that the applicator evaluate the situation to determine if there are other locations or later dates when the application could take place. Figure 2 shows results for a specific location in Bandon Township in Renville County, Minnesota. For the first three days, the risk of runoff at that specific location was Severe, which indicated that a producer should wait to apply.
Daily Mapping Information
Figure 3. Daily soil temperature forecast at 6 inch depth for Minnesota.
The RRAF website also provides statewide forecasted daily average two inch soil depth temperatures which can be useful at planting time, daily average six inch soil depth temperatures which are helpful when determining fall fertilizer application in appropriate areas and daily precipitation forecasts. Figure 3 shows the daily soil temperature forecast at the six inch depth for the state of Minnesota. The colored dots are real time soil temperature gauges that can be interactively clicked on to reveal current soil temperature. The color of the dot is not reflective of the temperature at the gauge. It simply notes what entity is in charge of the gauge.
Potential of RRAF
This is a relatively new application that has been implemented in Minnesota since March 2018. The potential impacts of usage on this could be quite large. Any time movement of manure to water resources can be minimized is a success for the farmer and the environment. The overall goal of the presentation is to make people aware of this tool, share information on the performance, and encourage potential users to add this tool to their “toolbox”. The main message is to check conditions, delay if necessary, and spread on the day when there is least potential impact to the environment.
Further partnerships are desired to continue to get the word out on this application. Yearly multi-state coordination meetings occur, with the next meeting coming up in Ohio in August 2019. Version 3 of the RRAF will be derived from the National Weather Service National Water Model. Development on this version will start in Spring 2019 and should take four years for it to be merged into the National Water Model system. For MDA, we continue to promote RRAF website and monitor the output, comparing it to real time data to make sure that the model is working correctly.
Heather Johnson, Hydrologist 3, Minnesota Department of Agriculture
The authors are solely responsible for the content of these proceedings. The technical information does not necessarily reflect the official position of the sponsoring agencies or institutions represented by planning committee members, and inclusion and distribution herein does not constitute an endorsement of views expressed by the same. Printed materials included herein are not refereed publications. Citations should appear as follows. EXAMPLE: Authors. 2019. Title of presentation. Waste to Worth. Minneapolis, MN. April 22-26, 2019. URL of this page. Accessed on: today’s date.
The purpose of the MI EnviroImpact Tool is to provide farmers with a daily runoff risk decision support tool that can aid in effectively planning short-term manure and nutrient application. This not only helps keep nutrients on the field and potentially saves money, but it also helps to protect our waterways in Michigan.
Figure 1. Livestock operations are a readily available source of manure nutrients. With effective nutrient application, farmers might be able to reduce the use of commercial fertilizers and save money.Figure 2. With the MI EnviroImpact tool, farmers are able to plan for effective short-term manure application.
What did we do?
Farmer interest groups were pulled together for initial piloting and testing of the MI EnviroImpact tool to hear what worked and what needed improvement. The goal was to make this a very user-friendly tool that everyone could use. Additionally, educational and outreach materials were created (factsheet, postcard, YouTube videos, and presentations) to help get the word out about this decision support tool. The ultimate goal of the MI EnviroImpact tool is for use as a decision support tool for short-term manure and nutrient application. The tool derives the runoff risk forecast from real-time precipitation and temperature forecasts. This information is then combined with snow melt, soil moisture and temperature, and other landscape characteristics to forecast times when the risk of runoff will be higher. The MI EnviroImpact tool is applicable in all seasons and has a winter mode for times when the average daily snow depth is greater than 1 inch or the 3-day average soil temperature (top 2 inches) is below freezing.
Figure 3. The MI EnviroImpact tool displaying both winter and non-winter modes of daily runoff risk.
What did we learn?
Through our work with the MI EnviroImpact Tool and those that helped to develop this tool, we were able to spread awareness of this user-friendly tool, so that more farmers would be likely to use it to help in nutrient application planning. Furthermore, those outside of the farming community have been very encouraged to see that agriculture is continuing to take steps in being environmentally friendly. Additionally, others have viewed this tool as a resource outside of farmers, showing that the MI EnviroImpact Tool has broader implications than just agriculture.
Future Plans
Future plans include continuing education about the MI EnviroImpact Tool as well as continued distribution of educational materials to help spread awareness of the tool itself.
Additional Information
Those who would like to learn more about the MI EnviroImpact Tool can visit the following links:
This project was prepared by MSU under award NA14OAR4170070 from the National Oceanic and Atmospheric Administration, U.S. Department of Commerce through the Regents of the University of Michigan. The statements, findings, conclusions, and recommendations are those of the author(s) and do not necessarily reflect the views of the National Oceanic and Atmospheric Administration, the Department of Commerce, or the Regents of the University of Michigan.
MSU is an affirmative-action, equal-opportunity employer, committed to achieving excellence through a diverse workforce and inclusive culture that encourages all people to reach their full potential. Michigan State University Extension programs and materials are open to all without regard to race, color, national origin, gender, gender identity, religion, age, height, weight, disability, political beliefs, sexual orientation, marital status, family status or veteran status. Issued in furtherance of MSU Extension work, acts of May 8 and June 30, 1914, in cooperation with the U.S. Department of Agriculture. Jeff Dwyer, Director, MSU Extension, East Lansing, MI 48824. This information is for educational purposes only. Reference to commercial products or trade names does not imply endorsement by MSU Extension or bias against those not mentioned.
Figure 4. Partners and funding sources involved in supporting, developing, and implementing the MI EnviroImpact tool.
Project Collaborators:
Heather A. Triezenberg, Ph.D.
Extension Specialist and Program Leader, Michigan Sea Grant
Michigan State University Extension
Community, Food and Environment Institute
Fisheries and Wildlife Department Meaghan Gass
Sea Grant Extension Educator
Michigan State University Extension
Jason Piwarski
GIS Specialist
Michigan State University
Institute of Water Research
Dustin Goering
Senior Hydrologist
North Central River Forecast Center
NOAA National Weather Service
Cindy Hudson
Communications Manager, Michigan Sea Grant
Community, Food & Environment Institute
Michigan State University Extension
Jeremiah Asher
Assistant Director
Institute of Water Research
Michigan State University
Kraig Ehm
Multimedia Producer
ANR Communications and Marketing
College of Agriculture and Natural Resources
Michigan State University
Luke E. Reese
PhD, Associate Professor
Biosystems and Agricultural Engineering
Michigan State University
Marilyn L. Thelen
Associate Director, Agriculture and Agribusiness Institute
Michigan State University Extension
Todd Marsee
Senior Graphic Designer
Michigan Sea Grant
University of Michigan
Mindy Tape
Manager
ANR Communications & Marketing
Michigan State University Extension
The authors are solely responsible for the content of these proceedings. The technical information does not necessarily reflect the official position of the sponsoring agencies or institutions represented by planning committee members, and inclusion and distribution herein does not constitute an endorsement of views expressed by the same. Printed materials included herein are not refereed publications. Citations should appear as follows. EXAMPLE: Authors. 2019. Title of presentation. Waste to Worth. Minneapolis, MN. April 22-26, 2019. URL of this page. Accessed on: today’s date.
For many livestock producers, manure storage capacity is limited. Severe weather events can intensify the manure storage capacity limitations. One option available to producers is to haul manure to the field and place it in manure staging areas. This can reduce the manure storage capacity needed at the livestock facility, and reduce manure hauling time in the spring. Hauling of manure to manure staging areas is typically done when convenient, with little thought about the effect of timing and nutrient loss. This study examined nutrient loss from manure staging piles placed in November, January, and March over a course of five years.
What Did We Do?
This study compared manure staging areas with manure placed at three different times (November, January, and March) and two different bedding materials (straw, no straw).
For each placement event (November, January, March) manure from the tie stall barn (straw bedding) and the butterfly sheds (sand bedding) at the Utah State University Caine Dairy was hauled to Cache Junction, UT and placed in manure staging piles. Composite manure samples were collected from each pile (manure type) at the time of placement, and at removal each year (in the fall after crop harvest) for five years. Manure samples were analyzed for ammonium-nitrogen using Method 12-107-04-1-F on a Lachat Flow Injection Analysis (FIA) analyzer and total N using an Elementar combustion analyzer. Leachate was collected biweekly by means of zero-tension lysimeters installed under the manure staging areas and analyzed for ammonium-nitrogen using Method 10-107-06-2-O and nitrate-nitrogen using Method 10-107-04-1-R on a Lachat FIA analyzer. Soil samples were taken to a depth of 90 cm and analyzed for nitrate-nitrogen using Method 12-107-04-1-F on a Lachat FIA analyzer.
What Have We Learned?
Figure 1. Total N (mg) in leachate/lysimeter under manure staging piles.
Significant leachate was produced under the manure staging piles placed during the winter months, with the manure with no straw (sand bedding) producing more leachate than the manure with straw (straw bedding). Manure piles placed in November produced less leachate and lost less total N than those placed in January and March (Figure 1). Due to Utah’s dry climate, this is most likely due to drying of the manure in the late fall months, which enabled the manure to absorb more moisture during the winter months. Manure piles placed in January produced the most leachate and exhibited more total N loss (Figure 2).
Figure 2. Difference in manure Total N% from time of placement to removal for land application.
The snow and snow melt most likely contributed to the large amount of leachate and nitrogen loss observed under the January piles.
Future Plans
The results of this study indicate that straw bedding helps retain the nitrogen in the manure and reduce nitrogen loss from manure placed in manure staging piles. In addition, in Utah’s dry climate, the timing of manure staging pile placement does affect nutrient loss with placement in late November minimizing nutrient leaching. This information will be presented to producers, NRCS, DWQ, and other ag professionals.
Authors
Rhonda Miller, Ph.D.; Agricultural Systems Technology and Education Dept.; Utah State University, rhonda.miller@usu.edu
Jennifer Long; Agricultural Systems Technology and Education Dept.; Utah State University
Additional Information
Website: http://agwastemanagement.usu.edu
Acknowledgements
The authors gratefully acknowledge support from Utah State University Experiment Station.
The authors are solely responsible for the content of these proceedings. The technical information does not necessarily reflect the official position of the sponsoring agencies or institutions represented by planning committee members, and inclusion and distribution herein does not constitute an endorsement of views expressed by the same. Printed materials included herein are not refereed publications. Citations should appear as follows. EXAMPLE: Authors. 2019. Title of presentation. Waste to Worth. Minneapolis, MN. April 22-26, 2019. URL of this page. Accessed on: today’s date.
In 2015, Washington State Department of Agriculture (WSDA) partnered with local and state agencies to help identify potential sources of fecal coliform bacteria that were impacting shellfish beds in northwest Washington. WSDA and Pollution Identification and Correction (PIC) program partners began collecting ambient, as well as rain-driven, source identification water samples. Large watersheds with multiple sub-basins, changing weather and field conditions, and recent nutrient applications, meant new sites were added almost daily. The increased sampling created an avalanche of new data. With this data, we needed to figure out how to share it in a way that was timely, clear and could motivate change.
Conveying complex water quality results to a broad audience can be challenging. Previously, water quality data would be shared with the public and partners through spreadsheets or graphs via email, meetings or quarterly updates. However, the data that was being shared was often too late or too overwhelming to link locations, weather or field conditions to water quality. Even though plenty of data was available, it was difficult for it to have meaningful context to the general public.
Ease of access to results can help inform landowners of hot spots near their home, it can link recent weather and their own land management practices with water quality, as well as inform and influence decision-making.
What Did We Do?
Using basic GIS tools we created an interactive map, to share recent water quality results. The map is available on smartphones, tablets and personal computers, displaying near-real-time results from multiple agencies. Viewers can access the map 24 hours a day, 7 days a week.
We have noticed increased engagement from our dairy producers, with many checking the results map regularly for updates. The map is symbolized with graduated stop light symbology, with poor water quality shown in red and good in green. If they see a red dot or “hot spot” in their neighborhood they may stop us on the street, send an email, or call with ideas or observations of what they believe may have influenced water quality. It has opened the door to conversations and partnerships in identifying and correcting possible influences from their farm.
The map also contains historic results data for each site, which can show changes in water quality. It allows the viewer to evaluate if the results are the norm or an anomaly. “Are high results after a rainfall event or when my animals are on that pasture?”
The online map has also increased engagement with our Canadian neighbors to the north. By collecting samples at the US/Canadian border we have been able to map streams where elevated bacteria levels come across the border. This has created an opportunity to partner with our Canadian counterparts to continue to identify and correct sources.
What Have We Learned?
You do not need to be a GIS professional to create an app like this for your organization. Learning the system and fine-tuning the web application can take some time, but it is well worth the investment. GIS skills derived from this project have proven invaluable as the app transfers to other areas of non-point work. The web application has created great efficiencies in collaboration, allowing field staff to quickly evaluate water quality trends in order to spend their time where it is most needed. The application has also provided transparency to the public regarding our field work, demonstrating why we are sampling particular areas.
From producer surveys, we have learned that viewers prefer a one-stop portal for information. Viewers are less concerned about what agency collected the data as they are interested in what the data says. This includes recent, as well as historical water quality data, field observations; such as wildlife or livestock presence or other potential sources. Also, a brief weekly overview of conditions, observations and/or trends has been requested to provide additional context.
Future Plans
The ease and efficiency of the mobile mapping and data sharing has opened the door to other collaborative projects. Currently we are developing a “Nutrient Tracker” application that allows all PIC partners to easily update a map from the field. The map allows the user to log recent field applications of manure. Using polygons to draw the area on the field, staff can note the date nutrients were identified, type of application, proximity to surface water, if it was a low-, medium- or high-risk application, if follow-up is warranted, and what agency would be the lead contact. This is a helpful tool in learning how producers utilize nutrients, to refer properties of concern to the appropriate agency, and to evaluate recent water quality results against known applications.
Developing another outreach tool, WSDA is collecting 5 years of fall soil nitrate tests from all dairy fields in Washington State. The goal is to create a visual representation of soil data, to demonstrate to producers how nitrate levels on fields have changed from year to year, and to easily identify areas that need to be re-evaluated when making nutrient application decisions.
As part of a collaborative Pollution Identification and Correction (PIC) group, we would like to create a “Story Map” that details the current situation, why it is a concern, explain potential sources and what steps can be taken at an individual level to make a difference. A map that visually demonstrates where the watersheds are and how local neighborhoods really do connect to people 7 miles downstream. An interactive map that not only shows sampling locations, but allows the viewer to drill down deeper for more information about the focus areas, such as pop-ups that explain what fecal coliform bacteria are and what factors can increase bacteria levels. We envision a multi-layer map that includes 24-hour rainfall, river rise, and shellfish bed closures. This interactive map will also share success stories as well as on-going efforts.
Author
Kerri Love, Dairy Nutrient Inspector, Dairy Nutrient Management Program, Washington State Department of Agriculture
The web application was a collaborative project developed by Kyrre Flege, Washington State Department of Agriculture and Jessica Kirkpatrick, Washington State Department of Ecology.
The authors are solely responsible for the content of these proceedings. The technical information does not necessarily reflect the official position of the sponsoring agencies or institutions represented by planning committee members, and inclusion and distribution herein does not constitute an endorsement of views expressed by the same. Printed materials included herein are not refereed publications. Citations should appear as follows. EXAMPLE: Authors. 2017. Title of presentation. Waste to Worth: Spreading Science and Solutions. Cary, NC. April 18-21, 2017. URL of this page. Accessed on: today’s date.
For the last decade, Argentinian CAFO’s have been increasing in number and size. Poultry farming showed remarkable growth and brought to light the absence of litter and nutrient management plans. Land application of poultry litter is the most common practice, but there is insufficient data to support recommended agronomic rates of application.
In this study, we developed the first comprehensive physiochemical characterization of poultry litter to accurately state average nutrient concentrations and data variability to support development of future litter best management practices. Simultaneously, we estimated the crop fertilization potential of poultry litter in Entre Rios Province.
What did we do?
Entre Rios Province contributes 51% of total Argentinian broiler production, holding over 2,600 chicken farms. Thus, the Ministry of Agriculture Industry contacted integrated broiler farmers, which all seemed to share a modern production protocol related to housing conditions, feed ration, and bedding management, and who were willing to participate in the sampling project. A sampling protocol was written following recognized literature sources (Zhang and Hamilton) and hands-on training sessions were developed with producers in charge of poultry litter sampling. A total of 55 broiler farms were sampled with 3 replicates per farm.
The following parameters were selected for analysis: organic matter, total nitrogen, ammoniacal nitrogen, organic nitrogen, phosphorus, potassium, calcium, magnesium, sodium, zinc, copper, electrical conductivity, pH and moisture content. Analytical procedures were stated with a certified local lab following recommended methods for manure analysis. A survey was also conducted at each sampling farm to assess variability on bedding age and material.
What have we learned?
The average stocking density was 11.3 chickens/m2. The number of flocks grown on the litter before house cleaning ranged from 1 to 11 with an average of 4.7. However, 47.3% of the farms’ litter had less than 5 flocks while 52.7% presented 5 or more flocks. There was no significant correlation between the physiochemical parameters measured and bird density, nor with the number of flocks raised on the litter.
Table 1. Litter Type
Litter Type
Farms (%)
Woodchips
50.91
Rice hulls
23.64
Woodchips + rice hulls
21.82
Peanut hulls
3.63
While total nitrogen (TN) and phosphorus means were comparable to normal values reported in U.S. literature (Britton and Bullard; Zhang et al.), the variability of data was significant. Table 2 shows a summary of the most relevant analytical results obtained.
Table 2. Physical and Chemical Average Litter Composition (Dry Basis). SEM*: Standard Error of the Mean
Mean
SEM*
St. Deviation
C.V. (%)
Organic matter (%)
79.13
0.62
4.61
5.82
Total nitrogen (%)
2.96
0.05
0.38
12.86
Phosphorus (%)
0.97
0.04
0.30
30.83
Sodium (%)
0.41
0.02
0.16
39.42
Electrical conductivity (mmhos/cm)
8.63
0.49
3.66
42.48
pH (I.U.)
7.56
0.04
0.31
4.07
Moisture content (%)
31.50
0.63
4.65
14.78
The coefficients of variation were especially high for phosphorus, sodium and electrical conductivity. This could be a critical factor governing poultry litter land application rates that promote neither phosphorus loss via surface runoff nor buildup of salts or sodium in the soil profile.
Raising over 359 million chickens annually, broiler litter value in Entre Rios Province would surpass 51 million dollars if it were fully used as commercial fertilizer substitute. Based upon the average nutrient content, 51,100 tons of nitrogen, 17,100 tons of phosphorus and 23,600 tons of potassium would be available; enough to fertilize 349,000 hectares of corn based upon crop nitrogen requirements whilst a plan based upon phosphorus would supply 629,000 hectares. Other critical factors like storage duration of litter outdoors, land application method, and the availability of litter nitrogen will impact the final calculation of plant available nitrogen (PAN), which is generally assumed to be 50% of TN when surface applied (Chastain et al.). Entre Rios farmers sow around 245,000 hectares of corn annually, hence 71% of the planted area could potentially be fully nitrogen fertilized using broiler litter instead of commercial fertilizer.
These results showed that while there is strong potential for litter land application at agronomic rates in Entre Rios, individual litter samples properly taken and analyzed are still needed to sustain environmentally sound nutrient management plans due to the large variability of the analytical results.
Future Plans
The information presented will be utilized as input data for developing draft Broiler Farms’ Nutrient Management Plans that will serve as a model for other Argentinian CAFO. Currently, laboratory results from Buenos Aires Province hen farms are being analyzed.
Corresponding author, title, and affiliation
Roberto Maisonnave, President at AmbientAgro – International Environmental Consulting
Karina Lamelas, Director of Poultry and Swine Production at Ministry of Agriculture (Argentina). Gisela Mair, Ministry of Agriculture (Argentina). Norberto Rodriguez, Ministry of Agricultrue and University of Tres de Febrero (Argentina).
Additional information
Britton, J. and G. Bullard. 1998 Summary of Poultry Litter Samples in Oklahoma. Oklahoma Cooperative Extension Service. CR-8214.
Maisonnave, R.; Lamelas, K. y G. Mair. Buenas prácticas de manejo y utilización de cama de pollo y guano. Ministerio de Agroindustria de la Nación Argentina. 2016.
Zhang, H. and D. Hamilton. Sampling animal manure. Oklahoma Cooperative Extension Service. PSS-2248.
Zhang, H.; Hamilton, D. and J. Payne. Using Poultry Litter as Fertilizer. Oklahoma Cooperative Extension Service. PSS-2246.
Acknowledgements
Dr. Jorge Dillon and Ing. José Noriega (SENASA)
Ing. Agr. Juan Martin Gange and Lic. Corina Bernigaud (INTA)
Ing. Agr. Alan Nielsen and M. Vet. Juan Nehuén Rossi (Granja Tres Arroyos)
Over the past four decades, the number of custom slaughterhouses in Michigan has steadily decreased as the number of livestock producers declined. Those who remain are growing larger as they capitalize on the buy local food craze by providing fresh USDA-approved boxed meats at a meat counter or by adding value to the meats by further processing (i.e., sausages, hams, etc.). All slaughterhouses in the State are regulated by the Michigan Department of Environmental Quality (MDEQ) who issues permits for the proper disposal of the process wastewater for those operations that are not connected to a municipal sewer.
Typical disposal of the process wastewater involves removal of the solids through septic tank filtration and screens followed by storage of the process wastewater in ponds for eventual disposal on crop ground at agronomic rates. Facilities operating in this manner are issued a Groundwater Discharge Permit from MDEQ. However, because the state classifies slaughterhouses as an industry, the storage ponds require double liners and must meet a hydraulic conductivity of 1 x 10⁻⁷ centimeters/second.
A process wastewater storage pond is being designed for a slaughterhouse located in Coopersville, Michigan. The existing process wastewater holding pond is not sufficient to hold process water generated at the facility due to the recent expansions in slaughterhouse operations. Therefore, modifications to the existing holding pond and construction of a new holding pond to accommodate the process water generated is underway. The construction of the ponds is scheduled for spring 2017.
This paper evaluates the applicability, economic feasibility compared to geomembrane liners and constructability of pond liners using AquaBlok.
AquaBlok is a man-made clay pellet material that handles like gravel and is placed in varying thicknesses depending on the desired hydraulic conductivity and then hydrated to create a low permeable liner. Advertised as a “composite particle system” each AquaBlok particle contains an individual piece of limestone as its core. When a continuous layer of individual particles is applied, the clay (i.e., a high-quality sodium bentonite coating) surrounding each stone hydrates, swells, and binds together to produce a low-permeable earthen liner when introduced to a water environment.
What did we do?
Based on the current operations and future growth forecast, the slaughterhouse requires a pond(s) with total holding capacity of approximately 1.6 million gallons of process wastewater. This accounts for process wastewater generated in total of eight (8) months period. Soil borings were taken at the site and soil samples were collected to determine geotechnical parameters including hydraulic conductivity. Total of eight (8) soil borings were advanced to an approximate depth of fifty (50) feet below ground surface. Based on the laboratory testing results, the hydraulic conductivity of the native clay did not meet the MDEQ’s minimum 1 x 10⁻⁷ cm/s requirement. These results indicate a need for a composite liner for the existing pond as well as the new pond. Two candidate liner materials are being evaluated. They are 1) clay liner that is constructed of AquaBlok and 2) geomembrane liner. Geomembrane are commonly being used for wastewater! holding ponds. AquaBlok is not being frequently used as liners for holding ponds. However, once constructed appropriately, this material would provide a liner with hydraulic conductivity of less than 1 x 10⁻⁸ cm/s and appropriate shear and compressive strength. Currently, the economic feasibility of the two methods is being evaluated. Also, the constructability of the AqaBlok liners is being investigated. The ponds are scheduled to be constructed in Spring 2017.
What have we learned?
The evaluation of AquaBlok as a liner material for process wastewater holding ponds is being evaluated. The construction of the ponds is scheduled for Spring 2017. This material has promising geotechnical parameters and can provide a liner with a very low permeability once constructed appropriately. A detailed discussion of the material evaluation, liner construction methodology, economic analysis, and regulatory compliance will be presented during the oral presentation.
Use of a geotextile liner is an approved method to construct industrial wastewater storage ponds in Michigan but cost and liner installer availability is typically a detriment to fast installations.
Future Plans
Due to a plant expansion, the design drawings and application to expand the process wastewater pond capacity and to meet the state requirements for minimum liner permeability are currently in review by the state MDEQ. Construction of the new storage pond is planned for spring 2017 pending MDEQ review and approval.
Corresponding author, title, and affiliation
Matthew J. Germane, PE, Senior Project Engineer at Environmental Resources Group, LLC
The authors wish to acknowledge DeVries Meats, Inc., in Coopersville, MI and their owner, Ken DeVries, whose site the design work and cost evaluations were completed for.
Why Tackle Mortality Management? It’s Ripe for Revolution.
The poultry industry has enjoyed a long run of technological and scientific advancements that have led to improvements in quality and efficiency. To ensure its hard-won prosperity continues into the future, the industry has rightly shifted its focus to sustainability. For example, much money and effort has been expended on developing better management methods and alternative uses/destinations for poultry litter.
In contrast, little effort or money has been expended to improve routine mortality management – arguably one of the most critical aspects of every poultry operation. In many poultry producing areas of the country, mortality management methods have not changed in decades – not since the industry was forced to shift from the longstanding practice of pit burial. Often that shift was to composting (with mixed results at best). For several reasons – improved biosecurity being the most important/immediate – it’s time that the industry shift again.
The shift, however, doesn’t require reinventing the wheel, i.e., mortality management can be revolutionized without developing anything revolutionary. In fact, the mortality management practice of the future owes its existence in part to a technology that was patented exactly 20 years ago by Tyson Foods – large freezer containers designed for storing routine/daily mortality on each individual farm until the containers are later emptied and the material is hauled off the farm for disposal.
Despite having been around for two decades, the practice of using on-farm freezer units has received almost no attention. Little has been done to promote the practice or to study or improve on the original concept, which is a shame given the increasing focus on two of its biggest advantages – biosecurity and nutrient management.
Dusting off this old BMP for a closer look has been the focus of our work – and with promising results. The benefits of hitting the reset button on this practice couldn’t be more clear:
Greatly improved biosecurity for the individual grower when compared to traditional composting;
Improved biosecurity for the entire industry as more individual farms switch from composting to freezing, reducing the likelihood of wider outbreaks;
Reduced operational costs for the individual poultry farm as compared to more labor-intensive practices, such as composting;
Greatly reduced environmental impact as compared to other BMPs that require land application as a second step, including composting, bio-digestion and incineration; and
Improved quality of life for the grower, the grower’s family and the grower’s neighbors when compared to other BMPs, such as composting and incineration.
What Did We Do?
We basically took a fresh look at all aspects of this “old” BMP, and shared our findings with various audiences.
That work included:
Direct testing with our own equipment on our own poultry farm regarding
Farm visitation by animals and other disease vectors,
Freezer unit capacity,
Power consumption, and
Operational/maintenance aspects;
Field trials on two pilot project farms over two years regarding
Freezer unit capacity
Quality of life issues for growers and neighbors,
Farm visitation by animals and other disease vectors,
Operational and collection/hauling aspects;
Performing literature reviews and interviews regarding
Farm visitation by animals and other disease vectors
Pathogen/disease transmission,
Biosecurity measures
Nutrient management comparisons
Quality of life issues for growers and neighbors
Ensuring the results of the above topics/tests were communicated to
Growers
Integrators
Legislators
Environmental groups
Funding agencies (state and federal)
Veterinary agencies (state and federal)
What Have We Learned?
The breadth of the work at times limited the depth of any one topic’s exploration, but here is an overview of our findings:
Direct testing with our own equipment on our own poultry farm regarding
Farm visitation by animals and other disease vectors
Farm visitation by scavenger animals, including buzzards/vultures, raccoons, foxes and feral cats, that previously dined in the composting shed daily slowly decreased and then stopped entirely about three weeks after the farm converted to freezer units.
The fly population was dramatically reduced after the farm converted from composting to freezer units. [Reduction was estimated at 80%-90%.]
Freezer unit capacity
The test units were carefully filled on a daily basis to replicate the size and amount of deadstock generated over the course of a full farm’s grow-out cycle.
The capacity tests were repeated over several flocks to ensure we had accurate numbers for creating a capacity calculator/matrix, which has since been adopted by the USDA’s Natural Resources Conservation Service to determine the correct number of units per farm based on flock size and finish bird weight (or number of grow-out days) in connection with the agency’s cost-share program.
Power consumption
Power consumption was recorded daily over several flocks and under several conditions, e.g., during all four seasons and under cover versus outside and unprotected from the elements.
Energy costs were higher for uncovered units and obviously varied depending on the season, but the average cost to power one unit is only 90 cents a day. The total cost of power for the average farm (all four units) is only $92 per flock. (See additional information for supporting documentation and charts.)
Operational/maintenance aspects;
It was determined that the benefits of installing the units under cover (e.g., inside a small shed or retrofitted bin composter) with a winch system to assist with emptying the units greatly outweighed the additional infrastructure costs.
This greatly reduced wear and tear on the freezer component of the system during emptying, eliminated clogging of the removable filter component, as well as provided enhanced access to the unit for periodic cleaning/maintenance by a refrigeration professional.
Field trials on two pilot project farms over two years regarding
Freezer unit capacity
After tracking two years of full farm collection/hauling data, we were able to increase the per unit capacity number in the calculator/matrix from 1,500 lbs. to 1,800 lbs., thereby reducing the number of units required per farm to satisfy that farm’s capacity needs.
Quality of life issues for growers and neighbors
Both farms reported improved quality of life, largely thanks to the elimination or reduction of animals, insects and smells associated with composting.
Farm visitation by animals and other disease vectors
Both farms reported elimination or reduction of the scavenging animals and disease-carrying insects commonly associated with composting.
Operational and collection/hauling aspects
With the benefit of two years of actual use in the field, we entirely re-designed the sheds used for housing the freezer units.
The biggest improvements were created by turning the units so they faced each other rather than all lined up side-by-side facing outward. (See additional information for supporting documentation and diagrams.) This change then meant that the grower went inside the shed (and out of the elements) to load the units. This change also provided direct access to the fork pockets, allowing for quicker emptying and replacement with a forklift.
Performing literature reviews and interviews regarding
Farm visitation by animals and other disease vectors
More research confirming the connection between farm visitation by scavenger animals and the use of composting was recently published by the USDA National Wildlife Research Center:
“Certain wildlife species may become habituated to anthropogenically modified habitats, especially those associated with abundant food resources.Such behavior, at least in the context of multiple farms, could facilitate the movement of IAV from farm to farm if a mammal were to become infected at one farm and then travel to a second location. … As such, the potential intrusion of select peridomestic mammals into poultry facilities should be accounted for in biosecurity plans.”
Root, J. J. et al. When fur and feather occur together: interclass transmission of avian influenza A virus from mammals to birds through common resources. Sci. Rep. 5, 14354; doi:10.1038/ srep14354 (2015) at page 6 (internal citations omitted; emphasis added).
Pathogen/disease transmission,
Animals and insects have long been known to be carriers of dozens of pathogens harmful to poultry – and to people. Recently, however, the USDA National Wildlife Research Center demonstrated conclusively that mammals are not only carriers – they also can transmit avian influenza virus to birds.
The study’s conclusion is particularly troubling given the number and variety of mammals and other animals that routinely visit composting sheds as demonstrated by our research using a game camera. These same animals also routinely visit nearby waterways and other poultry farms increasing the likelihood of cross-contamination, as explained in this the video titled Farm Freezer Biosecurity Benefits.
“When wildlife and poultry interact and both can carry and spread a potentially damaging agricultural pathogen, it’s cause for concern,” said research wildlife biologist Dr. Jeff Root, one of several researchers from the National Wildlife Research Center, part of the USDA-APHIS Wildlife Services program, studying the role wild mammals may play in the spread of avian influenza viruses.
Biosecurity measures
Every day the grower collects routine mortality and stores it inside large freezer units. After the broiler flock is caught and processed, but before the next flock is started – i.e. when no live birds are present, a customized truck and forklift empty the freezer units and hauls away the deadstock. During this 10- to 20- day window between flocks biosecurity is relaxed and dozens of visitors (feed trucks, litter brokers, mortality collection) are on site in preparation for the next flock.
“Access will change after a production cycle,” according to a biosecurity best practices document (enclosed) from Iowa State University. “Empty buildings are temporarily considered outside of the [protected area and even] the Line of Separation is temporarily removed because there are no birds in the barn.”
Nutrient management comparisons
Research provided by retired extension agent Bud Malone (enclosed) provided us with the opportunity to calculate nitrogen and phosphorous numbers for on-farm mortality, and therefore, the amount of those nutrients that can be diverted from land application through the use of freezer units instead of composting.
The research (contained in an enclosed presentation) also provided a comparison of the cost-effectiveness of various nutrient management BMPs – and a finding that freezing and recycling is about 90% more efficient than the average of all other ag BMPs in reducing phosphorous.
Quality of life issues for growers and neighbors
Local and county governments in several states have been compiling a lot of research on the various approaches for ensuring farmers and their residential neighbors can coexist peacefully.
Many of the complaints have focused on the unwanted scavenger animals, including buzzards/vultures, raccoons, foxes and feral cats, as well as the smells associated with composting.
The concept of utilizing sealed freezer collection units to eliminate the smells and animals associated with composting is being considered by some government agencies as an alternative to instituting deeper and deeper setbacks from property lines, which make farming operations more difficult and costly.
Future Plans
We see more work on three fronts:
First, we’ll continue to do monitoring and testing locally so that we may add another year or two of data to the time frames utilized initially.
Second, we are actively working to develop new more profitable uses for the deadstock (alternatives to rendering) that could one day further reduce the cost of mortality management for the grower.
Lastly, as two of the biggest advantages of this practice – biosecurity and nutrient management – garner more attention nationwide, our hope would be to see more thorough university-level research into each of the otherwise disparate topics that we were forced to cobble together to develop a broad, initial understanding of this BMP.
Corresponding author (name, title, affiliation)
Victor Clark, Co-Founder & Vice President, Legal and Government Affairs, Farm Freezers LLC and Greener Solutions LLC
Bud Malone, retired University of Delaware Extension poultry specialist and owner of Malone Poultry Consulting
Bill Brown, University of Delaware Extension poultry specialist, poultry grower and Delmarva Poultry Industry board member
Delaware Department of Agriculture
Delaware Nutrient Management Commission
Delaware Office of the Natural Resources Conservation Service
Maryland Office of the Natural Resources Conservation Service
The authors are solely responsible for the content of these proceedings. The technical information does not necessarily reflect the official position of the sponsoring agencies or institutions represented by planning committee members, and inclusion and distribution herein does not constitute an endorsement of views expressed by the same. Printed materials included herein are not refereed publications. Citations should appear as follows. EXAMPLE: Authors. 2017. Title of presentation. Waste to Worth: Spreading Science and Solutions. Cary, NC. April 18-21, 2017. URL of this page. Accessed on: today’s date.
In Nebraska alone, nearly 400 earthen manure storage structures are in operation; approximately four dozen requests to cease operation of permitted lagoons were received by the Nebraska Department of Environmental Quality in the prior decade with many more non-permitted storage structures being in need of proper closure. Abandoned livestock lagoons, earthen manure storage basins, and other manure storages (e.g. concrete pits) need to be decommissioned in a manner that controls potential environmental risk and makes economical use of accumulated nutrients. Currently, limited guidance is available to support lagoon closure planning and implementation and few professionals who support livestock producers have experience planning or participating in the manure storage closure process. The main focus of this project was to produce two videos that document the processes for planning and executing a lagoon closure.
What did we do?
The University of Nebraska Haskell Ag Laboratory, located near Concord, NE, had an anaerobic lagoon that was operated for over 20 years, but has not received swine manure additions since 2009 when the swine unit was depopulated. The decommissioning of this storage structure was proposed in 2014 and provided our team an opportunity to plan, implement and document the procedures necessary to properly close this structure. When we went to find material on how to accomplish this properly, we did not find suitable material. Two grants were secured in 2016 from the U.S. Pork Center of Excellence (USPCE) to fund our team efforts to document the closure process – from planning to completion – with two separate videos. The first video is focused on the planning activities necessary to prepare for removal and utilization of stored liquid and sludge. The second is focused on the liquid and sludge removal and utilization activities, decommissioning of conveyance structures, and deconstruction of the lagoon berm to return the site to a natural grade.
Activities conducted to execute the lagoon closure have included:
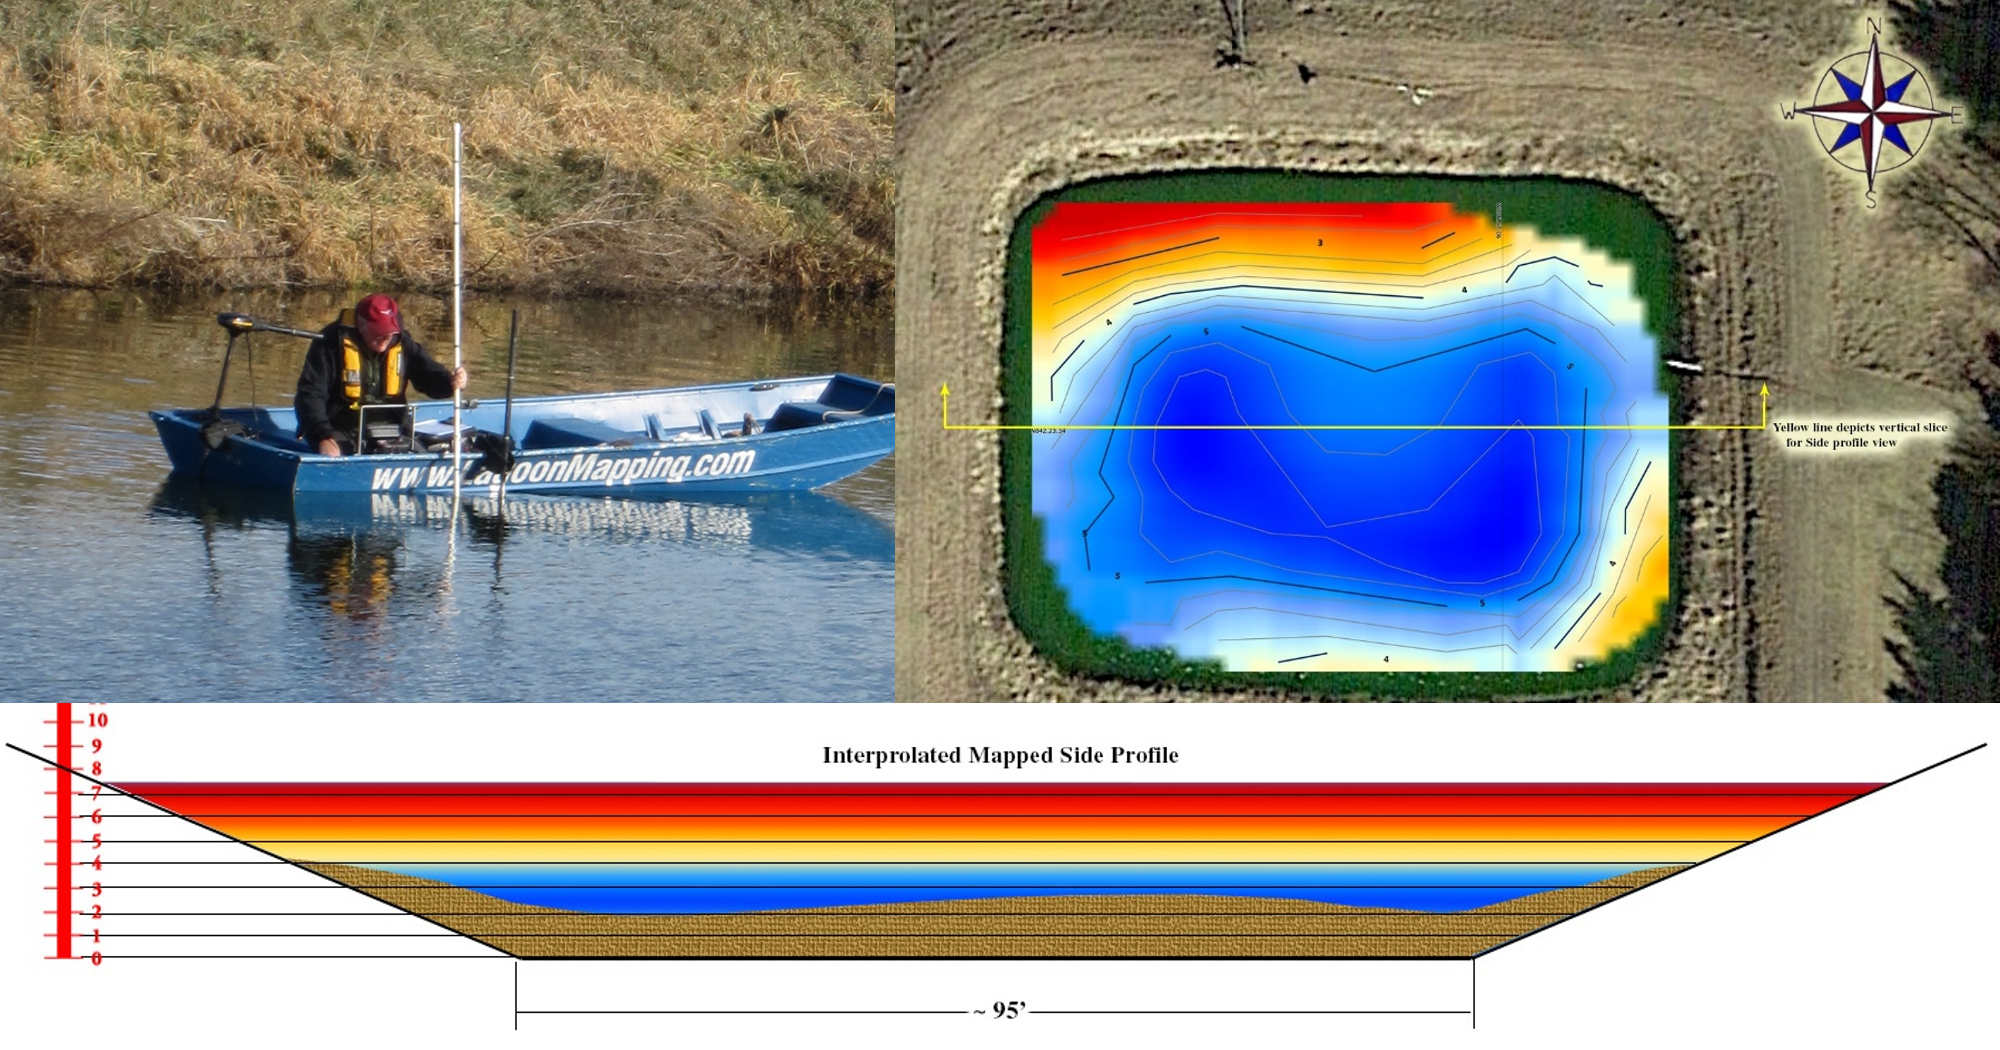
1) Mapping of sludge levels with sonar and analyzing sludge samples to estimate volume and nutrient content of sludge, which enabled development of a land application plan for utilizing the products
Figure 1. Sonar sludge mapping.
2) De-watering the lagoon (effluent used for sprinkler irrigation and flood irrigation)
3) Hosting a demonstration event during which participants:
a. observed sludge removal and land application processes,
b. participated in a manure spreader calibration,
c. inspected the soil beneath the lagoon liner,
d. viewed the abandoned production buildings and heard about options for eliminating conveyance of liquid from the building to the lagoon,
e. explored alternative sludge removal methods, and
f. participated in a classroom session where presenters shared details of the closure planning process, cost-share opportunities for closure of manure storage structures, and expectations for re-grading and re-seeding the site following removal of sludge.
Figure 2. Participants learned about planning land application of the sludge.
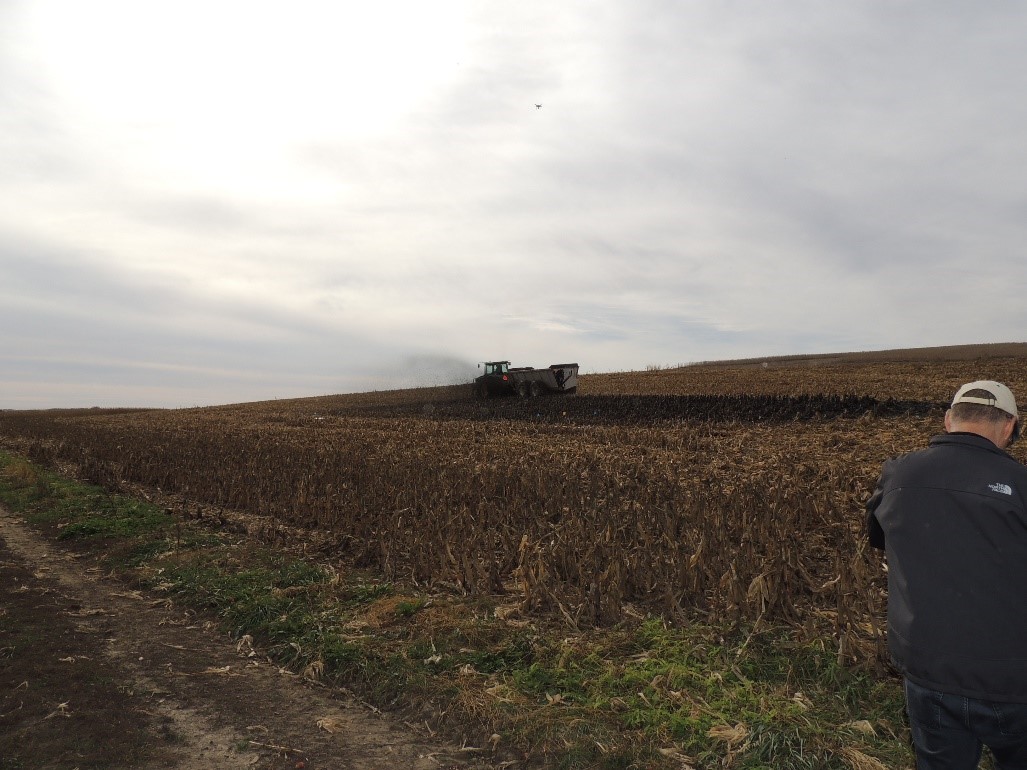
Figure 3. Land application of the sludge and calibration of the manure spreader.
4) Removing the sludge and applying it to cropland following the demonstration event.
Documentation of all planning, demonstration, and closure execution activities have been captured via extensive video footage, still photos, and participant interviews. Production of the videos is in process with completion and release of videos anticipated in summer 2017.
What have we learned?
Although every manure storage closure process is expected to present its own unique challenges and opportunities for learning, the process documented during this project has provided a number of insights:
1) While this process involved pumping liquid from the lagoon prior to attempting sludge removal in order to observe the sludge layer and document the volume present, a more appropriate, and likely more effective, process is to agitate the storage prior to and during pumping activities to enable handling all of the material as a slurry;
2) Dewatered sludge volume (nearly 200,000 gallons) and nutrient content (44.2 lbs. TKN, 37.5 lbs. organic N, 89.3 lbs. P2O5 and 7.6 lbs. K2O per 1,000 gallons) for this system yielded enough nutrients to apply to 80-100 acres, based on a phosphorus removal rate. It is unknown what the release of the organic N component of the sludge will be, but using just the phosphorus content, application of 1000 gallons per acre would provide enough phosphorus for what would be removed from 220 bushels of corn, which is worth approximately $35 with winter 2017 prices.;
3) Given the high phosphorus content in the sludge and that the nearby fields at the Haskell Ag Lab were not in need of phosphorus, an appropriate application rate for the sludge was determined as 8-10 tons/acre;
4) Soil beneath the lagoon liner yielded a phosphorus concentration of 556 ppm, likely a result of an inadequate liner in the lagoon as originally constructed in the 1960s; and
5) Installation of a bentonite clay liner during renovation of the structure in 1992 appeared to be effective as the liner was fully intact when observed during closure activities.
Pre-post surveys completed by 33 attendees of the demonstration event revealed that attendees improved their confidence in performing six key tasks identified by the team as being impactful. Results are summarized in Figure 4.
Figure 4. Impacts of the lagoon closure demonstration event.
Future Plans
We plan to continue the decommissioning process by:
1) Completing sludge removal and application to cropland;
2) Deconstructing the berms, leaving the liner intact, and returning the area to natural grade;
3) Seeding the area to establish ground cover and mitigate runoff and erosion; and
4) Plugging the inlet pipes in manure pits within the animal housing in lieu of removing buried conveyance pipes.
The two videos are in production and will be made available through the Pork Information Gateway (www.porkgateway.org) during summer 2017.
Corresponding author, title, and affiliation
Leslie Johnson, Research Technologist, University of Nebraska – Lincoln
The authors would like to recognize the U.S. Pork Center of Excellence (USPCE) for funding the development of the videos documenting this process and enabling us to complete this project. We would also like to acknowledge that without the support of the industry, who provided equipment and advice, we would not have been able to get this project off the ground. Also a special thanks to the Agricultural Research Division for their support.
Manage Cookie Consent
To provide the best experiences, we use technologies like cookies to store and/or access device information. Consenting to these technologies will allow us to process data such as browsing behavior or unique IDs on this site. Not consenting or withdrawing consent, may adversely affect certain features and functions.
Functional
Always active
The technical storage or access is strictly necessary for the legitimate purpose of enabling the use of a specific service explicitly requested by the subscriber or user, or for the sole purpose of carrying out the transmission of a communication over an electronic communications network.
Preferences
The technical storage or access is necessary for the legitimate purpose of storing preferences that are not requested by the subscriber or user.
Statistics
The technical storage or access that is used exclusively for statistical purposes.The technical storage or access that is used exclusively for anonymous statistical purposes. Without a subpoena, voluntary compliance on the part of your Internet Service Provider, or additional records from a third party, information stored or retrieved for this purpose alone cannot usually be used to identify you.
Marketing
The technical storage or access is required to create user profiles to send advertising, or to track the user on a website or across several websites for similar marketing purposes.


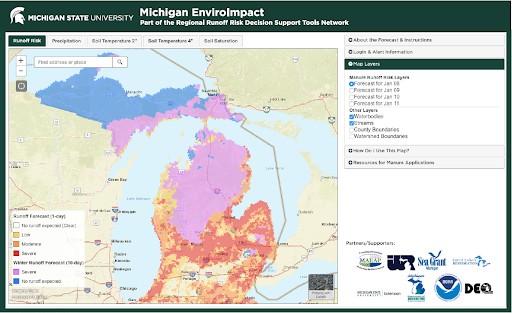


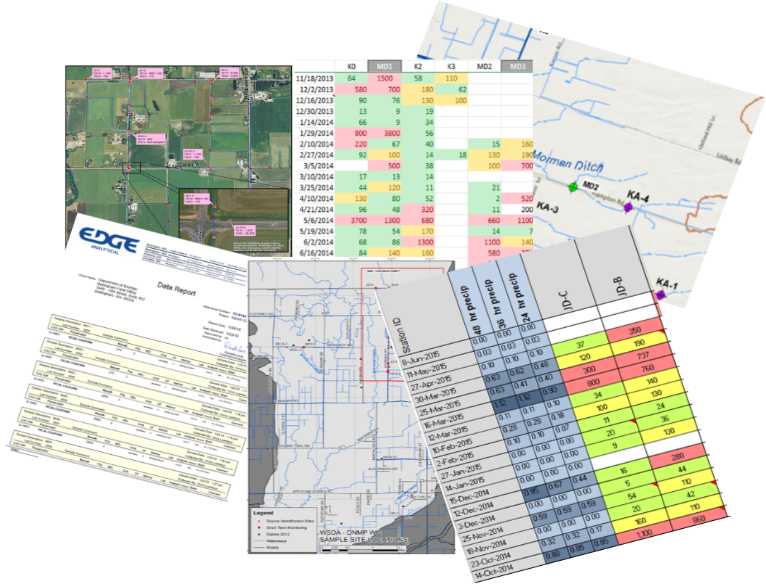
 ased engagement from our dairy producers, with many checking the results map regularly for updates. The map is symbolized with graduated stop light symbology, with poor water quality shown in red and good in green. If they see a red dot or “hot spot” in their neighborhood they may stop us on the street, send an email, or call with ideas or observations of what they believe may have influenced water quality. It has opened the door to conversations and partnerships in identifying and correcting possible influences from their farm.