
Purpose
As market demands, consumer expectations, and environmental regulations evolve, agricultural producers increasingly focus on improving profitability while minimizing environmental impact. Carbon Intensity (CI) scoring is a tool that quantifies the greenhouse gas emissions associated with crop production, thereby helping producers understand their ecological footprint. CI scores may influence crop sales for biofuel production for corn and soybean producers and may eventually affect livestock feed markets as companies seek carbon-neutral supply chains. Furthermore, renewable fuel producers may become eligible for Low Carbon Fuel Standard (LCFS) credits, where revenue is contingent on the lifecycle CI score of the fuel, and similar economic approaches may be required to drive livestock feeds toward carbon neutrality. Biofuels and animal feed share a strong relationship; ethanol plants generate distiller grains, a key component of livestock diets, and soybean processing plants generate soybean meal and soybean oil. Distiller grains represent a large portion of livestock feed, and soybean oil is a common biodiesel feedstock. We evaluate the emissions associated with corn and soybean production for each county in Iowa, assessing how their yield, crop rotation, tillage practices, cover crop implementation, and manure application affect their CI scores.
What Did We Do?
This study used the Department of Energy’s Feedstock Carbon Intensity Calculator (FD-CIC) and published literature to estimate corn and soybean production emissions throughout Iowa counties. Manure nutrient volumes were found using animal feeding operation data from Iowa DNR and manure production characteristics from ASAE D384.2. Data for yield, acres of corn, acres of soybean, acres of cover crop, acres of no-tillage, acres of reduced tillage, and acres of intensive tillage by county in Iowa were found using the USDA Quick Stats Database. Diesel emissions and grain drying emissions were calculated using Iowa State University Extension resources. The nitrogen fertilizer application rate was calculated using the yield goal method (manure) and Iowa State University Extension resources (commercial fertilizers). Limestone emissions were directly correlated to the amount of CaCO3 necessary to neutralize the H+ added to the soil from manure nitrogen and anhydrous ammonia. Embedded fertilizer emissions, biomass degradation emissions, leguminous N fixation emissions, and specific fuel emission factors were pulled from FD-CIC. Corn and soybean CI scores were calculated in g CO2e/bu units. Through this work, we provide actionable insights for corn and soybean supply chain stakeholders interested in improving sustainability and expanding revenue opportunities.
What Have We Learned?
Key emission sources from corn and soybean production are nitrous oxide (N2O) from fertilizer and manure application, biomass residue degradation, embedded emissions from fertilizer production, and tractor diesel emissions. Reducing CI in corn production can be achieved through increased yield, reduced tillage, increased cover crop, and manure application. Reduced tillage and increased cover cropping increase soil organic carbon (SOC). Depending on the location and its existing soil characteristics, reduced tillage, and cover crops can sequester soil carbon, decreasing the overall CI score of the corn and soybeans. On average, SOC reduced CI scores by 6% and 18% for corn and soybeans, respectively.
Yield significantly impacted CI scores; counties with greater yield featured reduced CI scores. The CI score dropped by 33 g CO2e/bu for corn as yield increased by bu/acre with an R2 of 0.53. For soybeans, the CI score dropped by 72 g CO2e/bu as yield increased by bu/acre with an R2 value of 0.19.
Manure also significantly impacted CI scores. Although manure has increased diesel emissions compared to anhydrous ammonia application, manure lacks the embedded emissions of anhydrous ammonia, P2O5, and K2O fertilizers. As the percentage of manure-derived nitrogen increased by 1%, the CI score for corn reduced by 14 g CO2e/bu, featuring an R2 of 0.25. As the percentage of manure-derived P2O5 increased by 1%, the CI score for soybeans reduced by 25 g CO2e/bu, featuring an R2 of 0.68.
Crop rotation had a less intuitive effect on the CI score. Corn-soybean (CS) rotations typically have higher yields, reduced nitrogen fertilizer inputs, and reduced tillage. Nonetheless, continuous corn (CC) rotations facilitate greater build-up of SOC (assuming county tillage practices are evenly distributed among corn and soybean acres). Also, CC rotations occurred more frequently in high-yielding counties. For these reasons, the CS rotation was not associated with a reduced CI score.
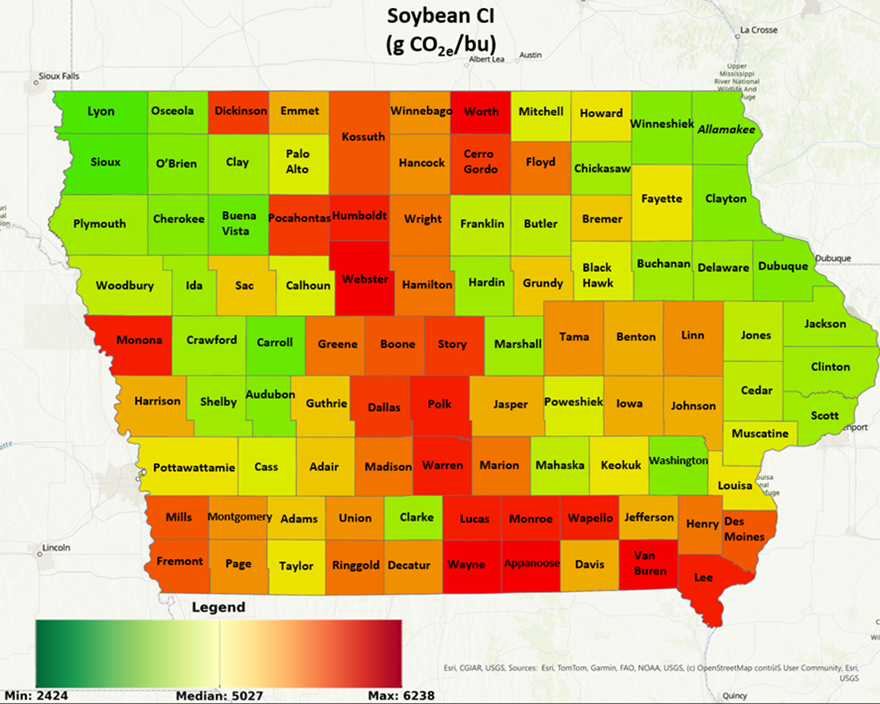
Figure 1 and Figure 2 show carbon intensity scores of corn and soybean, respectively, for all counties throughout Iowa. Green counties typically feature greater yields, greater manure volume, and more significant SOC accumulation, whereas red counties typically feature opposite trends. It is worth noting that while CI scores are calculated per bushel, corn production averages roughly 194 bushels per acre, whereas soybean averages approximately 57 bushels per acre.

Future Plans
Future analysis includes evaluating the CI scores of biofuels and animal feed produced in Iowa counties where the corn and soybean CI scores have already been assessed. Additionally, we intend on investigating the economics of implementing emission reduction strategies, considering potential yield loss and expenses of associated field activities. Also, by applying the methods of this paper to decades of historical data, we plan on analyzing how corn and soybean CI scores have evolved throughout time. Lastly, we will project future emission reduction strategy adoption and predict how CI scores of feed and fuel will change throughout the next decade.
Authors
Presenting author
Luke Soko, Graduate Student, Iowa State University
Corresponding author
Dan Andersen, Associate Professor, Iowa State University, dsa@iastate.edu
The authors are solely responsible for the content of these proceedings. The technical information does not necessarily reflect the official position of the sponsoring agencies or institutions represented by planning committee members, and inclusion and distribution herein does not constitute an endorsement of views expressed by the same. Printed materials included herein are not refereed publications. Citations should appear as follows. EXAMPLE: Authors. 2025. Title of presentation. Waste to Worth. Boise, ID. April 7-11, 2025. URL of this page. Accessed on: today’s date.