Proceedings Home | W2W Home 
Purpose
Many of the antimicrobials administered to livestock are excreted in manure where they may undergo natural breakdown, become more tightly associated with the manure and soil, or become mobilized in wastewater/runoff. Both liquid and solid manure is usually applied to nearby crop fields as a manure fertilizer, recycling the nutrients in the manure. Public concerns about the overuse of antimicrobials leading to greater antibiotic resistance and potentially greater risk for human health have led to new regulations limiting the use of antimicrobials in animal production. However, there are several significant research questions that need to be explored in order to determine how important the links are between antimicrobial use in livestock production and increased antibiotic resistance in humans.
One important issue involves how important soil processes (decomposition, nutrient transformation, and gas emissions) could be altered by antimicrobial compounds in manures and wastewater. In a previous study at a cattle feedlot in central Nebraska, we found typical antimicrobial concentrations in feedlot runoff at low part per billion (ppb) levels and were detected infrequently (<20% of the time). One exception, monensin, was usually detected with an average concentration of 87 ppb and peak concentrations above 200 ppb. Adding complexity to this issue is that soils may experience a variety of conditions ranging from fully aerobic, to denitrifying (using nitrate as a terminal electron acceptor), to anaerobic, and a diverse variety of microbes may predominate in these various conditions. How might soil functions be affected under a range of conditions experiencing differing concentrations of antibiotic? Are there clear very high concentration thresholds that completel! y inhibit specific soil functions? The purpose of this study was to determine the effects of three common livestock antibiotics at multiple concentrations on decomposition, nutrient transformation, and gas production in pasture soil under aerobic, denitrifying, and anaerobic conditions.
What did we do?
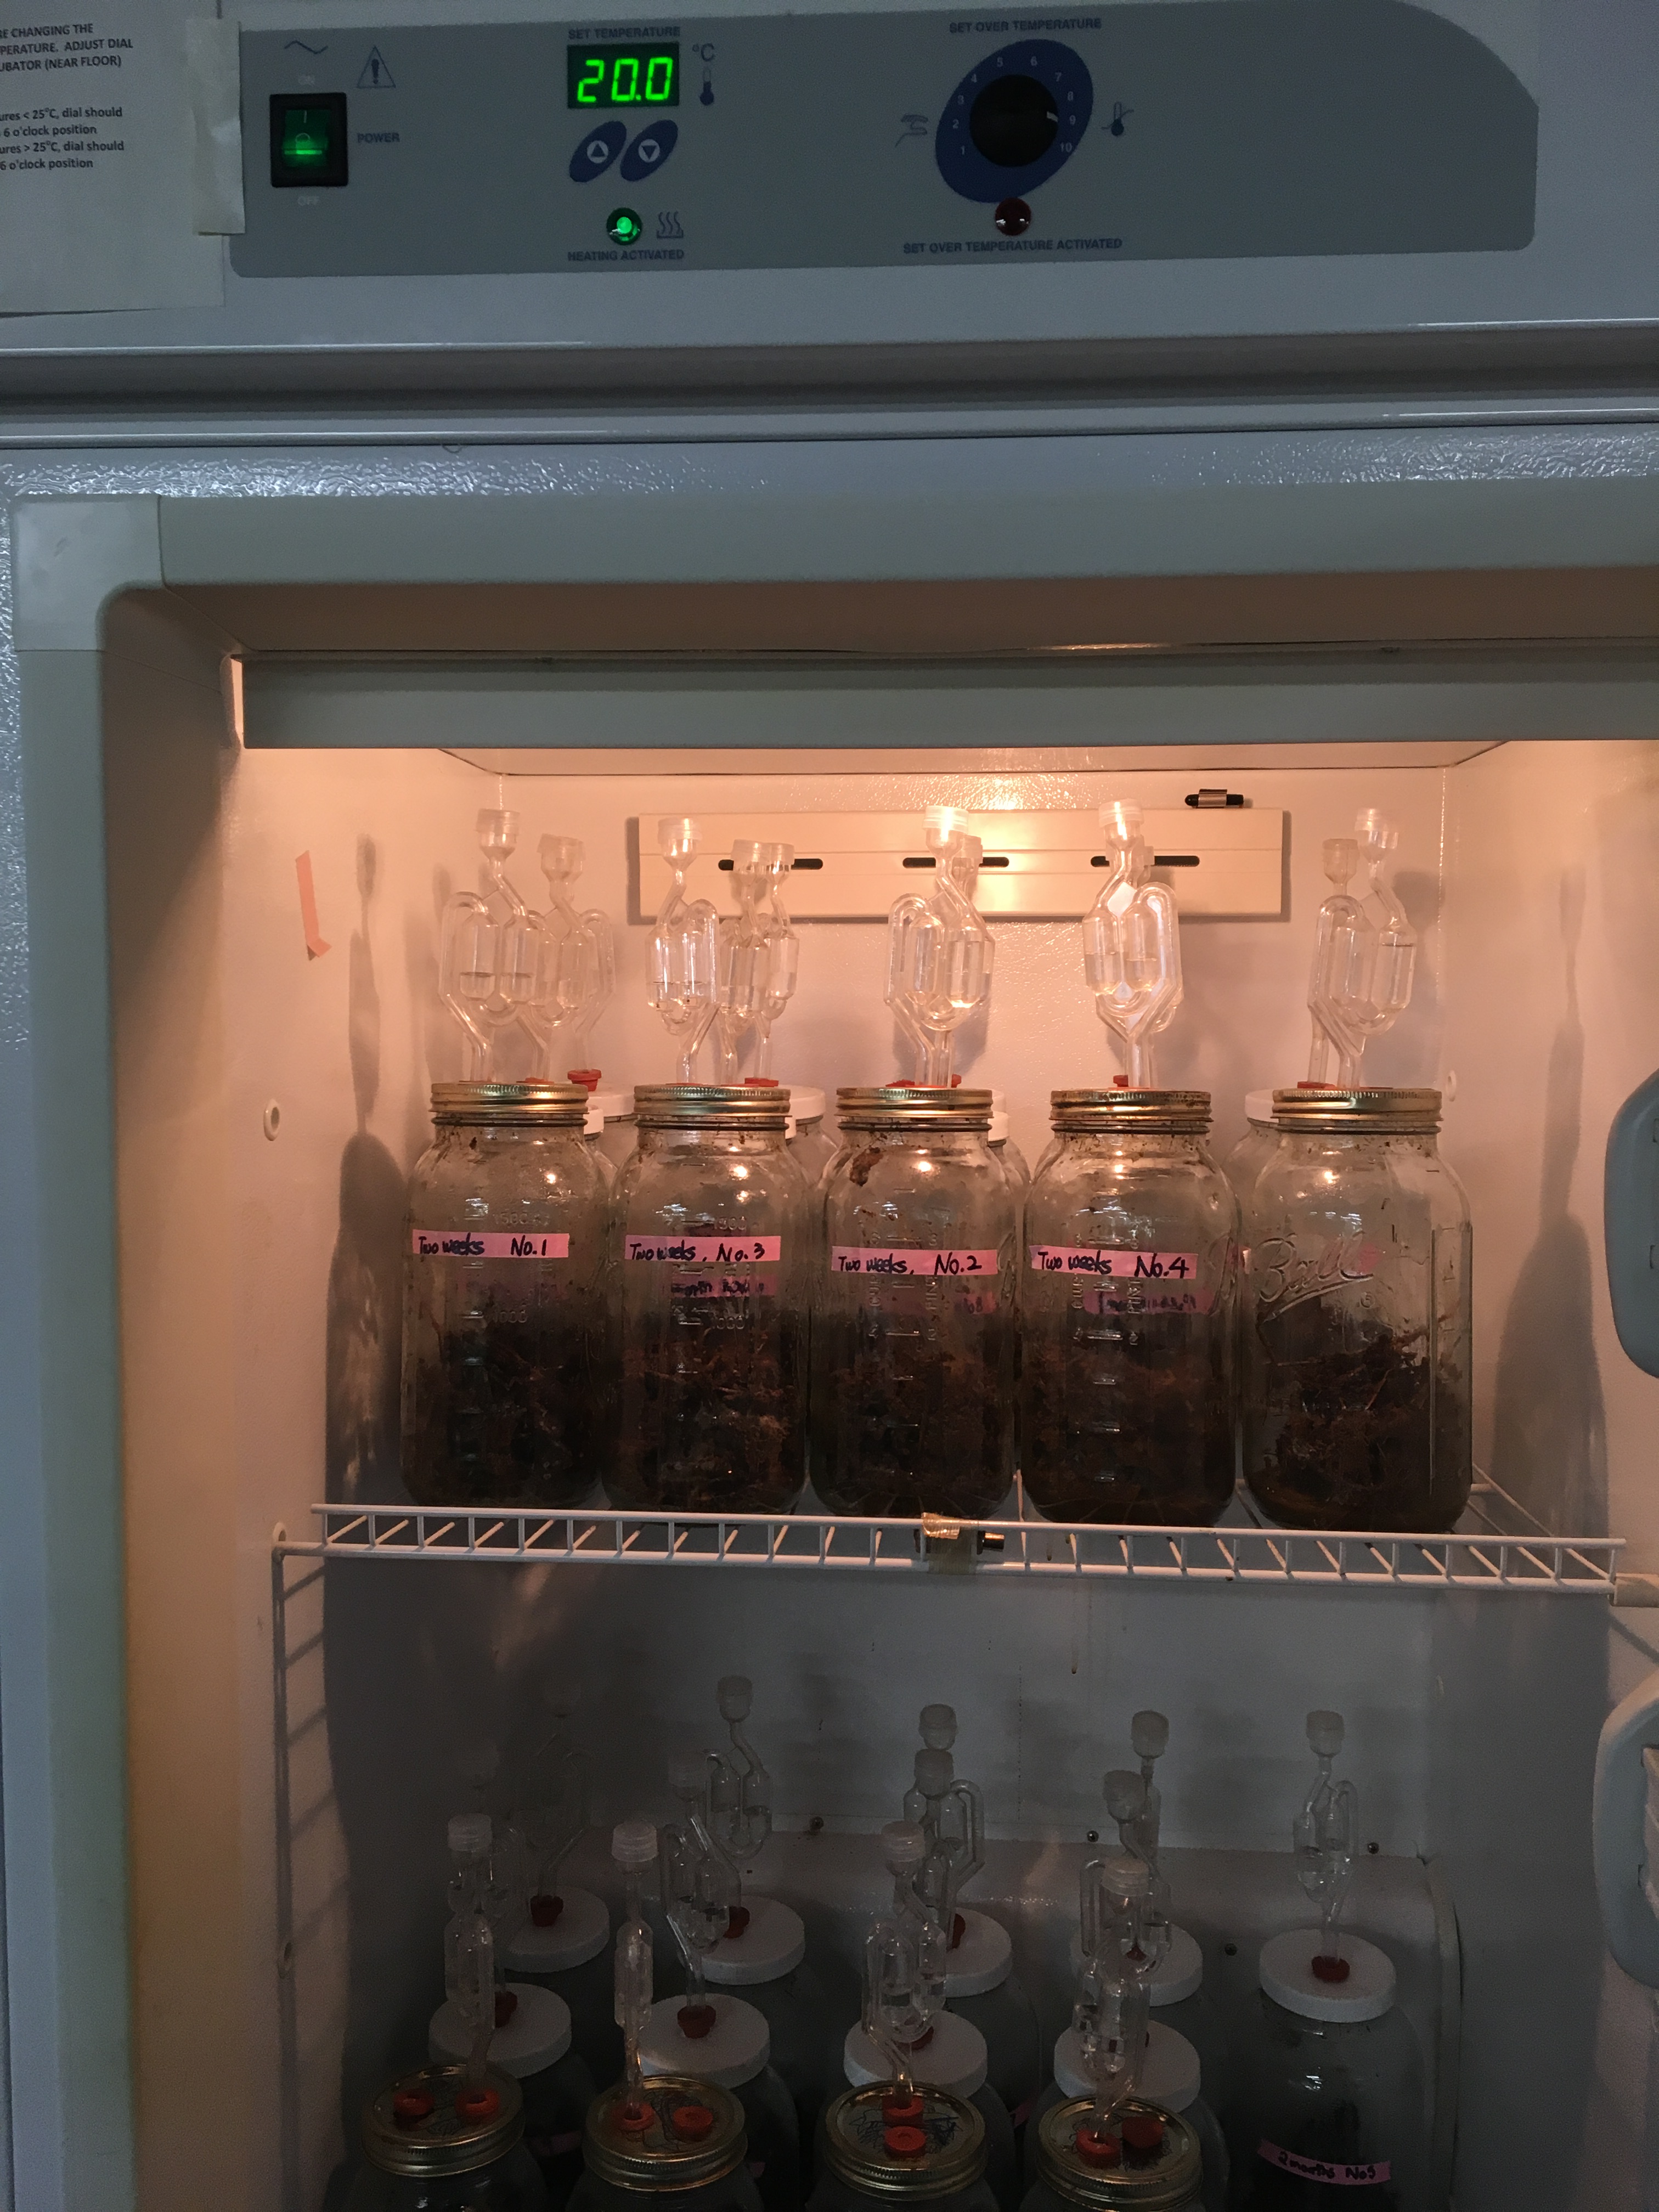
A soil slurry incubation study was conducted with pasture soil where runoff from a nearby cattle feedlot was occasionally applied. Monensin, sulfamethazine, and lincomycin were amended (0, 5, 500, and 5000 ppb) to mason jars and serum bottles containing soil and simulated cattle feedlot runoff. The mason jars were flushed with air (aerobic) while serum bottles were flushed with nitrogen gas (anaerobic). Denitrifying conditions were established initially in a subset of anaerobic serum bottles which were supplemented with nitrate (100 mg NO3-N L-1). All antimicrobial amendments and conditions were replicated in triplicate and incubated at 20°C. Headspace gas composition and decomposition products were both measured using gas chromatography and monitored over several weeks.
What have we learned?
Soil processes were generally affected only at the highest antibiotic concentrations, which are 10x greater than observed levels in feedlot runoff. Furthermore, the effects on soil processes depended upon the antibiotic tested (Table 1). Monensin, a broad-range antimicrobial, had the greatest effect on a number of processes. At highest monensin concentrations tested (5000 ppb), both aerobic and anaerobic decomposition (including denitrification) were affected as shown by greater VFA concentrations and low to no gas production (CO2, N2O, and CH4). Even at 500 ppb, monensin had some effect—CO2, N2O, and CH4 gas production were reduced. Sulfamethazine at 5000 ppb inhibited full denitrification (no N2O produced), but there was no effect on other gases or VFA. At 500 ppb sulfamethazine, N2O production was reduced by half. Lincomycin’s only observable effect was lower (0.5x) N2O production at the 5000 ppb level under denitrification conditions.
These results show important soil processes can be blocked by high levels of antibiotics found in animal manures, but inhibition depends upon the antibiotic. A general antimicrobial like monensin affected microbial processes far more than antimicrobials with a specific mode of action. The highest antibiotic levels evaluated were 5 to 10 times higher than levels found in animal manures, so soils are likely not impacted under normal conditions where manures mixed and distributed into soils. Antibiotic breakdown in the soil further helps reduce the potential for antibiotics to build up in the soils.
Future Plans
These incubations only assessed the effect of a one-time dose of antimicrobials. Future studies will examine how longer soil exposures affect soil processes. Additional studies will also compare how soils that have different manure exposure histories (cattle feedlot soil with heavy exposure versus protected prairie soils with very low manure exposure) would react to higher levels of antimicrobials.
Corresponding author, title, and affiliation
Dan Miller, Microbiologist, USDA-ARS
Corresponding author email
Other authors
Matteo D’Alessio, Postdoctoral Researcher, Nebraska Water Center; Dan Snow, Director of Services, Water Sciences Laboratory
Additional information
151 Filley Hall, UNL East Campus, Lincoln, NE 68583
Ph: 402-472-0741
https://dl.sciencesocieties.org/publications/csa/pdfs/61/8/4?search-result=1
The authors are solely responsible for the content of these proceedings. The technical information does not necessarily reflect the official position of the sponsoring agencies or institutions represented by planning committee members, and inclusion and distribution herein does not constitute an endorsement of views expressed by the same. Printed materials included herein are not refereed publications. Citations should appear as follows. EXAMPLE: Authors. 2017. Title of presentation. Waste to Worth: Spreading Science and Solutions. Cary, NC. April 18-21, 2017. URL of this page. Accessed on: today’s date.
 The paired watershed experimental approach used in this project, required simultaneous monitoring of two watersheds (treatment and control), during a calibration and a treatment period. The calibration period was from 12/30/07 to 10/5/11 and the treatment period was from 10/6/11 to 12/18/15. During both periods, the rainfall and quantity and quality of discharge were monitored continuously. Land use information (number of cattle, fertilization, soil test results) was collected at least annually. The treatment watershed (Past-treat) encompassed 54.5 ha all but 7.3 ha of which was used for beef cow pasture. The control watershed (Past-cont) encompassed 78.1 ha 39.5 ha of which was pasture, while most of the remainder (27.5 ha) was wooded.
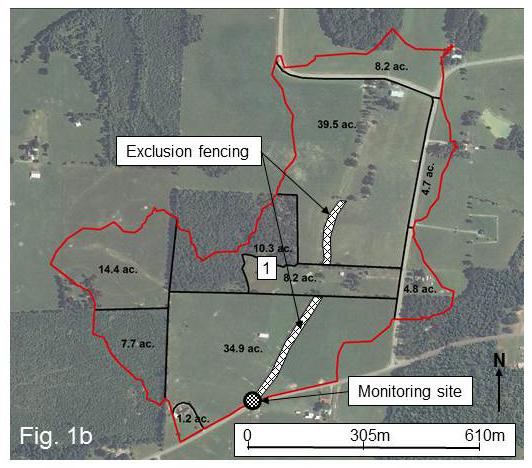 Statistical analyses of storm event load data documented that during the post-fencing period, mass loading of TKN (34%), NH3-N (54%), TN (33%), TP (47%), and TSS (60%) was reduced significantly in the treatment relative to the control watershed, while storm discharge and NOx-N loads were not significantly different. These data showed that even a relatively narrow exclusion corridor implemented on only the main stream channel can significantly reduce the export of nitrogen, phosphorus, and sediment from a beef cattle pasture.
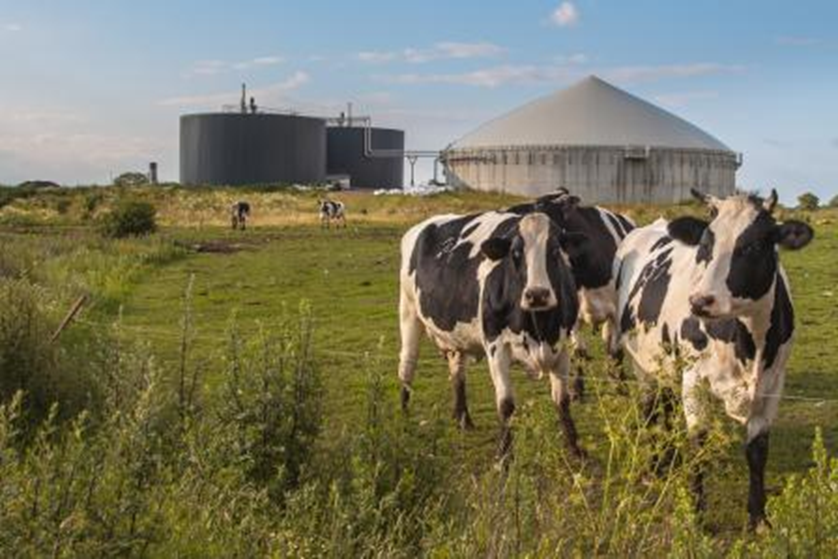


 Agricultural Library. Results show that the greatest levels of methane produced on a farm come from enteric emissions of the cow and changes in the diet, digestion and genetics of the cow can reduce those emissions. Another significant source of methane—manure production, storage and management—can be substantially reduced through manure management practices, particularly when it is processed through an anaerobic digester. Changes in timing of nitrogen application and use of cover crops practices are found to improve nitrogen efficiency and reduce losses from the field.