
Aerial photos of farms and farming practices are becoming easier to find and collect. But drones and satellites can provide more than pretty pictures. In this webinar, the three speakers will share applications of drones and remote sensing for air and water quality measures around livestock farms. Dirk Charlson will share his simple approach to collecting drone imagery, and the range of opportunities for analyzing images and mapping practices. Nesli Akdeniz has collected air quality measures in pasture systems with drones. Finally, Becca Muenich has used remote sensing to examine land application practices. While it may seem like these applications are flying by faster than we can see, the speakers will help ground us with their experience. This presentation was originally broadcast on December 12, 2025. Continue reading “A view from above – application of drones and remote sensing for air and water quality measures around livestock farms”
A USDA multi-location project monitoring ammonia deposition near animal production sites
Animals excrete a lot of nitrogen as they grow with a large fraction escaping into the air as ammonia. What happens to that ammonia, and can we predict how that excess nitrogen might be beneficial to nearby crop production? This webinar will present pilot-scale research for manure and food waste treatment. This presentation was originally broadcast on May 16, 2025. Continue reading “A USDA multi-location project monitoring ammonia deposition near animal production sites”
Use of Orchard Debris for Vermifiltration: Advancing Regenerative Agriculture and Wastewater Treatment
Purpose
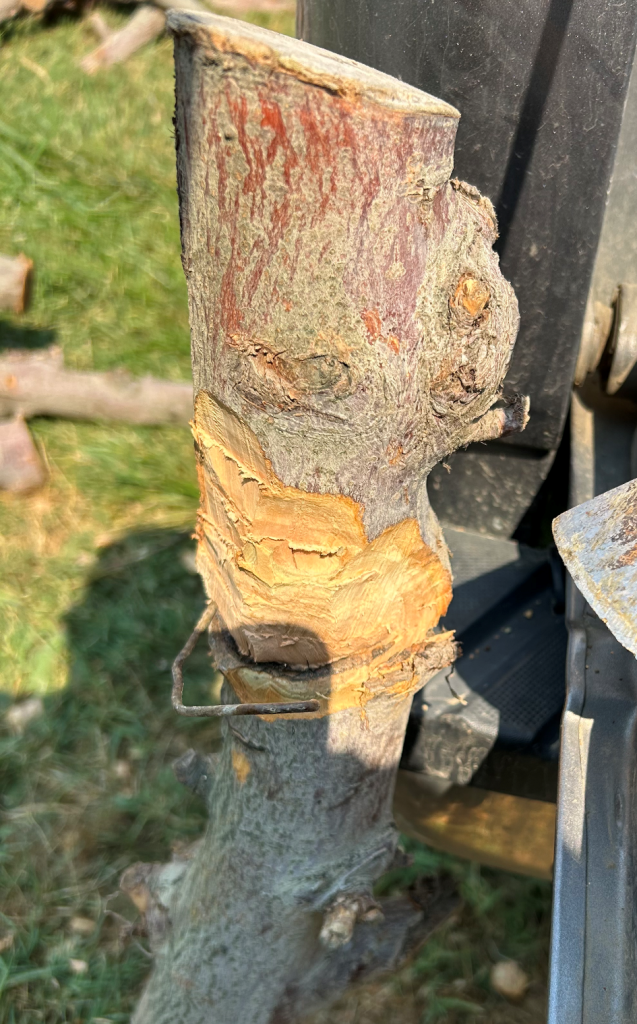
This study assesses the economic and air quality benefits of using chipped apple orchard wood as a carbon source in a vermifiltration wastewater system. Instead of burning orchard debris, which releases harmful pollutants, the Perca system repurposes it as a substrate for earthworm-microbial wastewater treatment. The study also compares apple wood chips to traditional conifer chips, evaluating their effectiveness and the broader environmental and economic advantages of diverting orchard waste.
What Did We Do?
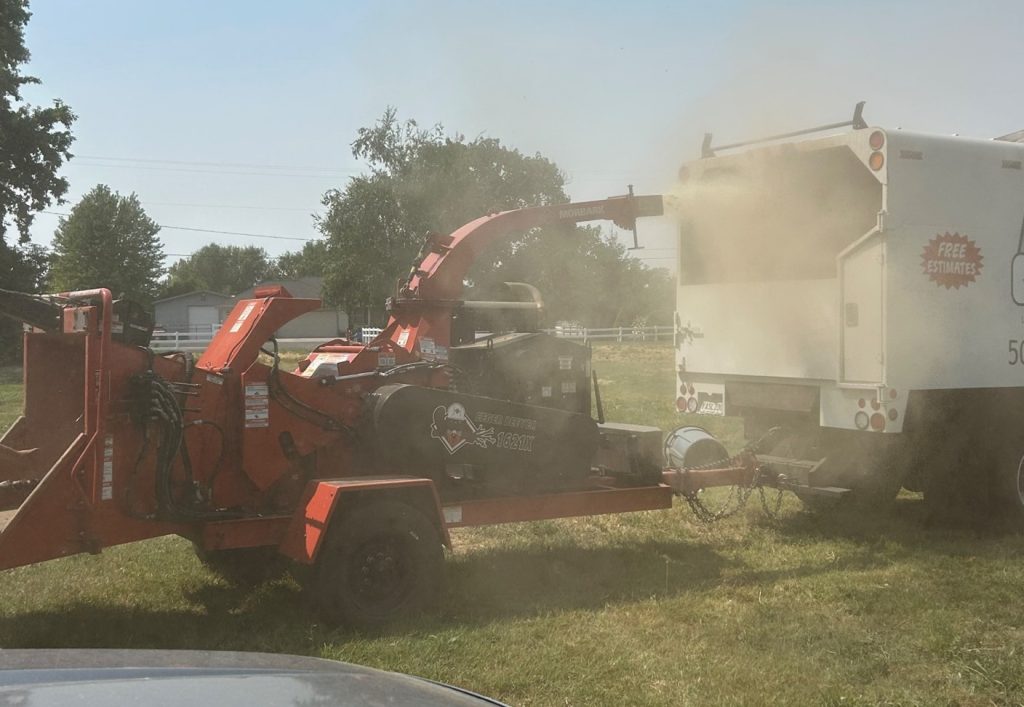
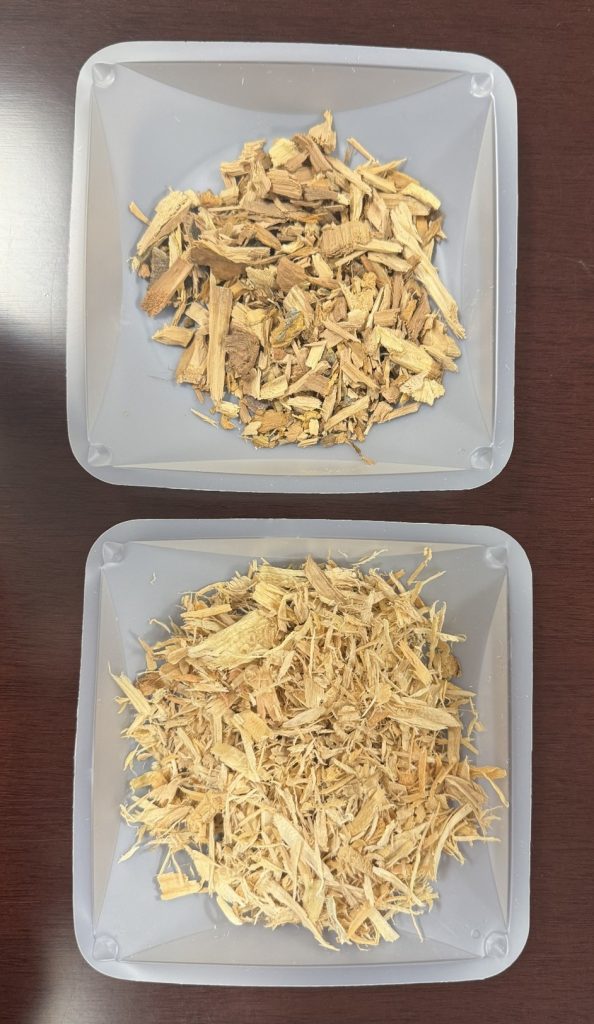
Apple orchard tear-out debris from a local orchard was collected, chipped, and transported for installation as a substrate for the Perca vermifiltration system. Debris was screened to remove foreign materials, chipped to less than ½ inch size, and weighed to calculate tons of usable wood per ton of orchard debris. Data from processing, including chipping costs and labor requirements, were used to assess economic feasibility and air quality impact. In addition, a bench-scale test was conducted to evaluate the efficacy of wastewater treatment by apple orchard chips when compared to the standard conifer chips used in the Perca vermifiltration system. Removal efficiencies of total suspended solids (TSS), biological oxygen demand (BOD), and polychlorinated biphenyls (PCBs) were measured for both substrates.
Market projections for Perca’s vermifiltration system show a compound annual growth rate (CAGR) of 113.45%, reaching 9.57% of the market over the next five years. Calculated market projection estimates over 16,000 tons of orchard debris could be converted into a value-added substrate product rather than burning. This shift could eliminate more than 500 tons of emissions between 2025 and 2029. Economic analysis shows that while chipping costs and wood size restrictions pose challenges for trellised orchards, non-trellised orchards offer better yields and lower costs, with market trends and technology advancements pointing toward broader economic feasibility. Bench-scale tests showed that both apple wood and conifer substrates effectively reduced TSS, BOD, and PCBs by more than 80% in all categories with no significant difference in performance, confirming apple debris works as well as conifer media. These findings demonstrate that apple orchard debris provides an environmentally sustainable alternative to burning, thus contributing to improved air quality, while also an efficient, cost-effective vermifiltration substrate for wastewater treatment.

Future Plans
Ongoing efforts focus on refining the use of apple orchard debris to create a cost-effective, reliable wood chip that matches or exceeds current substrates in reducing conventional and nonconventional wastewater pollutants, while offering an economic alternative to burning. Additionally, strategies are being developed to integrate vermifiltration into regenerative agriculture and circular bioeconomy practices by repurposing spent substrate as a nutrient-rich soil amendment or for soil remediation. This approach transforms agricultural waste into multiple value-added resources, supporting both environmental sustainability and economic viability through continued innovation, collaboration, and stakeholder engagement.
Authors
Presenting & Corresponding author
Sierra J. Smith, Director of Research and Development, Perca, Inc., sierrasmith@perca.net
Additional authors
Joseph S. Neibergs, Professor Extension Economist and Director Western Center for Risk Management Education, Washington State University
George A. Damoff, Chief Science Officer, Perca, Inc.
David A. Elmenhurst, Chief Financial Officer, Perca, Inc.
Additional Information
perca.net
https://ecology.wa.gov/about-us/accountability-transparency/partnerships-committees/boards-councils/agricultural-burning-research-task-force
Acknowledgements
Washington State Department of Ecology for funding and support
Washington State Agricultural Burning Practices & Research Task Force, under direction of the Department of Ecology, for funding and support
The authors are solely responsible for the content of these proceedings. The technical information does not necessarily reflect the official position of the sponsoring agencies or institutions represented by planning committee members, and inclusion and distribution herein does not constitute an endorsement of views expressed by the same. Printed materials included herein are not refereed publications. Citations should appear as follows. EXAMPLE: Authors. 2025. Title of presentation. Waste to Worth. Boise, ID. April 7–11, 2025. URL of this page. Accessed on: today’s date.
Animal Feeding Operations Air Emission Estimation Methods
To be sustainable, producers need to conserve energy while still maintaining or improving their facilities and the lives of the animals they house. This presentation was originally broadcast on January 19, 2024. Continue reading “Animal Feeding Operations Air Emission Estimation Methods”
Improving Air Quality In and Around Livestock Facilities
Air quality in and around barns can negatively impact animal and worker welfare. This webinar will discuss ways to overcome these challenges. This presentation originally broadcast on April 21, 2023. Continue reading “Improving Air Quality In and Around Livestock Facilities”
Impact of sampling timing on measured gas concentrations and emissions at a commercial laying hen house
Purpose
Ammonia and carbon dioxide are two major air pollutants at commercial laying hen houses. Ammonia models are widely used to estimate emissions from individual farms, a region, a country, or the world and assess their potential environmental and ecological impacts. Carbon dioxide models have been used to estimate ventilation rates based on mass balance. Reliable models must be developed based on measurement data from field conditions. However, concentrations and emissions of these two gases vary temporally in layer houses and can affect accuracies of measurement data and emission models. Accuracies of the measurement results are largely affected by instruments and methodologies, which includes sampling timing, i.e., number of samples per day (NSPD) and sampling starting time. The purpose of this study is to demonstrate the impact of measurement timing on ammonia and carbon dioxide concentrations and emissions.
What Did We Do?
A dataset of measured gas concentrations and emissions at a commercial laying hen farm was selected and used as a reference. It contains 5 days of continuous measurement data that were saved every minute. Different sampling timing scenarios were selected based on a literature survey and were applied in a computer simulation. Absolute differences in percentage between the simulation results and the reference were used to assess the effects of sampling timing.
Two sampling timing scenarios were used in this study: (a). sampling at eight different NSPD, i.e., 144, 48, 24, 12, 9, 3, 2, and 1 compared with the continues measurement of 1440 NSPD with equal sampling intervals and the first sampling starting at 8:00 AM; and (b). sampling for the same eight NSPD and equal sampling intervals, but with the first sampling starting at six different times within the respective sampling intervals, including 8:00 AM, compared with the data of 1440 NSPD. For example, when the NSPD was 2, the six starting times were selected at 8:00 AM, 10:00 AM, noon, 2:00 PM, 4:00 PM, and 6:00 PM.
What Have We Learned?
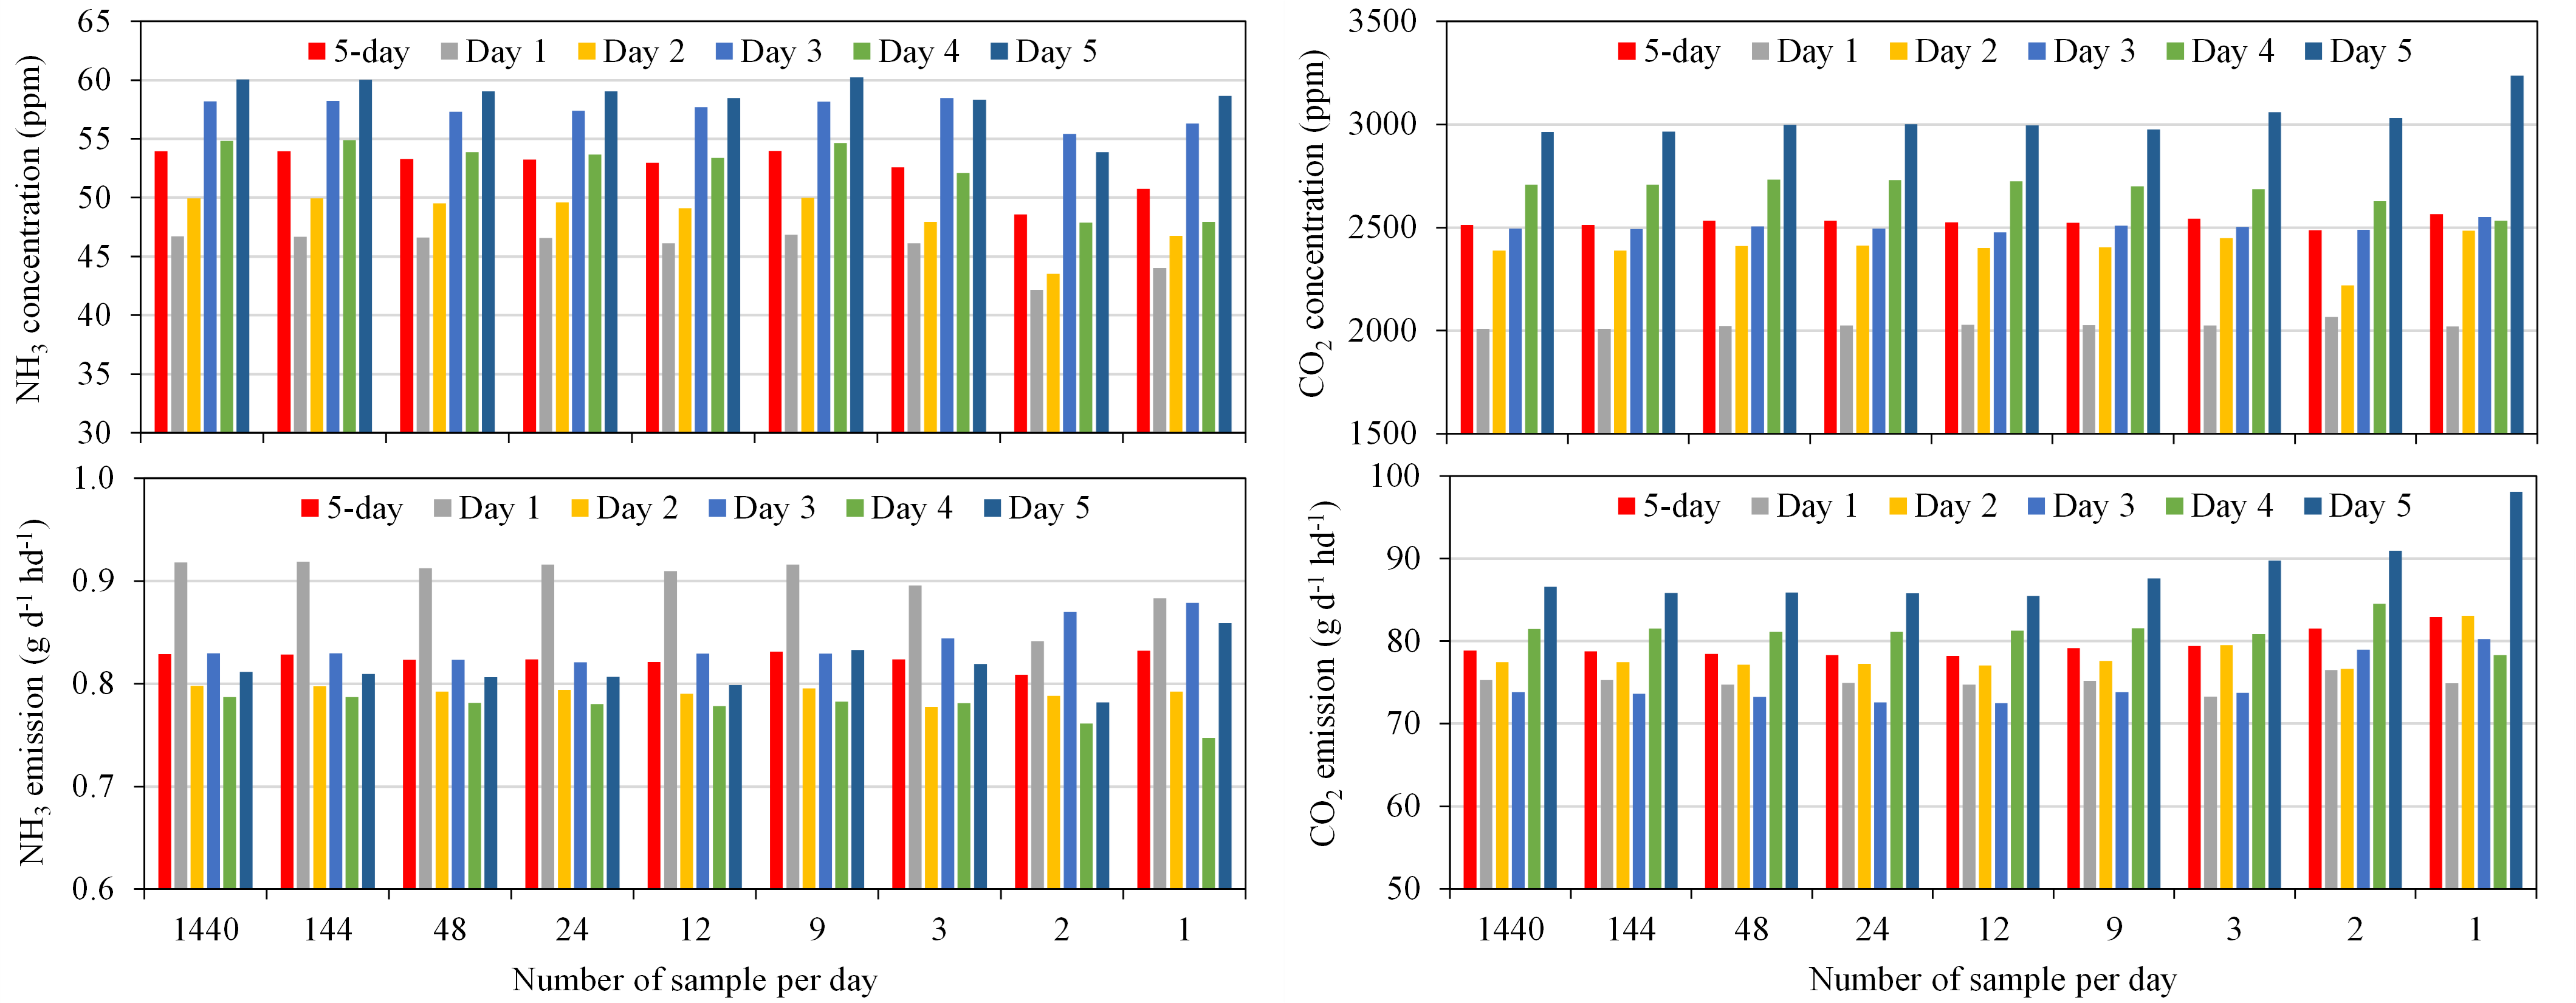
Results demonstrated that, for scenario (a) of the 5 days sampling and measurement (Figure 1), the absolute differences: 1. ranged from 0.02 % (carbon dioxide concentration at 144 NSPD) to 10.04% (Ammonia concentrations at 2 NSPD); 2. was 3.96% for ammonia emissions at 2 NSPD and 6.48% for carbon dioxide emissions at 1 NSPD, both were the largest emission differences; 3. were generally larger in ammonia concentrations than ammonia emissions, but smaller in carbon dioxide concentrations than carbon dioxide emissions; and 4. were generally larger with fewer NSPD for all the four measurement results (ammonia and carbon dioxide concentrations and emissions).
Scenario (b) simulation revealed a new finding that sampling starting times had large impacts on data accuracies as well (Figure 2). The absolute differences 1. ranged from 0.00 % (for both ammonia and carbon dioxide concentrations at 144 NSPD) to 12.92% (ammonia concentrations at 2 NSPD); and 2. was 7.43% for ammonia emissions at 1 NSPD and 7.60% for carbon dioxide emissions at 2 NSPD, both were the largest emission differences. Additionally, scenario (b) demonstrated the same effects as points 3 and 4 in scenario (a).

Future Plans
More research on the effects of sampling timing on gas concentration and emission measurements will be conducted using datasets of longer-term field measurement (> 1 year) with other sampling scenarios based on the literature survey.
Author
Ji-Qin Ni, Professor, Agricultural and Biological Engineering, Purdue University
Corresponding author email address
Additional Information
Wang-Li, L., Q.-F. Li, L. Chai, E. L. Cortus, K. Wang, I. Kilic, B. W. Bogan, J.-Q. Ni, and A. J. Heber. 2013. The National Air Emissions Monitoring Study’s southeast layer site: Part III. Ammonia concentrations and emissions. Transactions of the ASABE. 56(3): 1185-1197.
Ni, J.-Q., S. Liu, C. A. Diehl, T.-T. Lim, B. W. Bogan, L. Chen, L. Chai, K. Wang, and A. J. Heber. 2017. Emission factors and characteristics of ammonia, hydrogen sulfide, carbon dioxide, and particulate matter at two high-rise layer hen houses. Atmospheric Environment. 154: 260-273.
Tong, X., L. Zhao, R. B. Manuzon, M. J. Darr, R. M. Knight, A. J. Heber, and J.-Q. Ni. 2021. Ammonia concentrations and emissions at two commercial manure-belt layer houses with mixed tunnel and cross ventilation. Transactions of ASABE. 64(6): 2073-2087.
Acknowledgements
This work was supported by the USDA National Institute of Food and Agriculture Hatch project 7000907.
The authors are solely responsible for the content of these proceedings. The technical information does not necessarily reflect the official position of the sponsoring agencies or institutions represented by planning committee members, and inclusion and distribution herein does not constitute an endorsement of views expressed by the same. Printed materials included herein are not refereed publications. Citations should appear as follows. EXAMPLE: Authors. 2022. Title of presentation. Waste to Worth. Oregon, OH. April 18-22, 2022. URL of this page. Accessed on: today’s date.
Air Quality Issues at Livestock Facilities
Abstract
Confinement and concentration of livestock and poultry production decades ago exacerbated nuisance and health effects caused by emissions of odor, particulate matter (dust) and gases from animal manure. Concern about health effects on animals and farm workers are due to potential exposure to high concentrations of various noxious gases and particulate matter. People downwind of production facilities and land application of manure are concerned about both nuisance odor and health effects, resulting in lawsuits, community protests, government regulations, and state and federal consent decrees and agreements. Besides the chronic issue of odor, livestock production’s emissions of ammonia, hydrogen sulfide, volatile organic compounds, greenhouse gases, and bioaerosols have also created potential problems depending on livestock species, site location, and facility design, and management. Major technical air quality issues facing livestock producers are: 1) obtaining suitable sites for new facilities, 2) selecting effective and practical mitigation methods, if necessary, 3) obtaining reliable and economical on-farm measurements of pollutant concentrations and emissions, 4) estimating pollutant emission rates at their farms, and 5) managing manure to minimize impacts of pollutant emissions.
The authors are solely responsible for the content of these proceedings. The technical information does not necessarily reflect the official position of the sponsoring agencies or institutions represented by planning committee members, and inclusion and distribution herein does not constitute an endorsement of views expressed by the same. Printed materials included herein are not refereed publications. Citations should appear as follows. EXAMPLE: Authors. 2022. Title of presentation. Waste to Worth. Oregon, OH. April 18-22, 2022. URL of this page. Accessed on: today’s date.
Recent Research Efforts to Reduce Greenhouse Gas Emissions
This webinar discusses research projects focused on reducing greenhouse gases, odorous volatile organic compounds (VOCs), ammonia, and hydrogen sulfide. This presentation was originally broadcast on June 21, 2019. More… Continue reading “Recent Research Efforts to Reduce Greenhouse Gas Emissions”
Development of a Livestock Siting Assessment Matrix
Growth in the livestock and poultry industries in Nebraska faces hurdles is greatly influenced by county zoning and local decision-making. Variation in policies from one county to the next and in decisions made by county boards creates significant challenges for agricultural operations and for local communities looking to remain vibrant and grow. Many were requesting that a common tool be developed for county officials to use that would bring greater consistency and objectivity to the evaluation of proposals to expand animal feeding operations.
What was done?
In 2015, the Nebraska Legislature passed legislation (LB106) that directed the Nebraska Department of Agriculture to convene a committee of experts to develop an assessment matrix for livestock development. A 10-person advisory committee, including county officials, livestock industry representatives, and me [representing the University of Nebraska] was approved by Governor Ricketts later that year. In keeping with directions outlined in Nebraska LB106, the committee:
- Reviewed tools already developed by counties in Nebraska and by other states, mainly those used in Iowa and Wisconsin.
- Developed a tool (Excel spreadsheet or pdf) that produces quantifiable results based upon scoring of objective criteria;
- Made concerted efforts to assure that the tool is practical to use when applying for conditional-use permits or special exceptions and when county officials score these applications; and
- Ensured that all criteria had definite point selections and provided a minimum threshold total score that is required to ‘pass’.
In 2016, the resulting Nebraska Livestock Siting Assessment Matrix (‘Livestock Matrix’) was posted for comments and approved for dissemination by the Nebraska Department of Agriculture. The Livestock Matrix was recently reviewed and updated by the advisory committee, and the current version is available for public access at http://www.nda.nebraska.gov/promotion/livestock_matrix/index.html.
What we have learned?
Development of the Livestock Matrix was a highly formative process. Overall, the factors that consumed the vast majority of discussion and effort involved the following:
- Need for simplicity. Strong sentiments were expressed that the Livestock Matrix should be easy to complete, with little or no need for assembling additional information or consultation.
- Desire for transparency. Clarity was paramount, with parties on both sides expecting to see numbers and requirements specified up front, which excluded process-based approaches.
- Questions of merit. Many ‘generally good ideas’ and recommendations were removed when benefits were not well understood or defined, or a practice was considered an industry norm.
- Will to retain control. Perceived loss of control or potential for new regulation ended discussion of some ideas that otherwise had merit.
Voluntary tool:
LB106 specified that the matrix be “Designed to promote the growth and viability of animal agriculture in this state”, and as a result, the advisory committee was comprised of supporters of [responsible growth of] the livestock and poultry industries. Support for local control runs deep in Nebraska, though, and one of the most significant hurdles arose early on due to amended language in the final bill, “…develop an assessment matrix which may be used by county officials to determine whether to approve or disapprove” applications. Voluntary consideration and adoption of the Livestock Matrix at local levels totally changed the nature of the discussions, and made it very challenging to develop a single tool that would have widespread appeal and rate of adoption, virtually guaranteeing that varied policies and practices would still exist. Despite this challenge, the matrix committee pushed through to develop a ‘template tool’, which has been adopted – either as is or as a template – by some counties.
County setbacks:
The next major hurdle faced was how to handle county setback distances. With the Livestock Matrix being voluntary, it quickly became clear that county officials were not going to adopt a tool that limited their use of and control over setback distance requirements. After mulling over options, the committee decided that satisfying the county’s setback requirement would be the primary criterion for obtaining 30 of the 75 points needed to receive a passing score. To promote positive change, the committee developed sets of sliding-scale ‘base separation distances for odor’ using an approach that drew from the science-based Nebraska Odor Footprint Tool (NOFT). The intent was that county officials would use these distances [preferably] in establishing county setbacks or as an alternative approach that could be accepted by a county. Direct use of the NOFT and inherent NOFT concepts within the Livestock Matrix was greatly limited by concerns over the NOFT requiring additional work of applicants, not being sufficiently transparent, and not being applicable for all applicants (esp. open-lot cattle feeders).
The idea of using ‘transitional planning zones’ that add or deduct points based upon consideration of locations of all residents within 1.5 times the separation distance for odor is presented in the alternative approach (Figure 1).
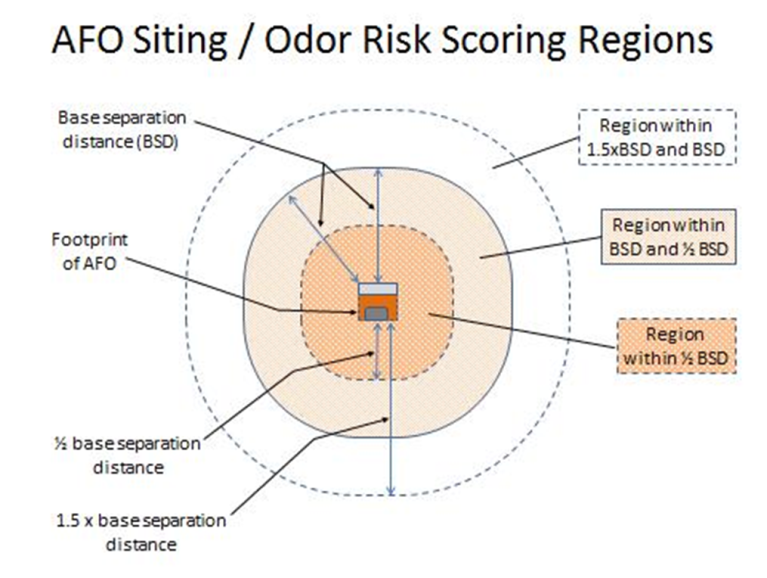
The intent was to bring more information into decisions than just what is the distance to the closest neighbor relative to the county setback. The zones are mainly presented for information purposes, as there was considerable hesitance to adopt a scoring system that was not considered sufficiently simple and transparent to merit replacing a set separation distance being the criterion.
Water quality / permits:
Committee members shared the view that a proposed expansion that would secure required environmental permits (via Nebraska Department of Environmental Quality, NDEQ) and meet the county’s setback requirement, if any, should generally earn a passing score and not be exposed to local requirements that are often employed to delay and deter operations from expanding. There was disagreement, however, on whether an applicant should need to complete the rest of the assessment if these two conditions were met. This issue weighed the applicant’s time and effort completing the assessment against the potential that glaring concerns (point deductions) may arise in another area and that communities may not see the matrix as being comprehensive and credible. The current matrix conveys an expectation that all main sections be scored, but has been streamlined to minimize required time and effort.
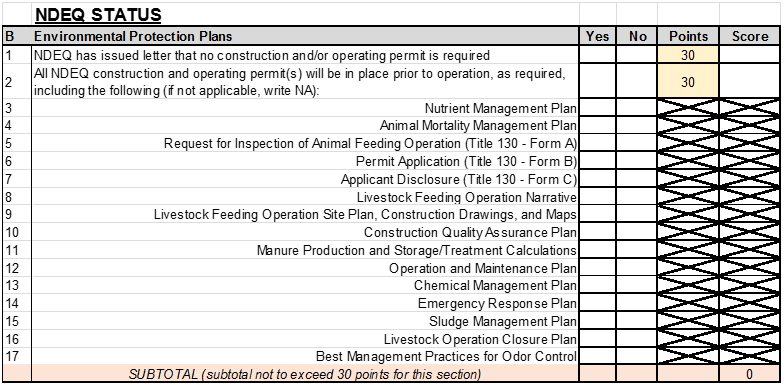
There were also differing views on whether the Livestock Matrix should highlight the various water quality protections that would be put in place or simply that NDEQ requirements would be satisfied. While there was significant early interest by several committee members to promote and educate the public on stewardship practices required of permitted feeding operations, the desire to reinforce the value of determinations made by NDEQ and to keep the tool very practical to complete and assess carried in the end. As a result, applicants must indicate that NDEQ approval has been or will be secured to obtain 30 of the 75 points needed to receive a passing score (Figure 2), while indication of the practices that will be implemented is encouraged, but does not affect the score received.
This section of the Livestock Matrix arose was discussed again as the committee considered those applicants who would receive a letter from NDEQ stating that a permit would not be required – primarily applicable to small animal feeding operations and operations that involved dry manure. The challenge presented was, ‘Does having official approval to go forward without needing a permit offer the same protections and merit the same points as would exist if required plans were developed to secure permits?’ The issue became prominent when a broiler processing facility was approved for construction, which required constructing hundreds of new broiler (chicken) houses in the state, none of which would likely require an NDEQ permit. The main concern was that such facilities could be approved without having nutrient management plans (and a few other desired plans) in place to limit potential nutrient loading of ground and surface waters from application of manure at rates exceeding crop needs. The company associated with the current large poultry expansion took a proactive stance and internally requires all of its growers to have nutrient management plans in place and qualify for an NDEQ permit, resolving the immediate concerns, but not the longer-term issue with the Livestock Matrix. The committee will continue to examine ways to better highlight and reinforce the importance of nutrient management within the Livestock Matrix without suggesting changes in NDEQ regulation.
Other environmental sections:
Six more sections address various environmental risks and protections, including:
- Environmental and zoning compliance record
- Water quality protection – livestock facilities
- Odor and dust control for facilities
- Manure application practices
- Manure application separation
- Additional assurance of environmental protection
Each of these sections was refined down to a list of items that the committee believed merited inclusion in determining the total score.
Non-environmental sections:
Additional sections address other topics such as:
- Traffic
- Locations of the authorized representative and the site manager relative to the facility
- Communication with the community
- Economic impact
- Landscaping and aesthetics
Each of these areas was well-understood to influence acceptance by the community. Probably the biggest challenge for the committee was assigning appropriate section scores and total passing scores to value the importance of these areas without suggesting that an environmentally risky application could achieve a passing score through strong scores in these other areas.
Impacts and Implications
In developing the Nebraska Livestock Siting Assessment Matrix, the committee made available a well-critiqued tool for voluntary consideration by county officials. Overall, the Livestock Matrix strikes a sometimes uncomfortable balance between being comprehensive and scientifically correct and being transparent and easy to use. Although the Livestock Matrix will likely fall short of the original goal of achieving consistency and uniformity in Nebraska’s county zoning policies and practices, county officials are considering the matrix as a template zoning tool or as a gauge for evaluating and adjusting current policy.
Next Steps
The Nebraska Department of Agriculture is continuing to promote adoption of the Nebraska Livestock Siting Assessment Matrix, especially to counties looking to be officially designated as “Livestock Friendly”. The matrix will be evaluated again in 1-2 years.
Authors
Richard R. (Rick) Stowell, Extension Specialist – Animal Environment, Rick.Stowell@unl.edu
Additional Information
For more information on the Nebraska Odor Footprint Tool, visit https://water.unl.edu/manure/odor-footprint-tool.
Acknowledgements
The other members serving on the committee included: John Csukker; Elizabeth Doerr, Leon Kolbet, Dean Krueger, Mark McHargue, Jennifer Myers, Sarah Pillen, Andrew Scholting, Steve Sill.
The authors are solely responsible for the content of these proceedings. The technical information does not necessarily reflect the official position of the sponsoring agencies or institutions represented by planning committee members, and inclusion and distribution herein does not constitute an endorsement of views expressed by the same. Printed materials included herein are not refereed publications. Citations should appear as follows. EXAMPLE: Authors. 2019. Title of presentation. Waste to Worth. Minneapolis, MN. April 22-26, 2019. URL of this page. Accessed on: today’s date.
Aeration for Elimination of Manure Odor and Manure Runoff: What One Professional Engineer Has Learned in the Past 12 Years
Aerobic treatment has potential to be more practical for any size operation, reduce odors, reduce risk of runoff by facilitating application to growing crops, and reduce energy use when distributing manure nutrients.
Farm-based aeration, created through an upward/outward surface flow, was first introduced in the 1970’s and brought partial success. With significant performance issues, challenges with struvite within manure recycling pipes/pumps, and the growing trend to store manure within pits under barns, further research with manure aeration was largely abandoned. Very little research has been done on aerobic treatment within manure storage systems since traditional aeration using air blowers has been considered too expensive. Previous research sought to mimic traditional domestic wastewater treatment systems which also purposely perform denitrification. Not always a goal for farm operations in years past, retaining Nitrogen within wastes used as fertilizer is now usually a goal. Thus, past aerobic treatment systems were not designed to fully benefit today’s modern farms.
In 2006, hog producers were introduced to an updated version of equipment providing Widespreading Induced Surface Exchange (WISE) aeration, specifically for reducing hog manure odor while irrigating lagoon effluent. The results became a “wonder” for the site’s CAFO permit engineer. Documentation showed that significant aeration was occurring at a rate much higher than could occur with the energy input used by traditional bubble blowers. This indicated that aeration of manure ponds and lagoons may not be too expensive after all. More questions led to a USDA NRCS-supported study, which revealed much more information and brought out more questions. The final report of that study is available at http://pondlift.com/more-info/, along with other information on the technologies described.
The NRCS-funded study revealed the basis for previous performance failures, while it also showed the basis for getting positive aeration performance at liquid manure storage sites: Ultimately, this information showed that large reductions of manure odor can be obtained while offering a new paradigm for eliminating most potential manure runoff through WISE aeration as the first step.
The paradigm change summary:
- Aeration provides aerobic bacteria based manure decomposition while in storage.
- Aerobic bacteria produce only carbon dioxide, which is considered carbon neutral when converting manure’s nutrients to fertilizer, reduced greenhouse gas (Aerobic gives off no other greenhouse gasses such as methane or oxides, and few odors)
- “No odor” allows direct distribution of decomposed manure nutrients onto crops during growing season. (Distribution is done during growing season, using automated irrigation equipment).
- Low-cost automated manure distribution reduces farm operation costs, but also allows the nutrients to be distributed to equal acres during a wider application time frame (not limited to when crop land is barren in spring or before fall freezeup.)
- A wider application time frame allows multiple applications at smaller doses onto growing crops. Depending on nutrient application goals and equipment, irrigation rates can be as little as 1/8th inch of water, multiple times through the year, instead of one large dose.
- Irrigation equipment is likely not operating when potential runoff conditions are pending, especially when the entire spring/summer/fall periods are available for distribution.
- When nutrients are applied onto growing crops at low dosage rates during periods when irrigation is desired, very little potential for runoff is present. Only a small portion of 1/8” of water onto a crop canopy rarely reaches the ground. The nutrient rich water quickly binds with the dry surface soil when it does get past the crop canopy during summer application.
- Current manure distribution distribution requires that most farmers fight to get raw manure distributed onto cropland before spring planting (which is often a wet time of year), OR after crops are harvested and bales removed. Although farmers and regulators wish that all manure handling is performed before freezeup, it is not the case: It happens more than anyone admits. Manure application to frozen ground is an understated and unquantified manure runoff cause. Such runoff can be eliminated by the new paradigm of application onto growing crops.
Further, the “side use” of treated effluent has significant benefit compared to raw manure. Aerobic Bacteria-Laden Effluent (ABLE water) is extremely proficient in its use within flume systems and for automatic flushing of alleys. The aerobic bacteria within the treated water is “hungry” to go to work, to pick up fresh food as it passes over the floor/alley, on its way back to the storage pond.
The layman’s explanation is similar to urban water delivery pipes and wastewater pipes buried within city streets:
- Historically, dairy operators quickly learned that fresh well water will create a “slime” on surfaces, causing extremely slippery floors and alleys which injure cows. To eliminate much of the slipperiness, they stopped using fresh water and instead used raw manure from the pond. In many cases, they would add water to the pond, when manure got too thick and again caused slippery areas.
- Unseen by most people are the 2 pipe systems under streets carrying our water and sewer. Factually, one pipe has slime, and the other pipe is amazingly clean: While acknowledging the newspaper notices that fire hydrants are going to be “flushed” several times/year, most don’t realize the purpose for doing so is to flush the slime from our drinking water pipes! The slime is not toxic to humans due to chlorination, but its buildup reduces pipe capacity, and its color is unpleasant to see in drinking water. In the case of unaerated fresh water used at farms, it tends to grow the slime that dairymen simply can’t afford on their alleys/floors.
- Meanwhile, most people won’t look into a sewer manhole to note how “clean as a dinner plate” it looks! Sewerage pipes are designed for high capacity peak flow but normally runn at very low levels. This allows tremendous aeration activity within the system as water tumbles at manholes and as flows change direction. Thus, the aeration, food, and bacteria within properly operating sewer systems have very little odor, with the bacteria laden effluent continuously cleaning the sewer pipe. Sewer Pipes indeed look “brand new” even after operating for decades! Those who effectively aerate their manure pond water so they have high aerobic populations within the effluent, and use that effluent for flushing alleys and flumes are quite happy with the resultant cleaning of the alleys, floors, and flumes.
Lastly, ABLE water likely has traits of “compost tea”: Compost Tea is made by steeping in water, a quantity of completed compost, rich with soluble nutrients, bacteria, fungi, protozoa, nematodes and microarthropods. After removing the steeped compost solids, the remaining effluent is rich with those items recognized by many as necessary for building the soil and most effective for plant growth. The tea is to be used quite soon after it is created, but aeration can lengthen the storage period. Within aerobically treated manure ponds, because aeration is being performed continuously, compost tea-like benefits are anticipated to be included to crops having the WISE treated effluent application.
What did we do?
A basic hypothesis for WISE technology was developed in 2014 to explain why aeration levels are significantly higher compared to bubble blower technology. This hypothesis explains how/why results are being obtained and allows purposeful thought on how to maximize performance.
Meanwhile, engineering solutions were developed for the two main issues of equipment available at the time: 1) Previous equipment was heavy and required boom trucks/cranes to install/remove it for servicing (250 to 900 lb.), and 2) The propeller orientation/shape would inherently draw in stringy material that wraps on the propeller shaft, which then requires removal (see problem 1). New equipment was designed that weighs less than 120 lb. and is easily installed by hand (Figure 1).

What have we learned?
After years of testing the new design, the equipment proved to be able to operate without inviting stringy material to wrap on the propeller and to be easy to handle by hand. The design was declared an engineering success and marketing began.
In addition, nitrogen retention rates for aerobic manure treatment are much higher than published, most likely due to the traditional domestic wastewater treatment process assumptions of the 1970’s and the use of partial aeration, due to high costs of bubble blowers, instead of continuous aeration used within WISE aeration activity.
Prior to the 2018 North American Manure Expo, data was collected at 3 different farms in the Brooking SD area, each farm having a different brand/style of providing aeration. Due to the uncontrolled variables, results varied within each farm and also varied from the other farms. Although no clear specific results were determined, one specific trend was that installing equipment at a higher operational rate (1 device/50 animal units) than the study used (1 device/70animal units), offered higher nitrogen retention than can be expected from the NRCS funded study, which is higher than currently published aeration rates. This leads me to believe that there may be some misunderstood biological process for retaining nitrogen within aerobically treated effluent using WISE aeration. It appears there are some things unequivocally misunderstood about aerobic manure treatment and the nutrients retained, most likely also associated with the items commonly identified/targeted with Compost Tea discussions. The potential for changing the current manure handling paradigm to one where odor is not an issue, and application of manure nutrients onto growing crops which might also reduce manure runoff warrants further study.
The presentation will also touch on some basic misunderstandings about ammonia/ammonium, provide “do’s” and “don’ts” of installations and/or studies, and identify additional subjects for study.
What are the next steps?
- Associated technology is being developed to perform foliar application. If farmers can’t handle manure differently, why would they do additional work, just to distribute it the same way they do now? The presentation will include basic information for a Self-Propelled Extremely Wide Portable Linear Irrigator (SPEWPLI). This equipment is projected to be able to irrigate/fertigate a full 160-acre field in 5 passes, and then be quickly moved to the next field. It is anticipated that manure pumpers would use existing equipment to deliver liquid manure to fields and use the SPEWPLI equipment as an alternative to conventional drag-hose injection. Foliar feeding has proven beneficial, applying nutrients directly onto growing crops (in canopy) when they best increase yields. By changing the distribution window to summertime, farmers don’t need to apply only in spring or in fall, or leave fields un-planted so manure can be applied in the summer.
While most farmers will not spend money to buy technology which only rids manure of odor while they continue to handle it as they have in the past, since there is very little economic return for only controlling odor, there are other aspects of WISE aeration technology to provide economic return, which then provides odor relief as a “free” benefit.
- More information is needed on the benefits of distributing manure nutrients directly to growing crops and on the economics of low-cost, automated systems.
- More information is needed in maximizing aeration for the energy used by way of this technology.
- More information is needed in how nitrogen can possibly be tied up and reserved by the other bacteria, fungi, protozoa, nematodes and microarthropods within compost tea-like effluent.
A listing of such subject study items, likely to be doctorate dissertation level projects, will be included in the presentation.
Because our brand resolves issues that other equipment has, we will make it available for academic study at field sites and for others to use for additional research in the use of WISE aeration technology.
Author
John Ries, PE, Pond Lift, Elk Point, SD, johnries@pondlift.com
The authors are solely responsible for the content of these proceedings. The technical information does not necessarily reflect the official position of the sponsoring agencies or institutions represented by planning committee members, and inclusion and distribution herein does not constitute an endorsement of views expressed by the same. Printed materials included herein are not refereed publications. Citations should appear as follows. EXAMPLE: Authors. 2019. Title of presentation. Waste to Worth. Minneapolis, MN. April 22-26, 2019. URL of this page. Accessed on: today’s date.