Concentrated animal feeding operations (CAFOs) are encountering more resistance. There are cases where citizens file suit to stop application of a new or expansion of animal production facility; others petition the county commissioners to stop the facility via zoning or health ordinances. When extension personnel were asked about CAFOs, it became apparent that some user-friendly and brief information pieces are needed, especially those that are based in fact and able to capture the audience’s attention and address their emotions. Well-managed CAFOs tend to have less nutrient management and odor nuisance issues, and when needed, there are options to mitigate odor and improve nutrient management. Many CAFOs have been shown to benefit the local economy, which is critical to rural communities. The videos are intended to be short so that the user can stay interested and choose next topics of interests. The goal is to capture users’ attention and provide them with essential facts rather than trying to push information to them.
What did we do?
The University of Missouri Extension team have created a series of short whiteboard videos that target concerned local citizens and county commissioners seeking information about the impacts of CAFOs on environment, economy, antibiotics, and health. Scripts were developed by the faculty based on facts and peer-reviewed publications. Artists were hired to develop the whiteboard videos. A total of five videos were developed in the first production round and posted onto a website. A website and YouTube Channel were created to present the videos.
What we have learned?
The team created the videos and showed to classes and university staff, to collect feedback and ideas to improve the videos. Iteration of the scrips, communication with the artists, panel review for clarity and improvement, are critical to the video production.
Implications of the project or research
General public who want to learn more about CAFOs or concerned about the potential impacts of newer, intensive animal farms are able to access research based information to answer their questions. Between 7/10/2018 and 3/1/19 the videos have a total of 963 views, CAFO Environmental Impact is the most viewed at 336.
What should people remember as take-home messages from your presentation?
More scientific based information and application of social media might be needed to convey more information, and stimulate non-agricultural and younger audiences to learn more about animal production facts.
Future plans
Based on the feedback and discussion, create more videos to promote science-based information pieces, to reach a broad audience.
Authors
Lim, Teng (Associate Professor and Extension Agricultural Engineer, Agricultural Systems Management, University of Missouri, limt@missouri.edu)
Massey, Ray; Bromfield, Cory; and Shannon, Marcia; University of Missouri
Four of the videos were developed by small grants provided by the U.S. Pork Center of Excellence.
The authors are solely responsible for the content of these proceedings. The technical information does not necessarily reflect the official position of the sponsoring agencies or institutions represented by planning committee members, and inclusion and distribution herein does not constitute an endorsement of views expressed by the same. Printed materials included herein are not refereed publications. Citations should appear as follows. EXAMPLE: Authors. 2019. Title of presentation. Waste to Worth. Minneapolis, MN. April 22-26, 2019. URL of this page. Accessed on: today’s date.
There are known benefits and challenges to finishing beef cattle under roof. The accumulated manure is typically stored in either a bedded pack (mixture of bedding and manure) or in a deep pit below a slatted floor. Previous research measured particulate matter, ammonia and other gases in bedded pack barn systems. Deep pit manure storages are expected to have different aerial nutrient losses and manure value compared to solid manure storage and handling. Few studies have looked at concentrations at animal level or aerial/temperature distributions in the animal zone. There is little to no documentation of the air quality impacts of long-term deep pit manure storage in naturally ventilated finishing cattle barns. The objective of this work is to describe the seasonal and spatial variations in aerial ammonia concentrations in deep pit beef cattle barns.
What Did We Do?
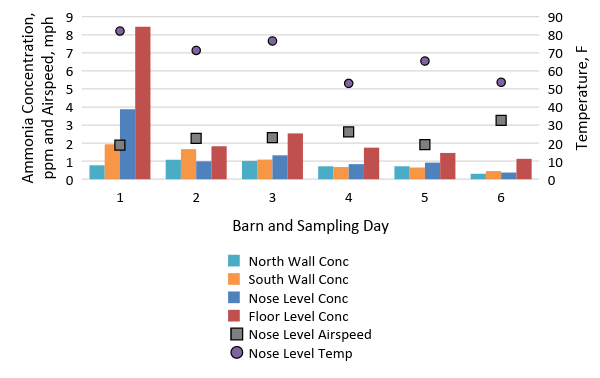
We measured ammonia concentrations among four pens in three beef cattle barns oriented east and west with deep pit manure storage during summer and fall conditions in Minnesota. We measured the concentration below the slatted floor (above the manure surface), 4-6 inches above the floor (floor level) and 4 ft above the floor (nose level). While collecting samples from within a pen, we also collected samples from the north and south wall openings surrounding the pen. We collected air and surface temperatures, air speed at cow level, and surface manure samples to supplement the concentration data. We collected measurements three times between 09:00 and 17:00 on sampling days. The cattle (if present) remained in the pen during measurement collection.
All farms had 12 ft deep pits below slatted floors, and pen stocking densities of 22 ft2 per head at capacity. Barn F finished beef cattle breeds under a monoslope roof, in four pens, with feed alleys on north and south side of pens. Two pens shared a common deep pit, and the farm pumped manure from the deep pits 1 week prior to the fall sampling period. Two pens were empty and the other two pens partially filled with cattle during the fall sampling period. Barn H finished dairy steers under a gable roof in a double-wide barn, in twelve pens over a deep pit and two pens with bedded packs, with a feed alley down the center of the barn. Four (east end) and eight (west end) pens shared common deep pits; the bedded pack pens were in the middle of the barn. The farm moved approximately 1 foot of manure from the east end pit to the west end pit one week prior to fall sampling period. Barn R finished dairy steers under a gable roof with four pens and a feed alley on the north side of the pens. All pens shared a common deep pit. Two pens were empty of cattle during the summer and fall sampling periods.
What Have We Learned?
The ammonia concentration levels differed based on the location in the pen area (Figures 1 and 2). As expected, the ammonia concentrations in the pit headspace above the manure surface was the greatest, and at times more than 10x the concentration at floor and nose level. The higher concentration levels measured at Barn F coincided with higher manure nitrogen levels (Total N and Ammonium-N) (Figure 2). Based on July and September measurements, higher ammonia concentration levels also coincided with higher ambient temperatures (Figure 1). The presence and size of cattle in the pens we measured did not strongly influence ammonia concentrations at any measurement height within a barn on sampling days.
Ammonia concentration is variable between barns, and within barns. However, at animal and worker level, average concentrations for the sampling periods were less than 10 ppm during the summer and fall periods. Higher gas levels can develop in the confined space below the slatted floor.
Future Plans
The air exchange between the deep pit headspace and room volume relates these two areas, but is challenging to measure. We are looking at indirect air exchange estimations using ammonia and other gas concentration measurements collected to quantify the amount of air movement through the slatted floor related to environmental conditions. Additional gas and environmental data collected will enhance our understanding of deep pit beef cattle barn environments.
Authors
Erin Cortus, Assistant Professor and Extension Engineer, University of Minnesota
Brian Hetchler, Research Technician, University of Minnesota; Mindy Spiehs, Research Scientist, USDA-ARS; Warren Rusche, Extension Associate, South Dakota State University
Additional Information
USDA is an equal opportunity provider and employer
Acknowledgements
The research was supported through USDA NIFA Award No. 2015-67020-23453. We appreciate the producers’ cooperation for on-farm data collection. Thank you to S. Niraula and C. Modderman for assisting with measurements.
Figure 1. Average ammonia concentration levels in the animal and worker zone for three deep pit beef cattle barns during spring and fall sampling days, and the corresponding airspeed and temperature at cow nose level.Figure 2. Average ammonia concentration levels at nose and manure surface levels for three deep pit beef cattle barns during spring and fall sampling days, and the corresponding surface* manure characteristics. (* Barn F 14-Sep-18 manure sample was an agitated sample collected during manure removal).
The authors are solely responsible for the content of these proceedings. The technical information does not necessarily reflect the official position of the sponsoring agencies or institutions represented by planning committee members, and inclusion and distribution herein does not constitute an endorsement of views expressed by the same. Printed materials included herein are not refereed publications. Citations should appear as follows. EXAMPLE: Authors. 2019. Title of presentation. Waste to Worth. Minneapolis, MN. April 22-26, 2019. URL of this page. Accessed on: today’s date.
USDA-NRCS has nearly fifteen years of Conservation Innovation Grant project experience, and several of these projects have provided a means to learn more about various techniques for addressing air emissions from animal agriculture. The overall goal of the Conservation Innovation Grant program is to provide an avenue for the on-farm demonstration of tools and technologies that have shown promise in a research setting and to further determine the parameters that may enable these promising tools and technologies to be implemented on-farm through USDA-NRCS conservation programs.
What Did We Do?
Several queries for both National Competition and State Competition projects in the USDA-NRCS Conservation Innovation Grant Project Search Tool (https://www.nrcs.usda.gov/wps/portal/nrcs/ciglanding/national/programs/financial/cig/cigsearch/) were conducted using the General Text Search feature for keywords such as “air”, “ammonia”, “animal”, “beef”, “carbon”, “dairy”, “digester”, “digestion”, “livestock”, “manure”, “poultry”, and “swine” in order to try and capture all of the animal air quality-related Conservation Innovation Grant projects. This approach obviously identified many projects that might be related to one or more of the search words, but were not directly related to animal air quality. Further manual review of the identified projects was conducted to identify those that specifically had some association with animal air quality.
What Have We Learned?
Out of nearly 1,300 total Conservation Innovation Grant projects, just under 50 were identified as having a direct relevance to animal air quality in some way. These projects represent a USDA-NRCS investment of just under $20 million. Because each project required at least a 50% match by the grantee, the USDA-NRCS Conservation Innovation Grant program has represented a total investment of approximately $40 million over the past 15 years in demonstrating tools and technologies for addressing air emissions from animal agriculture.
The technologies that have been attempted to be demonstrated in the animal air quality-related Conservation Innovation Grant projects have included various feed management strategies, approaches for reducing emissions from animal pens and housing, and an approach to mortality management. However, the vast majority of animal air quality-related Conservation Innovation Grant projects have focused on air emissions from manure management – primarily looking at anaerobic digestion technologies – and land application of manure. Two projects also developed and enhanced an online tool for assessing livestock and poultry operations for opportunities to address various air emissions.
Future Plans
The 2018 Farm Bill re-authorized the Conservation Innovation Grant Program through 2023 at $25 million per year and allows for on-farm conservation innovation trials. It is anticipated that additional air quality projects will be funded under the current Farm Bill authorization.
Authors
Greg Zwicke, Air Quality Engineer, USDA-NRCS National Air Quality and Atmospheric Change Technology Development Team
greg.zwicke@ftc.usda.gov
Additional Information
More information about the USDA-NRCS Conservation Innovation Grants program is available on the Conservation Innovation Grants website (https://www.nrcs.usda.gov/wps/portal/nrcs/main/national/programs/financial/cig/), including application information and materials, resources for grantees, success stories, and a project search tool.
The authors are solely responsible for the content of these proceedings. The technical information does not necessarily reflect the official position of the sponsoring agencies or institutions represented by planning committee members, and inclusion and distribution herein does not constitute an endorsement of views expressed by the same. Printed materials included herein are not refereed publications. Citations should appear as follows. EXAMPLE: Authors. 2019. Title of presentation. Waste to Worth. Minneapolis, MN. April 22-26, 2019. URL of this page. Accessed on: today’s date.
Reducing aerial emissions and improving air quality is a common goal in the livestock and poultry industries. This webinar presents three approaches to reducing aerial emissions from barn exhaust air, using combinations of wet scrubbing, electrostatic precipitation, filtration and enhanced dispersion. This presentation was originally broadcast on March 29, 2019. More…Continue reading “Three Options for Cleaning Barn Exhaust Air”
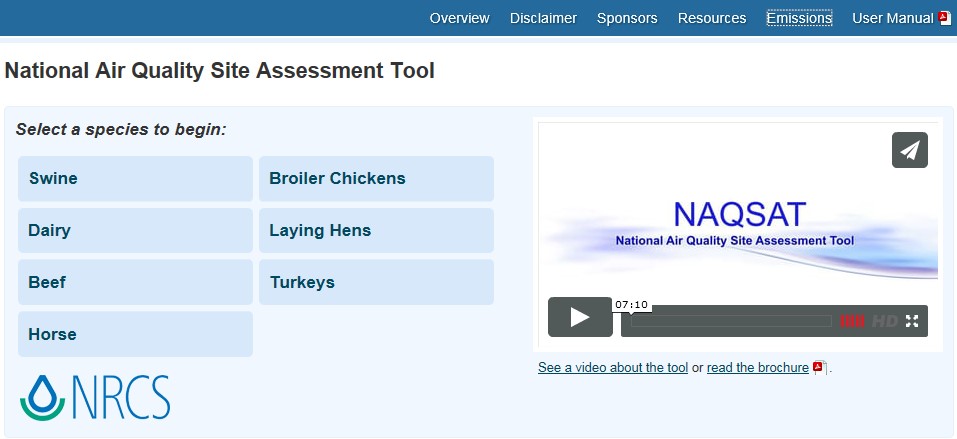
The National Air Quality Site Assessment Tool (NAQSAT) was developed as a first-of-its-kind tool to help producers and their advisors assess the impact of management on air emissions from livestock and poultry operations and identify areas for potential improvement related to those air emissions.
What did we do?
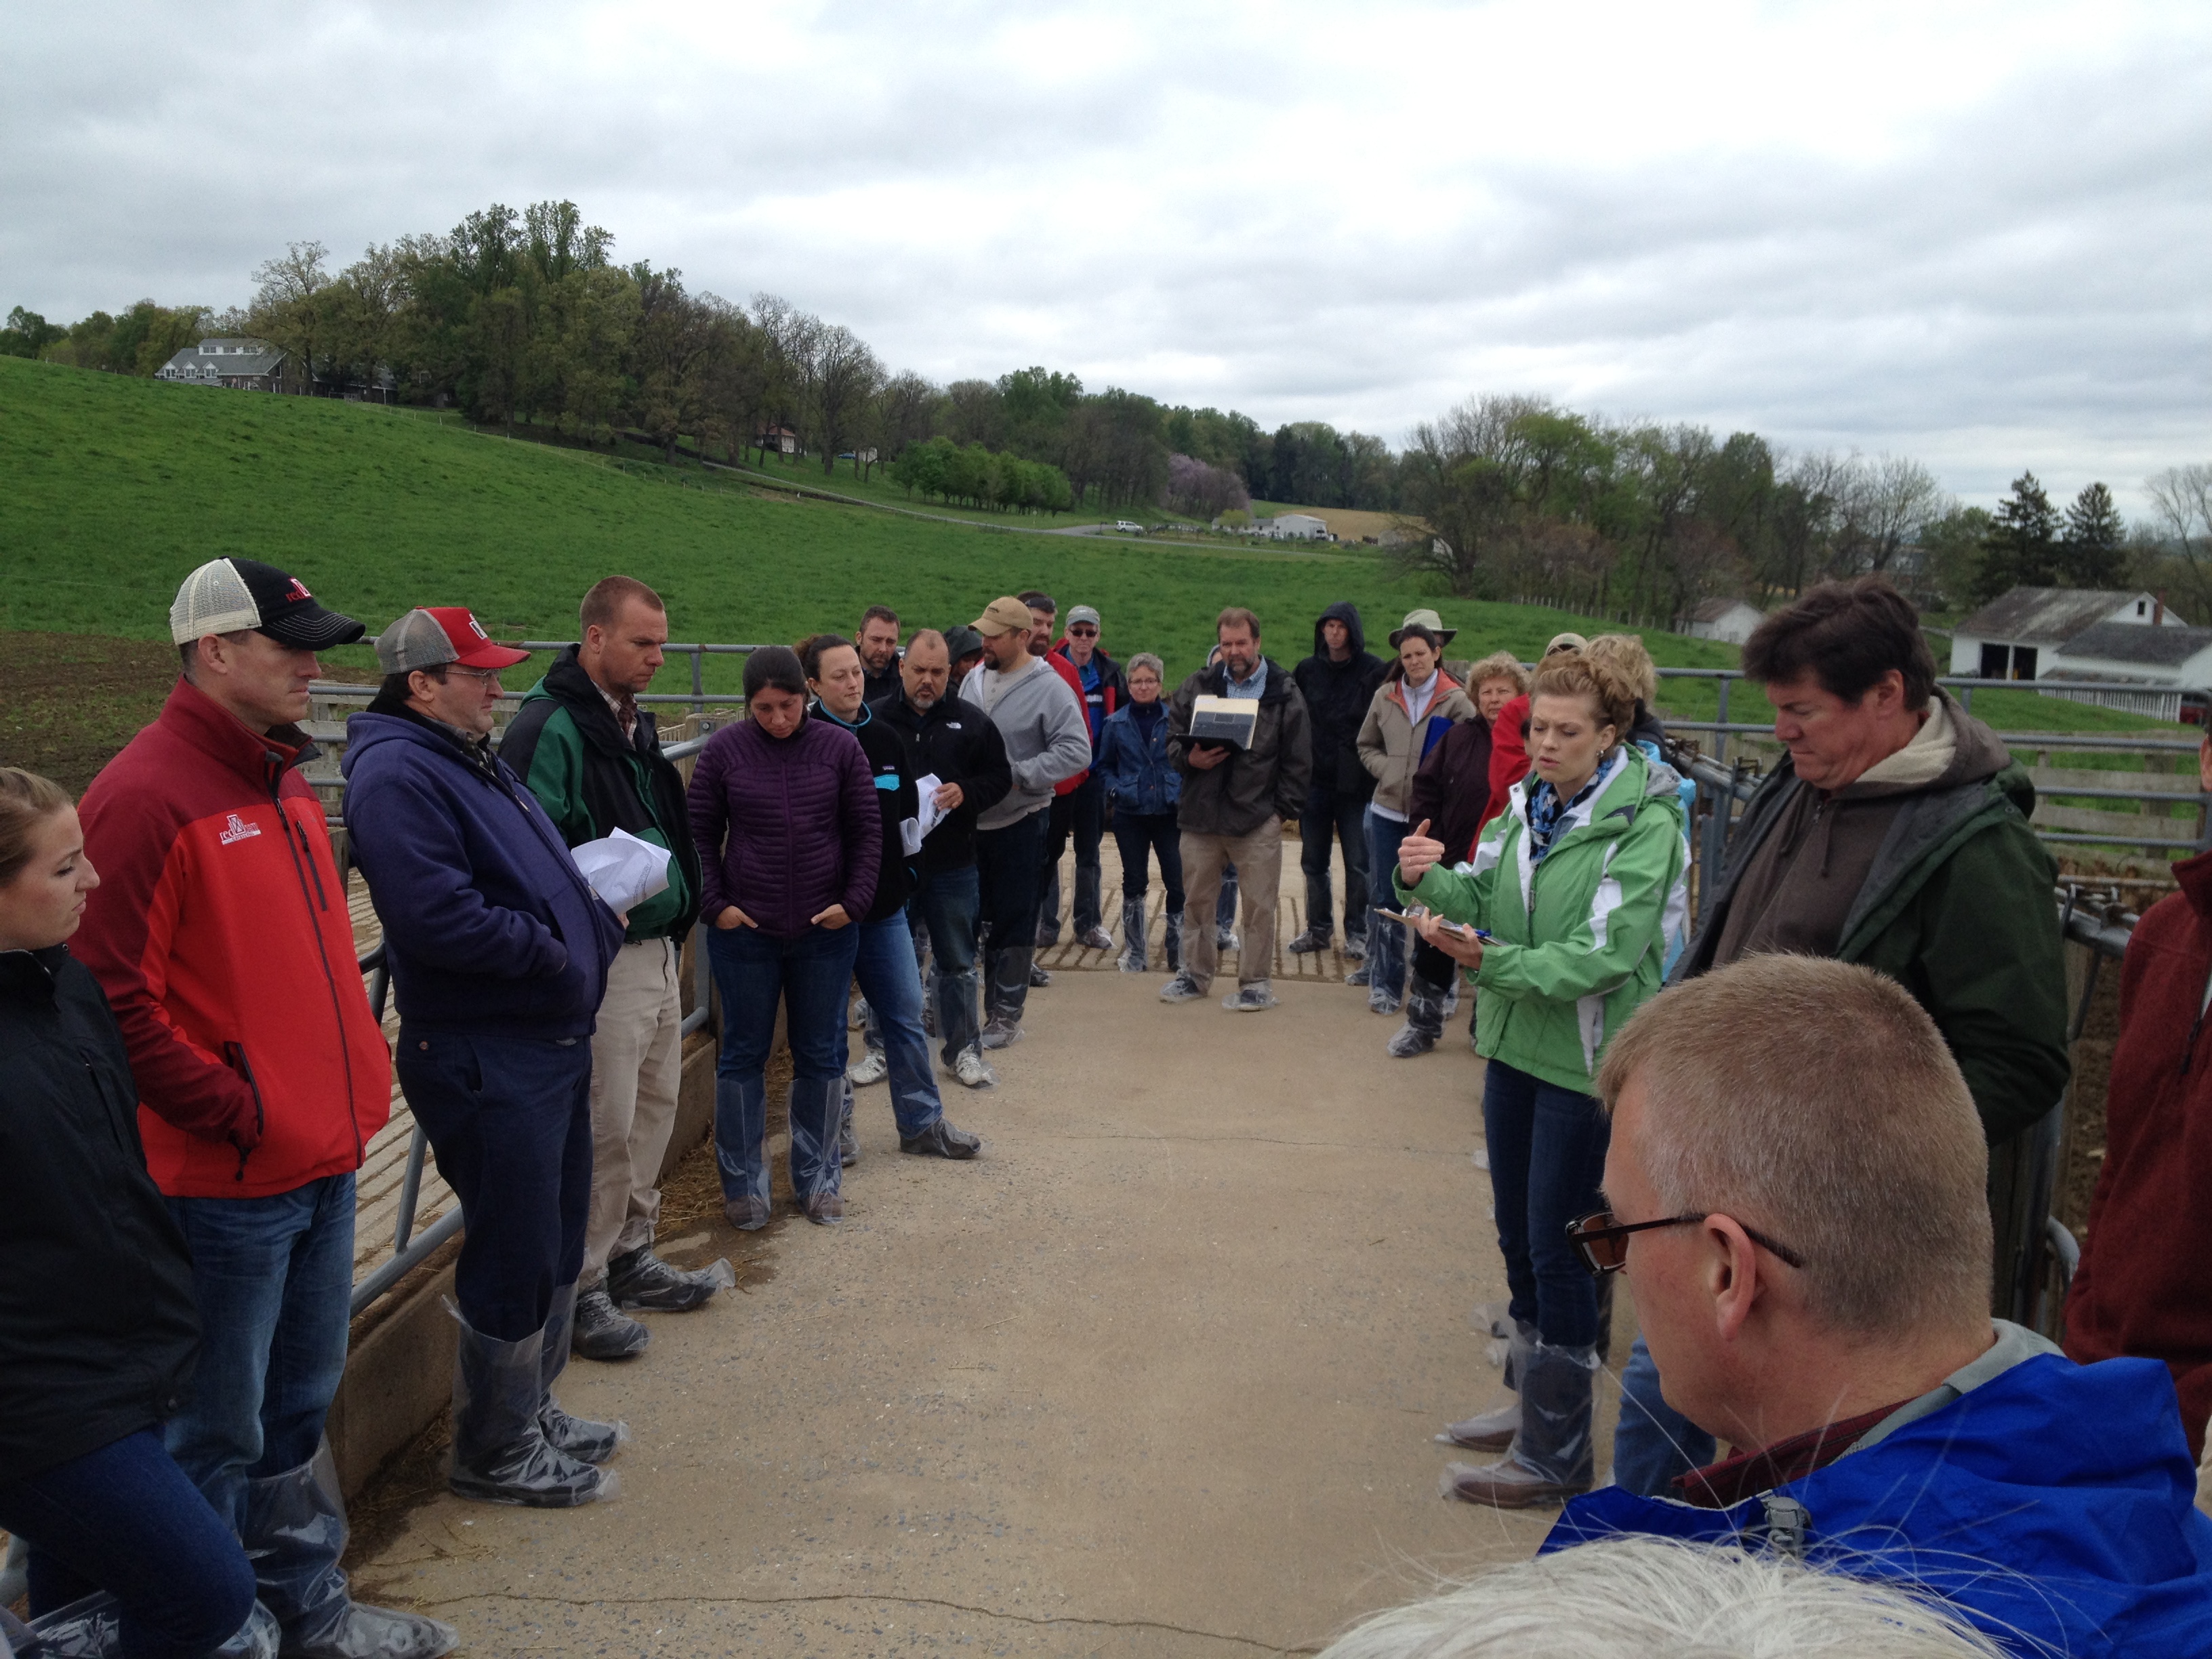
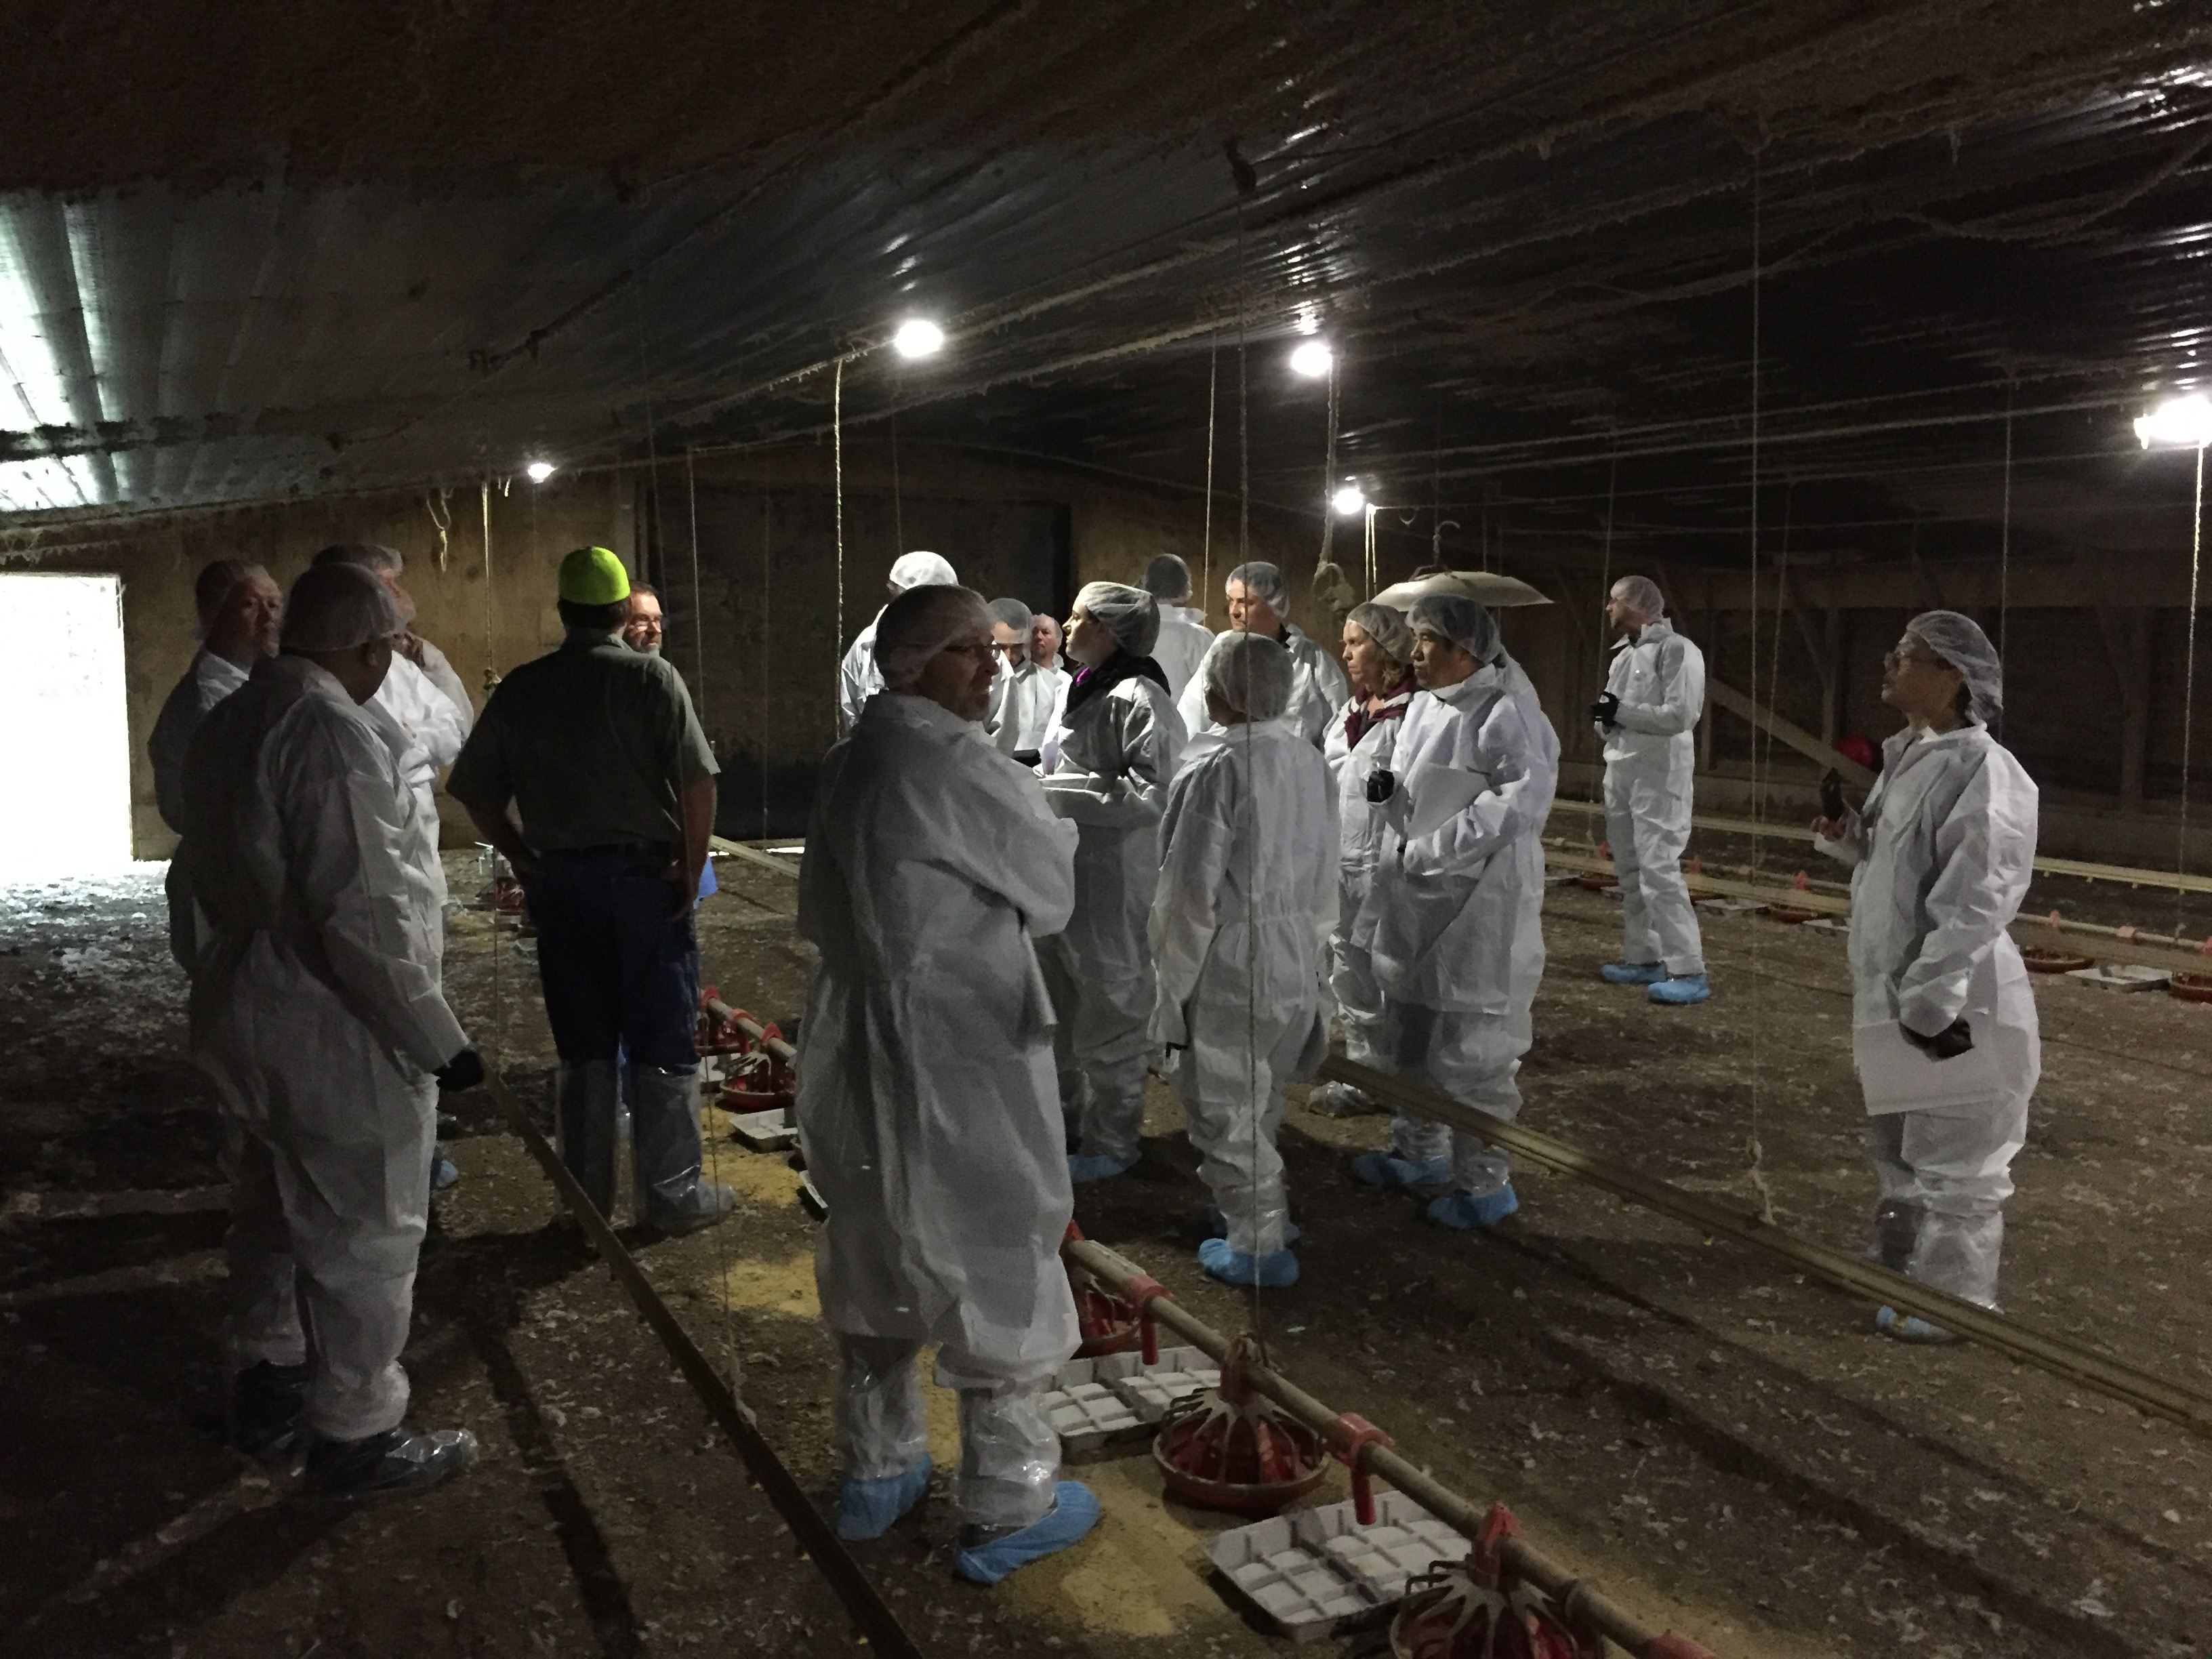
In 2007, several land-grant universities, with leadership from Michigan State University, began developing NAQSAT under a USDA-NRCS Conservation Innovation Grant (CIG). The initial tool included beef, dairy, swine, and poultry operations. A subsequent CIG project, with leadership from Colorado State University, made several enhancements to the tool, including adding horses to the species list. In 2015, USDA-NRCS officially adopted NAQSAT as an approved tool for evaluating air quality resource concerns at livestock and poultry operations. USDA-NRCS also contracted with Florida A&M University in 2015 to provide several regional training workshops on NAQSAT to NRCS employees. Six training workshops have been completed to date (Raleigh, NC; Modesto, CA; Elizabethtown, PA; Lincoln, NE; Richmond, VA; and Yakima, WA) with assistance from multiple NAQSAT development partners. Additionally, USDA-NRCS revised its comprehensive nutrient management plan (CNMP) policy in October 2015 to make the evaluation of air quality resource concerns mandatory as part of CNMP development.
What have we learned?
NAQSAT has proven to be a useful tool for bench-marking the air emissions impacts of current management on confinement-based livestock and poultry operations. In the training sessions, students have been able to complete NAQSAT runs on-site with the producer or producer representative via tablet or smartphone technologies. Further classroom discussion has helped to better understand the questions and answers and how the NAQSAT results can feed into the USDA-NRCS conservation planning process. Several needed enhancements and upgrades to the tool have been identified in order to more closely align the output of the tool to USDA-NRCS conservation planning needs. NAQSAT has also proven to be useful for evaluating the air quality resource concern status of an operation in relation to the CNMP development process.
Future Plans
It is anticipated that the identified needed enhancements and upgrades will be completed as funding for further NAQSAT development becomes available. Additionally, as use of NAQSAT by USDA-NRCS and our conservation planning and CNMP development partners expands, additional training and experience-building opportunities will be needed. The NAQSAT development team has great geographic coverage to assist in these additional opportunities.
Corresponding author, title, and affiliation
Greg Zwicke, Air Quality Engineer – Air Quality and Atmospheric Change Team, USDA-NRCS
Greg Johnson, Air Quality and Atmospheric Change Team Leader, USDA-NRCS; Jeff Porter, Animal Nutrient and Manure Management Team Leader, USDA-NRCS; Sandy Means, Agricultural Engineer – Animal Nutrient and Manure Management Team, USDA-NRCS
University of Georgia Department of Poultry Science
University of Idaho
University of Maryland
University of Maryland Department of Animal and Avian Sciences
University of Minnesota
University of Missouri
University of Nebraska
USDA-ARS
Virginia Tech University
Washington State University
Western United Dairymen
Whatcom County (WA) Conservation District
The authors are solely responsible for the content of these proceedings. The technical information does not necessarily reflect the official position of the sponsoring agencies or institutions represented by planning committee members, and inclusion and distribution herein does not constitute an endorsement of views expressed by the same. Printed materials included herein are not refereed publications. Citations should appear as follows. EXAMPLE: Authors. 2017. Title of presentation. Waste to Worth: Spreading Science and Solutions. Cary, NC. April 18-21, 2017. URL of this page. Accessed on: today’s date.
Recently there has been increased interest in regulating ammonia emissions to reduce PM2.5 (“fine” particles with an aerodynamic diameter less than 2.5 micrometers) concentrations. However, understanding the quantity of and interactions between ammonia and nitrogen oxide (NOx) is necessary in determining whether controlling ammonia is an effective strategy for reducing PM2.5 in a particular region. Research from the California Regional Particulate Air Quality Study and other studies has demonstrated the relative abundance of ammonia in comparison to the limited concentrations of the other key precursor, nitric acid formed by NOx emissions. As a result, NOx acts as the primary limiting precursor for the formation of secondary ammonium nitrate in the San Joaquin Valley (SJV). Modeling based on data from these studies also found that controlling NOx was the most effective strategy to reduce ammonium nitrate particulate in the SJV and controlling ammonia had little effect on PM2.5 concentrations.
In summary and as explained in the San Joaquin Valley Air Pollution Control District 2012 PM2.5 Plan, the best scientific information available indicates that controlling NOx emissions is the most effective strategy to reduce secondary ammonium nitrate in the SJV. While it has been demonstrated that controlling ammonia will not significantly reduce PM2.5 concentrations in the SJV, the District has adopted stringent regulations that have significantly reduced ammonia emissions.
Purpose
The San Joaquin Valley is primarily a rural region with large areas dedicated to agriculture. Recently there has been increased interest in regulating ammonia emissions from agricultural operations and other sources as a means to reduce PM2.5 concentrations. However, understanding the quantity and interactions between ammonia and NOx are necessary in determining whether controlling ammonia emissions is an effective strategy for reducing secondary PM2.5 formation in a particular geographic region.
The United States Environmental Protection Agency (U.S. EPA) periodically reviews and establishes health-based air quality standards (often referred to as National Ambient Air Quality Standards, or NAAQS) for ozone, particulate matter (PM), and other pollutants. Although the air quality in California’s San Joaquin Valley has been steadily improving, the region is currently classified as “serious” non-attainment for the 1997 and 2006 federal ambient air quality standards for PM2.5. The periods for which measured PM2.5 concentrations drive nonattainment of these standards occur primarily in the winter months and air quality research in the San Joaquin Valley has identified ammonium nitrate as the predominant contributor to secondary PM2.5 in the region. Ammonium nitrate particulate is formed through chemical reactions between ammonia in the air and NOx emissions produced by mobile and stationary combustion sources. As shown in Figure 1 above, ammonium nitrate is commonly the largest contributor to PM2.5 mass during the winter in the San Joaquin Valley.
What did we do?
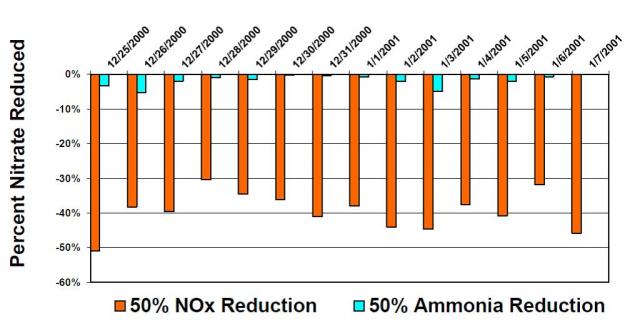
Atmospheric modeling has demonstrated that controlling NOx is the most effective strategy to reduce ammonium nitrate concentrations in the San Joaquin Valley and controlling ammonia has little effect on these concentrations. The California Air Resources Board conducted multiple modeling runs to simulate the formation of PM2.5 in the San Joaquin Valley and compare the effect of reducing various pollutants on PM2.5 concentrations. As seen in Figure 2, U.S. EPA’s Community Multi-scale Air Quality (CMAQ) indicated that reducing NOx by 50% reduced nitrate concentrations by 30% to 50% reductions, while reducing ammonia by 50% resulted in less than 5% reductions in nitrate concentrations. Similarly, the UCD/CIT photochemical transport model indicated that for the conditions on January 4-6, 1996 in the San Joaquin Valley, controlling NOx emissions is far more effective for reducing nitrate concentrations than controlling ammonia.
What have we learned?
Ammonium nitrate particulate is limited by NOx in the San Joaquin Valley
Extensive research conducted through the California Regional Particulate Air Quality Study (CRPAQS) and other studies has demonstrated the relative abundance of ammonia in comparison to the limited concentrations of the other key precursor, nitric acid formed by NOx emissions in the San Joaquin Valley. As a result, NOx (via nitric acid) acts as the primary limiting precursor for the formation of secondary ammonium nitrate. (See Figures 3 and 4)
Future Plans
As explained in detail in the San Joaquin Valley Air Pollution Control District 2012 PM2.5 Plan, the best scientific information available indicates that controlling NOx emissions is the most effective strategy to reduce secondary ammonium nitrate in the San Joaquin Valley. While ammonia has been demonstrated to not significantly contribute to PM2.5 concentrations in the San Joaquin Valley, the District has developed control strategies, via stringent regulations (Confined Animal Facilities – Rule 4570, Organic Material Composting – Rule 4566, Biosolids, Animal Manure, and Poultry Litter Operations – Rule 4565), that have resulted in significant reductions in ammonia emissions.
Chen, J.; Lu, J.; Avise, J. C.; DaMassa, J. A.; Kleeman, M. J. & Kaduwela, A. P. (2014), Seasonal modeling of PM2.5 in Californias San Joaquin Valley, Atmospheric Environment 92, p. 182-190.
Kleeman, Michael J., Qi Ying, Ajith Kaduwela (2005) Control Strategies for the Reduction of Airborne Particulate Nitrate in California’s San Joaquin Valley. Atmospheric Environment, 39 (29), p. 5325 – 5341
The authors are solely responsible for the content of these proceedings. The technical information does not necessarily reflect the official position of the sponsoring agencies or institutions represented by planning committee members, and inclusion and distribution herein does not constitute an endorsement of views expressed by the same. Printed materials included herein are not refereed publications. Citations should appear as follows. EXAMPLE: Authors. 2015. Title of presentation. Waste to Worth: Spreading Science and Solutions. Seattle, WA. March 31-April 3, 2015. URL of this page. Accessed on: today’s date.
Currently, there is limited regulation of ammonia (NH3) emissions as a matter of federal policy. The Clean Air Act (CAA) provides the federal authority for regulation of these emissions. Although there are reporting requirements for NH3 under the Comprehensive Environmental Response, Compensation and Liability Act and Emergency Planning and Community Right-To-Know Act, these statutes do not provide authority to regulate emissions of NH3. There is increasing pressure to change NH3 policy primarily due to concerns about nutrient enrichment of large water bodies, such as the Chesapeake Bay and the Gulf of Mexico. Recently, the EPA has been petitioned to list NH3 as a criteria pollutant; and this request is somewhat supported by the report from the EPA’s Integrated Nitrogen Panel to the Science Advisory Board. There is also the immediate concern of EPA’s treatment of NH3 as a precursor to fine particulate matter (PM2.5). Regulation of NH3 as a precursor to PM2.5 will make it a regulated pollutant under the CAA. It will be difficult to regulate only the ‘excess’ portion of reactive N, particularly since ‘excess’ cannot be defined as a constant. Roughly 60- 85% of NH3 emissions in the U.S. are estimated to come from agricultural sources, a sector that varies considerably from the traditional industrial sources addressed by the environmental statutes. In fact, in most of these statutes, there is recognition that agricultural sources are different; and some regulatory exemptions are provided. Most likely, Congress did not anticipate the application of the CAA to agricultural sources or it would have included some exemptions in it as well. Nevertheless, regulation of NH3 emissions under the CAA will make it extremely difficult for EPA to consider the positive value and need for fertilizer NH3, which could have huge implications for the viability of the domestic and global food supply.
Purpose
Members of the U.S. Department of Agriculture’s Agricultural Air Quality Task Force (AAQTF) recognize the ever increasing pressure to change ammonia policy in the United States and to regulate sources of ammonia emissions under various environmental statutes including the Clean Air Act (CAA). Ammonia is not your ordinary air pollutant and will be difficult to regulate appropriately under the current construct of the CAA. Therefore, members of the AAQTF developed and approved a paper outlining information that regulators should consider before regulating ammonia emissions entitled, “Ammonia Emissions: What to Know Before You Regulate.”
What did we do?
Consideration of NH3 as an air pollutant will require the EPA to acknowledge and address the role of NH3 in the full nitrogen (N) cycle and specifically address emission reduction measures that do not merely transfer NH3 from one environmental medium to another. It will be difficult to regulate only the “excess” portion of reactive N, particularly since “excess” cannot be defined as a constant. Regulation of NH3 emissions under the CAA will make it extremely difficult for EPA to consider the positive value and need for fertilizer NH3, which could have huge implications for the viability of the domestic and global food supply.
To date, pollutants regulated under the CAA are considered “bad” for public health and for the environment; and the statute is designed to limit the impacts of these pollutants by reducing or eliminating their emissions. As EPA moves to regulate greenhouse gases, it is encountering difficulty in applying the existing statute in its consideration of carbon dioxide as a pollutant, which is a necessary component of the life cycle of plants and animals. Regulation of NH3 emissions within the constraints of the existing CAA will prove no less daunting and may lead to costly and illogical outcomes with little actual benefit to the environment or human health.
Prior to regulating ammonia emissions, EPA regulators must fully understand ammonia’s role in agriculture. Not only must there be an understanding of the nitrogen cycle from a chemical perspective, but there must be a full understanding from a biological perspective as well. These biological processes cannot be easily predicted or controlled and are based on many factors such as geographic region, cropping system, management practices, soil characteristics, climate and field variability. In animal production systems, there must be an understanding of diets and nitrogen use efficiency of the various species and the impacts of the housing systems, manure characteristics and management, and climate variables.
The EPA regulators must also not only understand the fate, transport, and transformation of atmospheric ammonia but must be able to quantify these processes. Any regulation of agricultural sources of ammonia should be informed by knowledge of management practices that will reduce emissions without negatively impacting animal and plant health and production levels. Ammonia reduction strategies must be considered across the entire production spectrum and not on individual aspects of production.
Underlying any regulation must be accurate measurement of the emissions and the ability to measure compliance, i.e., reductions and impacts. However, ammonia emissions are fugitive, vary spatially and temporally, and are readily influenced by many factors (e.g., source, climate, management practices, etc.) making it difficult to determine at a farm level, a precise emission factor. There are currently no easy and economical ways to directly monitor emissions from commercial livestock and cropping farms, which will make emissions estimation and enforcement challenging. Proceeding to regulation without proven methodologies for measurement of agricultural sources of ammonia and the ability to demonstrate scientifically the effectiveness of reduction practices, does not seem appropriate.
Nitrogen is essential to both crop and animal production, and when not supplied in sufficient amounts, will decrease both crop yield and animal productivity, risk declining soil system health and sustainability, and generate a loss for producers and perhaps even increase the overall environmental footprint of agricultural activities. Certain management or mitigation practices may be too costly for many producers given the current market value of agricultural commodities, so any regulation must considered how these costs will be covered.
What have we learned?
A collaborative dialogue with the agricultural community needs to occur prior to considering regulation. Current approaches of voluntary and incentive-based efforts are accomplishing significant improvements in soil health and reducing erosion and loss of nutrients, and agencies should recognize these improvements.
EPA can assist constructive dialog by avoiding regulatory silos and embracing holistic approaches in development of policies as it focuses on the agricultural sector; avoiding “One size fits all” style requirements; and avoiding multiple regulations on the same practice.
Farmers of the U.S. and the world must meet the food, fiber, and fuel needs of the predicted nine billion people by 2050. Therefore, any regulation of ammonia under the Clean Air Act must address its impact on the sustainability of domestic and global food supply as part of the mandatory statutory requirement to evaluate public health and welfare effects and the vitality of rural communities.
Future Plans
The AAQTF will continue to address these issues and attempt to facilitate future dialogue with EPA and USDA on these issues.
The contributions of members of the AAQTF to the discussions of these issues and to the development of the paper are recognized and greatly appreciated.
The authors are solely responsible for the content of these proceedings. The technical information does not necessarily reflect the official position of the sponsoring agencies or institutions represented by planning committee members, and inclusion and distribution herein does not constitute an endorsement of views expressed by the same. Printed materials included herein are not refereed publications. Citations should appear as follows. EXAMPLE: Authors. 2015. Title of presentation. Waste to Worth: Spreading Science and Solutions. Seattle, WA. March 31-April 3, 2015. URL of this page. Accessed on: today’s date.
*Why Examine Solid – Liquid Manure Separation at Pig Farms?
V-shape pit with automated manure scraper and trough
Many US pork production operations have become large in size and more geographically concentrated, and use very similar production facilities and manure management. With the potential extreme climates and diminishing water and land base, the industry needs to further improve the production systems and conservation effort. A Missouri swine finishing barn was designed to separate manure into solid and liquid portions, reduce odor and air emissions, and provide options for nutrient and water management. There is potential to reduce overall water use, and more importantly, to more efficiently export nutrients from the farm, or conserving nutrients in either the solid or liquid portions using additional practices.
What did we do?
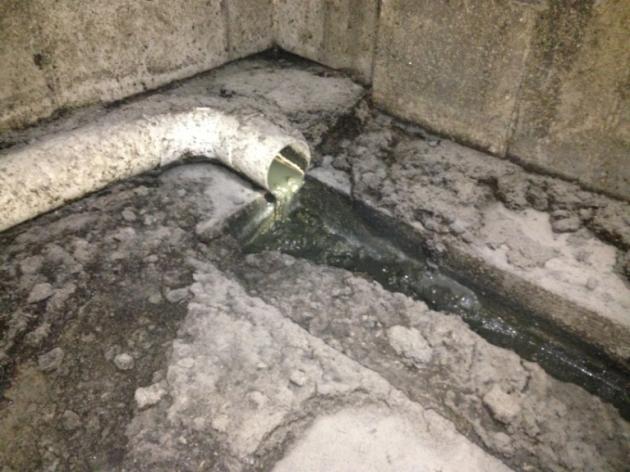
Gravity draining of liquid manure
The solid/liquid separation barn has a capacity of 1200-hd. Manure management consists of a V-shaped gutter with mechanical scrapers installed beneath slatted floor, and a central pipe that collects the liquid manure fraction. The scraped manure is mechanically conveyed out to a nearby storage shed. Liquid manure portion is gravity drained into a temporary sump pit, and pumped into a nearby anaerobic lagoon automatically. Four monthly solid portion and liquid portion samples were collected and analyzed for moisture content, total nitrogen, phosphorous, potassium, pH, total carbon, and volatile solid content. The collected samples were kept on ice during transport and then frozen until analyzed by the University of Missouri Soil and Plant Testing Laboratory. Ammonia and hydrogen sulfide concentrations of the exhaust air streams were also measured using gas detection tubes during three of the four sampling events.
What have we learned?
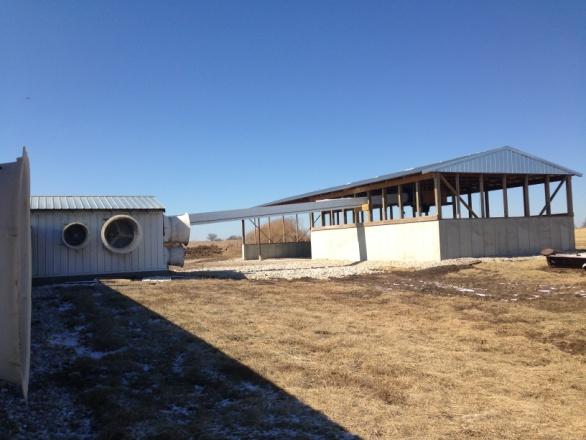
Storage shed for solid manure
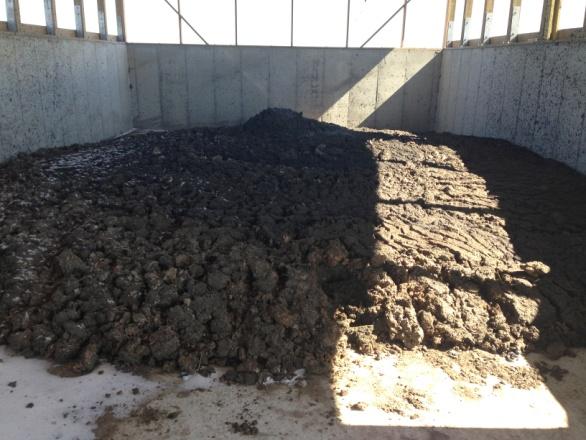
The solid manure portions have relatively low moisture content (MC, 57.9% to 63.4%, averaged 60.7%), and the liquid portion still have considerable amount of solids (MC = 93.3% to 98.3%, averaged 96.1%). The average nitrogen, phosphorus, potassium were 1.72%, 0.65%, 0.75% for the solid manure samples, and were 0.40%, 0.10%, and 0.29% for the liquid manure samples, respectively.
Ammonia concentration of the center exhaust fans averaged 7.7, 7.0, and 1.8 ppm for the February (n=3), March (n=2), and May (n=2) sampling visits respectively, and only one room fan was operating during the March visit, which measured 5.0 ppm (n=1). For all the sampling visits, hydrogen sulfide never reached the minimum detection limit of 0.5 ppm.
Stored solid manure
The new facility design and reported findings have the potential to be adapted by new and existing production facilities, to develop new business models and management that are more flexible in nutrient management, and to improve resource conservation and reduce pollutions. It has been noted that the liquid stream can have relatively low solids from the well maintained scraper systems. If the farm continues to use the lagoon, there will be significantly less solid to be agitated and pumped. Assuming the untreated manure has a solid content of 6%, and the solid contents of the separated liquid and solid portions average about 3% and 39% respectively, the estimated contents in the solid manure are 28% and 47% of the total nitrogen and phosphorus in untreated manure, respectively. This is promising for exporting nutrients from the farm, or conserving nutrients in either the solid or liquid portions using additional practices.
Future Plans
More research is needed to systematically analyze the costs and management of the facilities, implications of water/nutrient conservations, potential byproduct production, and long-term sustainability improvement. The immediate next steps are to characterize the liquid and solid manure portions (in terms of volume and nutrient values) and barn air quality and emissions during different seasons. Effort should also include identification of the minimal and different levels of pre-treatment and reverse osmosis onto the liquid manure, for potential fertilizer concentrate, improved manure management, and potential water recycling. The long-term goals are to improve such solid/liquid separation barn, to provide partial manure treatment and water recycling potential that can be tailored for different cases and production sites.
Authors
Teng Lim, Associate Professor, University of Missouri limt@missouri.edu
Joseph M. Zulovich, University of Missouri.
Additional information
The collaboration of the farm owner and managers are greatly appreciated.
The authors are solely responsible for the content of these proceedings. The technical information does not necessarily reflect the official position of the sponsoring agencies or institutions represented by planning committee members, and inclusion and distribution herein does not constitute an endorsement of views expressed by the same. Printed materials included herein are not refereed publications. Citations should appear as follows. EXAMPLE: Authors. 2015. Title of presentation. Waste to Worth: Spreading Science and Solutions. Seattle, WA. March 31-April 3, 2015. URL of this page. Accessed on: today’s date.
Example of odor visualization system using colors and shapes to replace chemical jargon.
Why Is Smell and Odor Important to Animal Agriculture?
Smell is perhaps the least understood of our five senses. Yet, the human perception of odor may mean the difference between war and peace for a livestock farmer and his neighbors. Because the science of smells is complex, there is a tendency to run straight for the organic chemistry book when we try to describe farmstead odors. This approach goes right over the heads of most people. There must be a better way to communicate odors to diverse audiences. This workshop can be utilized by teachers or extension staff to teach about communication of a topic that is frequently encountered by farmers, ag professionals, and others. To see the presentation slides, scroll to the bottom of the page.
Learning Objectives
This two hour workshop will explain how to use an innovative visual technique to describe farmstead odors to general audiences without resorting to chemical jargon. The visualization technique based on shapes and colors was developed at Oklahoma State University in the mid 1990s, and has been used to talk about odors with many diverse audiences. The method demonstrates that odors have “structure”, and can be measured using the four concepts: character, concentration, intensity, and persistence.
Students will also participate in a mock laboratory exercise to demonstrate how odor intensity and pleasantness are measured. Results of the exercise will be analyzed in “real time”. Further analyses of previous exercise runs will be compared and contrasted to the workshop results. This laboratory has been presented to over 250 college freshmen and their results are presented in this recording.
Workshop Introduction
What is an Odor?
Measuring Odors
Odor Experiment
Another Odor Experiment
Physiology of Smell
Author
Douglas W. Hamilton, Associate Professor and Extension Waste Management Specialist, Oklahoma Cooperative Extension Service dhamilt@okstate.edu
Doug Hamilton is an associate professor of Biosystems and Agricultural Engineering at Oklahoma State University. He has three degrees in Agricultural Engineering from the University of Arkansas, Iowa State University, and Penn State University. His sense of smell remains keen despite the fact he has worked with livestock manure for nearly 34 years.
The authors are solely responsible for the content of these proceedings. The technical information does not necessarily reflect the official position of the sponsoring agencies or institutions represented by planning committee members, and inclusion and distribution herein does not constitute an endorsement of views expressed by the same. Printed materials included herein are not refereed publications. Citations should appear as follows. EXAMPLE: Authors. 2013. Title of presentation. Waste to Worth: Spreading Science and Solutions. Denver, CO. April 1-5, 2013. URL of this page. Accessed on: today’s date.
The Federal Environmental Protection Agency (EPA) requires states to submit to them air quality emission inventories for all types of sources every three years. In 2012, the Central States Air Resource Agencies Association (CenSARA) and its contractor, TranSystems Corporation (TranSystems), developed a 2011 agricultural pesticide emissions inventory for the association’s member states of Arkansas, Iowa, Kansas, Louisiana, Minnesota, Missouri, Nebraska, Oklahoma, and Texas.
Crops grown in this region total more than 140 million acres and are routinely treated with pesticide products, such as herbicides, insecticides, and fungicides. Row crops, such as corn, soybeans, and sorghum and non-row crops, such as fruit orchards, were included in the work. Hazardous air pollutants (HAPs) and/or volatile organic compounds (VOCs) are in pesticide ingredients; VOCs being a main contributor to ground-level ozone, commonly known as smog. In this work, 458 active ingredient-specific VOC emission factors were developed, based primarily on empirically derived pesticide chemical data maintained by the California Department of Pesticide Regulations; county level active ingredient throughputs were derived from the best available information.
An emissions calculation tool was developed to produce emissions, following a linear crop to acreage relationship as the default. Participating states can use the tool to input local practices such as the selection of crops and/or the choice of pesticide products, as well as the extent and amount of applications. The work also included a survey to try to understand the timeframes pesticides are applied to various crops. These parameters can significantly alter the default linear relationship. The final product provided the individual states with 2011 emission estimates and a methodology to account for better data when obtained, which can result in a more accurate emission inventory for this source category.
Authors
Theresa Pella, Central States Air Resource Agencies Association tpella@censara.org
The authors are solely responsible for the content of these proceedings. The technical information does not necessarily reflect the official position of the sponsoring agencies or institutions represented by planning committee members, and inclusion and distribution herein does not constitute an endorsement of views expressed by the same. Printed materials included herein are not refereed publications. Citations should appear as follows. EXAMPLE: Authors. 2013. Title of presentation. Waste to Worth: Spreading Science and Solutions. Denver, CO. April 1-5, 2013. URL of this page. Accessed on: today’s date.
Manage Cookie Consent
To provide the best experiences, we use technologies like cookies to store and/or access device information. Consenting to these technologies will allow us to process data such as browsing behavior or unique IDs on this site. Not consenting or withdrawing consent, may adversely affect certain features and functions.
Functional
Always active
The technical storage or access is strictly necessary for the legitimate purpose of enabling the use of a specific service explicitly requested by the subscriber or user, or for the sole purpose of carrying out the transmission of a communication over an electronic communications network.
Preferences
The technical storage or access is necessary for the legitimate purpose of storing preferences that are not requested by the subscriber or user.
Statistics
The technical storage or access that is used exclusively for statistical purposes.The technical storage or access that is used exclusively for anonymous statistical purposes. Without a subpoena, voluntary compliance on the part of your Internet Service Provider, or additional records from a third party, information stored or retrieved for this purpose alone cannot usually be used to identify you.
Marketing
The technical storage or access is required to create user profiles to send advertising, or to track the user on a website or across several websites for similar marketing purposes.


 Atmospheric modeling has demonstrated that controlling NOx is the most effective strategy to reduce ammonium nitrate concentrations in the San Joaquin Valley and controlling ammonia has little effect on these concentrations. The California Air Resources Board conducted multiple modeling runs to simulate the formation of PM2.5 in the San Joaquin Valley and compare the effect of reducing various pollutants on PM2.5 concentrations. As seen in Figure 2, U.S. EPA’s Community Multi-scale Air Quality (CMAQ) indicated that reducing NOx by 50% reduced nitrate concentrations by 30% to 50% reductions, while reducing ammonia by 50% resulted in less than 5% reductions in nitrate concentrations. Similarly, the UCD/CIT photochemical transport model indicated that for the conditions on January 4-6, 1996 in the San Joaquin Valley, controlling NOx emissions is far more effective for reducing nitrate concentrations than controlling ammonia.
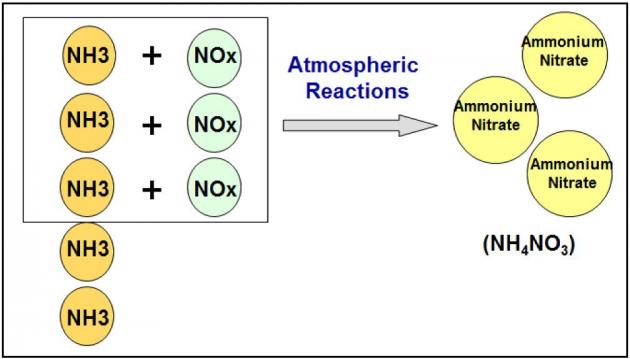 Ammonium nitrate particulate is limited by NOx in the San Joaquin Valley
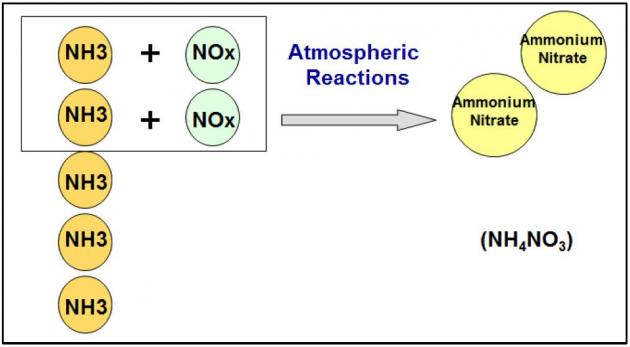 As explained in detail in the San Joaquin Valley Air Pollution Control District 2012 PM2.5 Plan, the best scientific information available indicates that controlling NOx emissions is the most effective strategy to reduce secondary ammonium nitrate in the San Joaquin Valley. While ammonia has been demonstrated to not significantly contribute to PM2.5 concentrations in the San Joaquin Valley, the District has developed control strategies, via stringent regulations (Confined Animal Facilities – Rule 4570, Organic Material Composting – Rule 4566, Biosolids, Animal Manure, and Poultry Litter Operations – Rule 4565), that have resulted in significant reductions in ammonia emissions.

 Author