With a rapid increase in global population, food security has become a significant concern. This has led to a significant rise in the demand for protein rich sustainable food. Therefore, worldwide tilapia cultivation is being seen as one of the most economical paths to meet the demand of protein rich food. Moreover, with increasing urbanization and pressing need of nutrient circularity, cost reduction and sustainability has driven the concept of aquaponics system, integrating aquaculture with hydroponics.
Aquaponics has gained significant demand both in the USA and globally and is postulated to reduce overall cost and land footprint, while simultaneously recycling the nutrients in a closed system. Further integration of an anaerobic digestion (AD) system for biogas production using aquaponics waste can make the aquaponic system energy resilient and environmentally sustainable. Therefore, the purpose of this study is to investigate the potential of various aquaponics waste for biogas production, and their fate under co-digestion.
What Did We Do?
In this study, aquaponics waste viz., aquaponic sludge, and lettuce roots and leftover leaves after harvesting were obtained as AD substrate from the aquaponic test bed, running under controlled conditions at Purdue University. A centroid simplex design was created to test the biochemical methane potential (BMP) of the substrate under co-digestion. The BMP test was performed in 1.2-L BMP anaerobic digesters, which have a working volume of 1 L. Dairy manure-based digestate obtained from a continuously running industrial digester was used as an inoculum. For all the test groups, substrate to inoculum ratio was maintained at 1:3. All the test groups were set up in triplicates, and the digesters were incubated in the water bath at 37 °C for 30 days. Biogas volume was measured daily using a syringe method.
What Have We Learned?
The study results showed that the aquaponic sludge and lettuce leaves fed in the anaerobic digesters at a ratio of 50:50 on volatile solids (VS) basis had the highest specific methane yield of 0.525 m3 kg-1 VS. However, the lettuce roots showed an antagonistic effect on co-digestion, giving a specific biogas yield of 0.173 m3 kg-1 VS. The results indicate that enhanced methane yields can be achieved by co-digesting aquaponic sludge with farm residues in an appropriate ratio.
Future Plans
This study is part of a USDA research project to develop sustainable blue food systems driven by integrated aquaponics. Further efforts in AD of aquaponics waste are planned to mitigate the inhibitory effect of lettuce roots on co-digestion, so all aquaponics farm residues can be optimally utilized, simultaneously addressing waste management and generating nutrient-rich digestate as a biofertilizer for aquaponic crops. This approach can transform organic waste from aquaponics and plant harvesting into renewable energy, offsetting external energy needs and reducing the environmental footprint.
Authors
Presenting & corresponding author
Ji-Qin Ni, Professor, Agricultural and Biological Engineering, Purdue University, Jiqin@purdue.edu
Additional authors
Mohit Singh Rana, Postdoctoral Research Associate, Purdue University
This research was supported by the intramural research program of the U.S. Department of Agriculture, National Institute of Food and Agriculture, Agriculture and Food Research Initiative grants no. 2023-68012-39001.
The authors are solely responsible for the content of these proceedings. The technical information does not necessarily reflect the official position of the sponsoring agencies or institutions represented by planning committee members, and inclusion and distribution herein does not constitute an endorsement of views expressed by the same. Printed materials included herein are not refereed publications. Citations should appear as follows. EXAMPLE: Authors. 2025. Title of presentation. Waste to Worth. Boise, ID. April 7-11, 2025. URL of this page. Accessed on: today’s date.
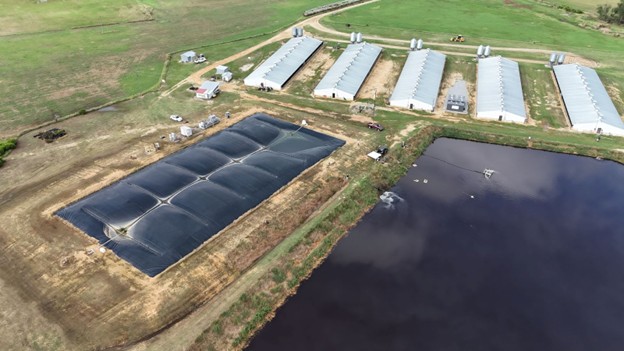
This study seeks to quantify the impact of swine slurry nitrification on biogas productivity. Ammonia (NH3) is produced during anaerobic digestion of manure and emitted during storage. Ammonia emissions have adverse impacts on swine health and growth, caretaker health, and local air and water quality. Ammonia is also known to inhibit methanogenic activity during anaerobic digestion, reducing methane potential. Thus, reducing ammoniacal nitrogen in digester feedstock can improve digester performance. A novel approach to nitrogen management, developed by a commercial partner, is nitrifying flush water that feeds into the digester. This technology leverages nitrification to suppress NH3 volatilization through using low-pH, highly nitrified substrate to flush the barns. This alternative reduces in-barn NH3 concentration surge during flushing events. In addition, equilibrium between nitrified (oxidized) flush liquid and reduced urine-feces will reduce ammoniacal nitrogen levels in the feed entering the digester. A barn-scale system (17,000 gallons per day capacity) is currently under testing on a NC swine farm that has an anaerobic digester as part of the waste management system (Figure 1). Understanding the impacts of this treatment on anaerobic digestion under controlled conditions under different organic loading rates is needed. This study aimed to quantify impacts of flush water nitrification on biomethane yield (BMY) in swine manure under two different organic loading rates (OLRs).
What Did We Do?
Figure 1: Commercial swine farm used for sample collection.
Three different substrates were collected for this study. Substrates were sourced from the same farm every 2 to 3 weeks (Figure 2). Swine slurry was processed through settling > decanting > maceration > screening to create liquid (<1% solids) and solid (>5% solids) fractions needed to formulate desired OLRs. Two OLRs were tested in this study, 1 g VS/L-d (low, L) and 2 g VS/L-d (high, H). For each OLR, two substrate formulations were tested: nitrified (treatment, T) and baseline (control, C). Therefore, four combinations of substrate and OLR were evaluated in this study and were abbreviated as: CH, CL, TH, and TL.
Figure 2: Nitrification System installed onsite
Eight mesophilic reactors at 95°F (35 °C), each with a two-liter active volume, were used to study the impacts of OLR and substrate type, with two replicates per OLR-substrate combination, represented by 1 or 2, respectively. Reactors were fed once daily, 6 days per week, unless otherwise noted. Influent and digestate total solids (TS), volatile solids (VS), chemical oxygen demand (COD), pH, alkalinity, and nitrogen forms were analyzed during the study. Biogas composition (% carbon dioxide (CO2), methane (CH4), and nitrogen gas (N2)), specific CH4 productivity (mL/g VS-fed), and volatile solids and COD reduction (%) were compared across treatments.
What Have We Learned?
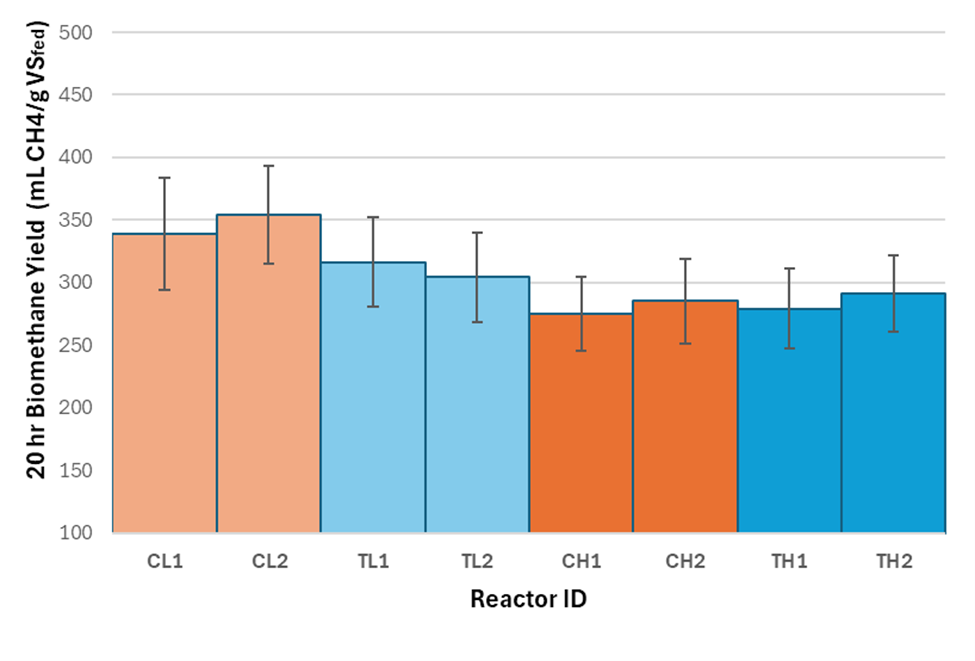
Overall, comparable BMY values were observed across reactors with mean reactor productivity ranging from 275 to 354 mLCH4/g VS-fed. Average BMY for the reactors represented around 61% of typical values of ultimate biomethane potential (BMP) for swine manure reported in the literature, i.e., 450 to 550 mLCH4/gVS. Increasing OLR from 1 to 2 gVS/L-d resulted in a 14% decrease in BMY. The nitrogen treatment effect appears to be minimal and only limited to low OLR treatments. The percentage deviation of biomethane productivity between C and T reactors was less than 1%.
Similar to CH4, concentrations of CO2 were impacted more by OLR than the nitrogen treatment implemented. For low OLR reactors, Average CO2 concentrations in the biogas were for treatment reactors. Increasing the OLR showed an increase in CO2 concentration in the biogas, with control and treatment reactors containing approximately , respectively.
Figure 3 – Cumulative biomethane yields (20 hr) by reactor ID. The ID of each reactor denotes the combination of substrate, OLR, and replicate. Control (C) and nitrified (T) substrates were fed to corresponding reactors according to 2 OLRs, 1 g VS/L-d (L) and 2 g VS/L-d (H).
Future Plans
We plan to continue our data analysis to quantify reduction in VS and COD. Similarly, digestate characterization to quantify alkalinity and volatile fatty acids (VFAs) in the feedstock and digestates is ongoing. Two-way analysis of variance (ANOVA) will be conducted to assess treatment impacts on specific methane yield, VS and COD reduction. Denitrification occurring within reactors was further investigated via GC-TCD headspace analysis. We plan to closely analyze denitrification dynamics to capture the effect of treatment on nitrogen forms and organic matter in the substrates.
Authors
Presenting author
Kristina E. Jones, Graduate student researcher, North Carolina State University
Corresponding author
Mahmoud A. Sharara, PhD, Associate Professor and Extension Specialist, North Carolina State University, Msharar@ncsu.edu
Acknowledgements
This work was funded by Pancopia, Inc. as part of a Department of Energy, Small Business Innovation Research program grant (DOE SBIR, Grant No. DE-SC0020833). Authors would like to acknowledge Smithfield Foods for access and support sampling. and undergraduate student researchers: Brian Ngo, Nick Bell, Kiarra Condon, Himanth Mandapati, and Jackson Boney for assistance and support conducting this study.
The authors are solely responsible for the content of these proceedings. The technical information does not necessarily reflect the official position of the sponsoring agencies or institutions represented by planning committee members, and inclusion and distribution herein does not constitute an endorsement of views expressed by the same. Printed materials included herein are not refereed publications. Citations should appear as follows. EXAMPLE: Authors. 2025. Title of presentation. Waste to Worth. Boise, ID. April 7-11, 2025. URL of this page. Accessed on: today’s date.
Anaerobic digestion (AD) of dairy manure with and without food waste has mainly been implemented on a large scale in the US. The installed cost of these systems have economies of scale, and operations and maintenance costs need to be outweighed by adequate revenues from accepting food waste and/or producing energy, as well as reducing greenhouse gases (GHG). Scaling down AD systems is now technically feasible even on a micro-scale, but economic feasibility is still largely a challenge at small scales.
Local markets with competitive value structures for AD energy output and GHG reduction are needed to facilitate successful small and moderate scale AD systems. Analysis of energy values and consideration of food waste co-digestion with manure, as a way to expand revenues needed for economic feasibility at various scales, can help farmers and policymakers navigate opportunities.
What Did We Do?
We investigated the economic feasibility conditions of small, medium, and large AD systems processing dairy manure from 300 cows, 1000 cows, and 2,000 cows, respectively, in combination with varying amounts of food waste. The Cornell Manure-based Anaerobic Digester Simulation tool was further developed and then utilized to model the mesophilic, vessel-type AD of various food wastes and amounts in combination with varying dairy cow manure volumes to assess performance and associated economics. The breakeven capital cost of the full project was computed for each scenario (nine per dairy farm size) of manure to food waste ratio, tip fee revenue, energy output and revenue value. These were compared to estimated project costs based on multiple case studies to evaluate whether or not the breakeven cost was high enough to be considered an economically viable project.
What Have We Learned?
Key results from modeling these scenarios included that an AD to biomethane system can be economically feasible for a 300-cow dairy (300 lactating cow equivalents) only when food waste is co-digested in an equal volume with the manure and when tip fees reach $20 per ton and biomethane is valued at $25 per million BTU (MMBTU) or more. Biomethane sell price data collected from our collaborator, Energy Vision, was found to be as high as $70 per MMBTU if sold in the California transportation market (manure only AD), and between $12 and $28 in voluntary markets.
Additionally, a dairy farm with 1,000 lactating cow equivalents (e.g., 725 milk cows and 650 heifers), was found to achieve economic feasibility with 25% or more of food waste ratio to manure co-digested as long as both tip fees and energy revenue were high ($40 per ton tip and $35 per MMBTU biomethane). When food waste ratios increased to half the digester’s feedstock, economic feasibility was achievable at more moderate rates. The economic feasibility of manure-only AD continues to be challenged at small and moderate scale, while the addition of food waste with manure enables significantly higher revenues from substantially more energy production and tipping fees.
Future Plans
This project included detailed analysis of a small-scale co-digestion application at Cornell’s smaller Teaching Dairy operation to evaluate available equipment and biogas utilization options. A preliminary design is developed, capital funding secured, and initial operating period research and extension defined. The project is scheduled to be completed later this calendar year and will be utilized for various food waste and manure anaerobic digestion to energy system research and educational programming.
Authors
Presenting & corresponding author
Lauren Ray, Sr. Extension Associate, Cornell University – PRO-DAIRY, LER25@cornell.edu
Additional author
Peter Wright, Agricultural Engineer, Cornell University
Funding was provided by the New York Farm Viability Initiative.
The authors are solely responsible for the content of these proceedings. The technical information does not necessarily reflect the official position of the sponsoring agencies or institutions represented by planning committee members, and inclusion and distribution herein does not constitute an endorsement of views expressed by the same. Printed materials included herein are not refereed publications. Citations should appear as follows. EXAMPLE: Authors. 2025. Title of presentation. Waste to Worth. Boise, ID. April 7-11, 2025. URL of this page. Accessed on: today’s date.
Biochar is a carbon-rich product derived from pyrolysis and is commonly used as a soil amendment. When applied to soil, biochar has been shown to sequester carbon, enhance aggregate stability, and improve soil nutrient and water retention. Recently, several states have adopted the USDA Natural Resources Conservation Service (NRCS) Code 336, which addresses soil carbon amendments, including biochar, as a conservation practice. This has led to increased awareness of biochar in agricultural systems. While the application of biochar to soil systems has been extensively studied, there are other agricultural sectors where biochar could be incorporated to provide additional benefits. This study explores the potential for incorporating biochar into manure management systems, specifically anaerobic digestion and manure storage.
What Did We Do?
Two different studies were conducted as part of this research. The first study investigated how biochar could be implemented into manure storage systems. Manure storage is a common practice at livestock facilities; however, emissions of ammonia (NH₃), methane (CH₄), and nitrous oxide (N₂O) are released into the atmosphere during storage. Additionally, the increasing use of solid-liquid separation in mid- to large-scale farms has resulted in emissions occurring outside of land application due to the lack of crust formation on manure storage. This study assessed emissions from pilot manure storage units (5-gallon buckets) after applying a 2-inch layer of raw feedstock or biochar as a cover over dairy manure. Different feedstocks, including woodchips, corn stover, and manure solids, were evaluated, and emissions were measured weekly over four months to determine NH₃, CH₄, and N₂O emissions (Figure 1).
Figure 1: Manure storage monitoring
The second study examined the incorporation of biochar into dairy manure anaerobic digestion systems. Anaerobic digestion of livestock manure produces biogas, which contains significant concentrations of hydrogen sulfide (H₂S) that must be removed before energy utilization. This study evaluated how dosing biochar—produced from different feedstocks and at varying pyrolysis temperatures—impacted hydrogen sulfide reduction during anaerobic digestion. A bench-scale study was conducted using batch reactors dosed at 0.75% (w/w) (approximately 62 lbs per 1,000 gallons), and biogas was analyzed every 2–3 days for H₂S, CH₄, and CO₂ concentrations.
Figure 2: Anaerobic digestion setup
What Have We Learned?
In the manure storage study, both raw feedstocks and biochar reduced NH₃ emissions. The greatest reductions in NH₃ emissions were observed with woodchip biochar, which achieved an average reduction of 82–97% in cumulative emissions. The manure solids and corn stover biochar resulted in average reductions of 35% and 55%, respectively. However, while NH₃ emissions were reduced, an increase in greenhouse gas emissions—particularly N₂O—was observed in treatments with biochar covers.
In anaerobic digestion systems, the addition of biochar at 0.75% (w/w) reduced H₂S production. The degree of reduction was influenced by the biochar production temperature, with lower-temperature biochars being more effective at reducing H₂S. During the batch anaerobic digestion tests, no significant impact was observed on CH₄ or CO₂ concentrations in the biogas.
Future Plans
For the manure storage study, while the reductions in NH₃ emissions were promising, the observed increase in N2O emissions requires further investigation. The highest N₂O emissions were associated with large-particle woodchip biochar, likely due to the creation of an anoxic environment within the biochar cover. Future studies will examine whether reducing biochar particle size can mitigate these N₂O emissions. Additionally, further research will assess the long-term impacts of these treatments on soil health and crop production following land application.
For the anaerobic digestion study, additional work is needed to determine the specific biochar characteristics responsible for the greater H₂S reductions observed with lower-temperature biochars. Since the study was conducted at a batch scale, further evaluation in a continuous system is necessary. Lastly, full-scale digester trials are needed before widespread adoption of biochar in anaerobic digestion systems.
Authors
Presenting & corresponding author
Joseph R. Sanford, Assistant Professor, University of Wisconsin–Platteville, sanfordj@uwplatt.edu
Additional authors
Ben Raimonde, Undergraduate Research Assistant, University of Wisconsin–Platteville
John Rodwell, Undergraduate Research Assistant, University of Wisconsin–Platteville
Jeffery Smolinski, Undergraduate Research Assistant, University of Wisconsin–Platteville
Acknowledgements
This material is supported by the Wisconsin Dairy Innovation Hub and the National Institute of Food and Agriculture, U.S. Department of Agriculture, under award number 2022-70001-37309. Any opinions, findings, conclusions, or recommendations expressed in this publication are those of the authors and do not necessarily reflect the views of the U.S. Department of Agriculture or the Wisconsin Dairy Innovation Hub.
The authors are solely responsible for the content of these proceedings. The technical information does not necessarily reflect the official position of the sponsoring agencies or institutions represented by planning committee members, and inclusion and distribution herein does not constitute an endorsement of views expressed by the same. Printed materials included herein are not refereed publications. Citations should appear as follows. EXAMPLE: Authors. 2025. Title of presentation. Waste to Worth. Boise, ID. April 7-11, 2025. URL of this page. Accessed on: today’s date.
Bio-based biodegradable plastics led by polylactic acid (PLA) are becoming increasingly popular as a sustainable alternative to traditional plastics. Although bioplastics are designed to break down easily, many do not fully degrade in the natural environment as intended. Anaerobic digestion (AD) is a promising solution for decomposing bioplastics alongside food waste, turning them into biogas for energy and digestate, rich in nutrients, that can be used as fertilizer. However, studies have shown that bioplastics, particularly PLA, does not degrade fully in AD systems. The byproducts left over from AD raise serious problems, especially if residual microplastics could still be present in the digestate and affect the quality of the soil and water. While existing research predominantly focuses on enhancing methane production and biodegradation efficiency during AD, the quality of digestate after the digestion process has been overlooked. This significant research gap was highlighted in this review, emphasizing the need for comprehensive studies that evaluate digestate composition alongside biogas production.
What Did We Do?
A systematic review of peer-reviewed studies was conducted using databases such as Scopus, ScienceDirect and Google Scholar to assess research on bioplastic degradation in anaerobic digestion. The literature search was performed using the keywords ‘bioplastic degradation’, ‘pretreatment methods,’ ‘Anaerobic digestion,’ ‘biodegradation,’ ‘biogas production’ and ‘digestate quality’. Search filters were applied to prioritize recent studies (2010-present), peer-reviewed journal articles, and experimental studies analyzing bioplastic degradation and digestate quality. The initial search yielded 172 papers, which were then screened for relevance based on their focus on bioplastic degradation, biogas production, and digestate analysis. After filtering out studies that were not directly related, 42 papers were selected for detailed analysis. A significant portion of the literature examined the effectiveness of different pretreatment methods in improving bioplastic degradation. These methods included but not limited to thermal pretreatment, where the plastics are exposed to elevated temperatures to increase its hydrolysis potential; alkaline pretreatment, which involves chemical treatments to enhance polymer degradation; and thermo-alkaline pretreatment, a combination of heat and chemical treatment to increase its susceptibility to decomposition. This allowed us to assess the extent to which bioplastic degradation has been addressed and the incomplete degradation persisting, highlighting the need for more comprehensive studies into the digestate quality.
What Have We Learned?
Studies consistently showed that bioplastic, especially PLA, degradation in AD remains incomplete in most cases, leading to concerns about the accumulation of microplastics residues in digestate. While pretreatment methods have been effective, with thermo-alkaline pretreatment yielding the highest methane outputs across most studies. The variability in methane yields across different pretreatment conditions suggests that degradation efficiency is highly dependent on factors such as temperature, retention time, microbial communities, and chemical additives. However, very few studies have explicitly analyzed whether residual bioplastic particles persist in the digestate post-AD. Given that AD is promoted as a promising solution for sustainable plastic waste solution, failing to assess digestate composition may lead to unintended environmental consequences. The implications of these findings are significant, particularly for large-scale implementation. If AD-derived digestate is to be used in agriculture or soil restoration, it must be free of persistent microplastics. Without comprehensive digestate analysis, the environmental benefits of AD for bioplastic waste management remain uncertain.
Future Plans
We are currently conducting an experimental study to evaluate the degradation of PLA in AD under different pretreatment conditions – thermal, alkaline, and thermo-alkaline treatments – to enhance PLA degradation and improve methane yields. More importantly, we aim to go beyond methane production by analyzing the resulting digestate for microplastic residues and overall chemical composition. Future studies will involve optimizing pretreatment strategies to minimize microplastic residues and investigating the long-term impacts of digestate when applied to soil systems.
Authors
Presenting & corresponding author
Nadia Bawa Fio Bekoe, Graduate Research Assistant, Biosystems and Agricultural Engineering Department, Oklahoma State University, nbekoe@okstate.edu
Additional author
Douglas W. Hamilton, PhD, P.E., Associate Professor and Extension Waste Management Specialist, Biosystems and Agricultural Engineering, Oklahoma State University
Acknowledgements
South Central Sun Grant Program Fellowship
Livestock & Poultry Environmental Learning Community (LPELC) Professional Development Grants
The authors are solely responsible for the content of these proceedings. The technical information does not necessarily reflect the official position of the sponsoring agencies or institutions represented by planning committee members, and inclusion and distribution herein does not constitute an endorsement of views expressed by the same. Printed materials included herein are not refereed publications. Citations should appear as follows. EXAMPLE: Authors. 2025. Title of presentation. Waste to Worth. Boise, ID. April 7–11, 2025. URL of this page. Accessed on: today’s date.
Dairy farmers in Washington state have been under significant pressure to reduce their carbon footprint in recent years. Dairy cooperative sustainability initiatives such as achieving carbon neutrality by 2050 have left many producers wondering what will be required of them to help their cooperatives meet this goal. Coupled with regulatory pressures to report on their greenhouse gas emissions and the threat of regulation to reduce them, uncertainty remains for producers around the types of climate-smart practices that will enable them to reduce their carbon footprint while remaining economically viable.
Without a thorough understanding of the costs and risks, pressures, or requirements to implement climate-smart practices may inadvertently drive consolidation and the accelerated loss of small to medium sized farms.
What Did We Do?
Utilizing Washington state dairy facility data, I conducted an economic cost benefit analysis of two climate-smart practices that capture GHGs from anaerobic storage: anaerobic digestors and the covered lagoon and flare system and the size of operation needed to implement both practices based on current and historic market conditions and technology costs. Private and public investment in climate-smart practices can have a substantial impact on whether they are economically feasible for producers to implement. I considered the impacts of various levels of cost-share on the size of farm able to adopt the technology based on several economic indicators.
What Have We Learned?
Most dairy farms cannot simply raise their prices to offset the costs of climate-smart practices, therefore it is critical to understand the broad economic impacts of imposing emissions reductions mandates. With consolidation being a well-documented trend across dairy farms in the United States, it is possible that climate regulations will only further exacerbate this trend due to the high capital costs and market risk associated with climate-smart farming that only facilities of scale can take on.
Future Plans
I am actively assisting research right now in Washington state with university and private researchers into dairy farm carbon intensities, across various farm sizes and facility types. An overview of this research may be available by Summer of 2025. Once this work is completed, we will have a better understanding of overall farm emissions and what climate-smart practices may be necessary for farms to implement to help achieve cooperative net zero targets.
Authors
Presenting & corresponding author
Nina Gibson, Agricultural Economist and Policy Specialist, Washington State Department of Agriculture, KGibson@agr.wa.gov
The authors are solely responsible for the content of these proceedings. The technical information does not necessarily reflect the official position of the sponsoring agencies or institutions represented by planning committee members, and inclusion and distribution herein does not constitute an endorsement of views expressed by the same. Printed materials included herein are not refereed publications. Citations should appear as follows. EXAMPLE: Authors. 2025. Title of presentation. Waste to Worth. Boise, ID. April 7–11, 2025. URL of this page. Accessed on: today’s date.
According to the latest estimation of Food and Agriculture Organization of the United Nations, the global dairy cattle stocks reached over 265 million in 2019. The massive stocks of dairy cows excrete an enormous amount of manure, which is a huge burden to the environment if unproperly disposed of, thus necessitating proper manure treatment. As such, anaerobic digestion (AD) has been widely adopted as a practice to manage dairy cattle manure. Within the United States, digesters at dairy farms started to be widely constructed after 2000, and the number of these on-farm digesters in operation or under construction has increased to over 400 in 2024. During the AD treatment of dairy manure, the sulfate-reducing microorganisms are active under anaerobic conditions, therefore high levels of hydrogen sulfide (H₂S) are common in biogas because of the degradation and conversion of sulfur-bearing organics in feeding materials and sulfate-bearing minerals in bedding materials within the manure stream. As an extremely toxic gas with an acute rotten egg odor, H₂S is one of the leading causes of workplace gas inhalation deaths in the US according to the Bureau of Labor Statistics. In addition to the health risks, high H₂S levels can be also very corrosive to the equipment and infrastructure: long-term exposure to concentration of H₂S greater than 1 ppm reduces the lifespan of structural materials, equipment, and electronic devices inside the facilities. Therefore, it is an urgent task to mitigate the H₂S emissions in manure management.
Conventional H₂S removal technologies typically include two categories, namely ex-situ and in-situ. The ex-situ biogas cleaning technologies (e.g., biofilters, aqueous solutions, iron sponge, etc.) require a separate unit to house the facilities and are chemical- and energy-intensive. In-situ H₂S mitigation methods usually require less energy and chemical input as well as an easier operation. In our previous study which employed bio-electrochemical (BEC) treatment concurrently with AD of dairy manure, a H₂S removal efficiency of over 95% was successfully achieved, thus offering a very promising in-situ H₂S remediation method. Nonetheless, it was operated in a continuous mode with electrodes inserted into the digester, which would require significant modification of existing AD systems when scaled up. Therefore, developing new strategies that can advance the application of BEC H₂S remediation within the conventional AD system is critical.
What Did We Do?
Most large sized farms collect liquid manure and slurry in a reception pit (or transition pit) before manure is pumped to the anaerobic digesters. This pit is usually open to the air, thereby offering a great opportunity to integrate the BEC treatment in dairy manure management. In the present lab-scale study, a BEC unit was applied to pretreat the dairy manure collected from the transition pit. On the basis of our previous study, a combination of low carbon steel (LCS) anode and stainless-steel cathode was selected as the electrode pair. At the applied voltages of 1.0-2.5 V, the dairy manure was pretreated for 24 hours prior to AD tests. After the BEC pretreatment, the peak H₂S concentration in the biogas was reduced from approximately 6,000 ppm (in the control without BEC pretreatment) to below 420 ppm in the groups at the applied voltages over 1.5 V. The total H₂S removal efficiencies reached 48.9%, 89.1%, 98.5%, and 100% at 1.0 V, 1.5 V, 2.0 V, and 2.5 V, respectively, equivalent to the sulfide removal of 18.6, 33.4, 36.9, and 37.4 mg S²⁻/g wet dairy manure. Nonetheless, higher voltages did not trigger higher biogas production. Besides, due to the anodic oxidation that released some CO₂ and the precipitation of carbonate (e.g., CaCO₃) in BEC pretreatment, the CH₄ contents in the yielded biogas from BEC groups (64.5-65.6%) were all slightly higher than that from the control (63.4%). Moreover, it was noteworthy that the technical digestion time (T80) (i.e., the time needed to produce 80% of the maximal digester gas production) was shortened to 28.0-29.3 d in the BEC groups at 1.5-2.5 V as compared to 32.8 d in the control. This suggests that the BEC pretreatment can remarkably accelerate biogas production in addition to the H₂S remediation. Groups using non-sacrificial electrodes (e.g., graphite sheets and rods) were also established for the 24-h BEC pretreatment of dairy manure. However, in subsequent AD tests, a large quantity of gaseous H₂S was still emitted. The comparison between the groups with and without sacrificial LCS anodes indicates that the formation of insoluble ferrous sulfide (FeS) was the main route of sulfide removal, whereas the contribution of anodic sulfide oxidation to sulfate and elemental sulfur was relatively limited.
With all the selections and optimizations above, a pilot-scale electrochemical unit was accordingly designed and then installed and operated in the dairy manure pit in a local dairy farm in Minnesota for over two months (as shown in Fig. 1), and its effects in in-situ H₂S remediation in a real application scenario were documented. This pilot-scale BEC system reduced the headspace H₂S level from 1,808 ppb to 390 ppb with a removal efficiency of 78.4%.
Fig. 1 Pilot-scale BEC system installation and operation in dairy manure transition pit
What Have We Learned?
This lab-scale success as well as the pilot-scale implementation supports BEC as a promising method for integration into existing on-farm AD systems treating dairy manure. With its incorporation of a BEC unit into the open-air manure transition pit, the operation could be simplified to a large extent without the considerable modification of existing AD systems, whilst the H₂S remediation and the improvement in biogas production (in both CH₄ content and technical digestion time) could be simultaneously achieved at an optimum applied voltage. In summary, this proposed BEC system can successfully reduce the H₂S and improve the safety of a dairy farm during manure storage and treatment.
Future Plans
In our future research, we will further assess the sulfur distribution and microbial community changes after both lab-scale and pilot-scale BEC treatment and also optimize the BEC strategy to reduce anode consumption. Besides, a techno-economic analysis and a life cycle assessment are now under evaluation, based on the data obtained through both the lab-scale tests and the pilot-scale demonstration, to further explore the feasibility and applicability of a full-scale BEC system in a real dairy farm scenario.
Authors
Presenting author
Lingkan Ding, Researcher Pro 5, University of Minnesota
Corresponding author
Bo Hu, Professor, University of Minnesota, bhu@umn.edu
Acknowledgements
The authors greatly appreciate funding support from USDA NRCS Conservation Innovation Grant (NR213A750013G029) and the assistance of Dennis Haubenschild for on-site work on the farm.
The authors are solely responsible for the content of these proceedings. The technical information does not necessarily reflect the official position of the sponsoring agencies or institutions represented by planning committee members, and inclusion and distribution herein does not constitute an endorsement of views expressed by the same. Printed materials included herein are not refereed publications. Citations should appear as follows. EXAMPLE: Authors. 2025. Title of presentation. Waste to Worth. Boise, ID. April 7-11, 2025. URL of this page. Accessed on: today’s date.
Anaerobic digestion (AD) is commonly used in agriculture to break down livestock manure and produce a sustainable source of energy by producing biogas, which is predominantly methane. Digestion of livestock manure can be supplemented with additional agricultural or industrial organic waste, potentially adding sources of revenue to the farm or digestion facility through tipping fees and additional biogas production. However, quantifying the anticipated impact on digester performance and operation is challenging, particularly as some potential feedstocks have not been studied previously. Understanding how a feedstock might impact a digester’s performance is critical, as digester upsets can lead to loss of revenue or even digester failure.
What Did We Do?
We conducted a set of mono-digestion biomethane potential experiments of several feedstocks currently in use at an agricultural AD facility that accepts mixed industrial waste streams in addition to digesting beef manure. The mono-digestion studies used triplicate 1-L working volume batch digesters which ran for 30-38 days. We tested beef manure, off-spec starch from food manufacturing, slaughterhouse wastewater treatment sludge, waste activated sludge from a corn processing facility, soap stock from glycerin refining, filter press slurry from a food grade water treatment facility, and food waste dissolved air flotation sludge. We also included a treatment for the effluent from the digester’s ammonia recovery system and a mixture of all the feedstocks at the same time. A blank (inoculum only) and positive control (cellulose with inoculum) digester were included as controls. This set of studies is described here as Experiment 1 (E1).
We then conducted a set of co-digestion biomethane potential tests combining the manure pairwise with some of the industrial feedstocks, specifically starch, slaughterhouse waste, soap stock, and filter press slurry (Experiment 2 or E2). These combinations were made at two different ratios of the two feedstocks. The first set of treatments combined the manure and an additional substrate at a 1:1 ratio on a volatile solids basis. The second set of treatments combined the feedstocks proportional to the amounts commonly used in the AD facility providing the materials. A final treatment pairing starch and soap stock at a 3:1 ratio was also included. These co-digestion treatments were conducted in triplicate alongside a single mono-digestion treatment of each feedstock for comparison. Finally, we examined the potential synergistic or antagonistic impacts of these combinations on methane yield and production rate. This was done by comparing the measured methane production at each time point compared to the expected methane production if the feedstocks each contributed additively to the methane production.
What Have We Learned?
Figure 1 shows the cumulative specific biogas production on a volatile solids basis for the mono-digestion experiment (E1). Some feedstocks, such as soap stock and slaughterhouse waste, experienced a substantial lag phase at the beginning of the experiment, which may have been due to the high levels of lipids and proteins.
Figure 1: Average biogas production of all treatments during mono-digestion experiment (Experiment 1).
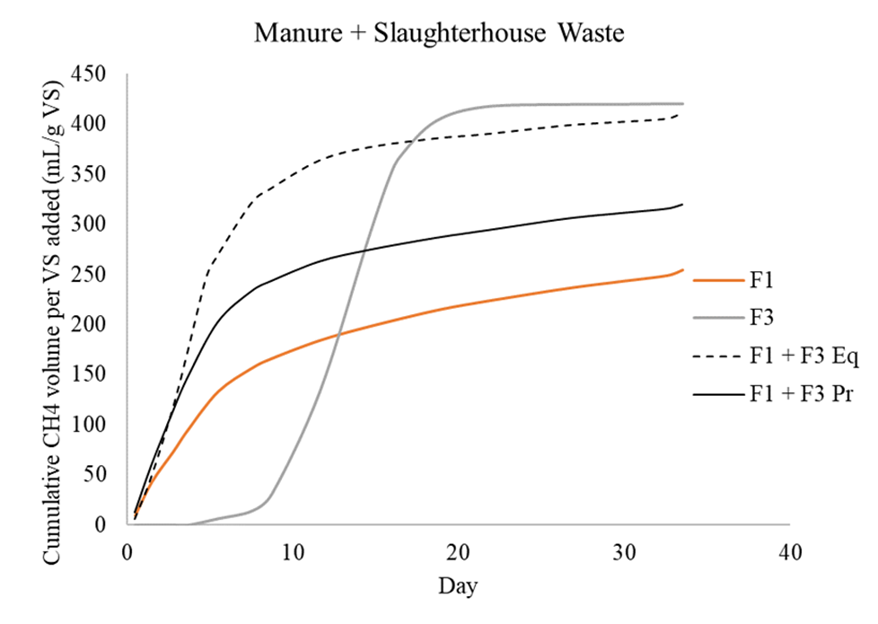
During the co-digestion experiment (E2), we observed both total yield and kinetic synergy in all treatments. Only two digesters (one of the replicates from the starch and manure proportional treatment and one from the starch and soap stock treatment) produced substantially less (<30%) methane than would be expected for an additive effect for more than one day. This effect can be seen in Figure 2, which shows the cumulative methane curves (corrected for inoculum contribution and averaged over the three replicates) of the mono-digestion digesters for manure and starch individually and the curves for both co-digestion treatments using both manure and starch. Figure 3 shows the same curves for the co-digestion of manure and slaughterhouse waste. These co-digestion treatments show that combining the feedstocks causes an increase in methane production at a faster rate. They also show that co-digestion alleviates the lag phase experienced by the slaughterhouse waste.
Figure 2: Cumulative specific methane production for manure (F1) and starch (F2). F1 + F2 Eq = 1:1 ratio of VS; F1 + F2 Pr = ratio of VS is proportional to what full-scale digester receives.Figure 3: Cumulative specific methane production for manure (F1) and slaughterhouse waste (F3). F1 + F3 Eq = 1:1 ratio of VS; F1 + F3 Pr = ratio of VS is proportional to what full-scale digester receives.
Future Plans
We plan to continue exploring the impact of co-digestion on methane yield and production rate by using additional combinations of these feedstocks and exploring the impact of macromolecular composition (percentages of carbohydrates, proteins, and lipids) on synergistic effects. These results will help inform current or future agricultural AD operators regarding the use of co-digestion feedstocks for optimal energy production and best practices in selecting new feedstocks for co-digestion.
Authors
Jennifer Rackliffe, Graduate Research Fellow, Purdue University
This material is based upon work that is supported by the National Institute of Food and Agriculture, U.S. Department of Agriculture, under agreement number 2020-38640-31522 through the North Central Region SARE program under project number GNC21-334. USDA is an equal opportunity employer and service provider. Any opinions, findings, conclusions, or recommendations expressed in this publication are those of the author(s) and do not necessarily reflect the view of the U.S. Department of Agriculture. We also thank Purdue’s Institute for Climate, Environment and Sustainability for supporting the dissemination of this work. Finally, we acknowledge the assistance of Gabrielle Koel, Kyra Keenan, Amanda Pisarczyk, and Emily McGlothlin in conducting the laboratory work.
The authors are solely responsible for the content of these proceedings. The technical information does not necessarily reflect the official position of the sponsoring agencies or institutions represented by planning committee members, and inclusion and distribution herein does not constitute an endorsement of views expressed by the same. Printed materials included herein are not refereed publications. Citations should appear as follows. EXAMPLE: Authors. 2022. Title of presentation. Waste to Worth. Oregon, OH. April 18-22, 2022. URL of this page. Accessed on: today’s date.
Co-digestion of organic material with dairy manure represents an opportunity to provide both a revenue stream to anaerobic digester operations, through the collection of a tipping fee and/or increased biogas/electricity production, as well as a means for waste generators to dispose of their product in a beneficial way.
However, there are many factors for an operator to consider when deciding on whether to accept organic waste. A major consideration is the volume of biogas that the material will generate when co-digested. This can be used both to assign a value to the waste through increased biogas production and/or electricity sales, as well as to size equipment for producing, treating and potentially selling/using the biogas. Estimating the biogas produced is a complicated process, encompassing many different factors of digester design, waste characteristics, and environmental factors.
To assist in this estimation, we have developed software that allows a user to predict the biogas production from mixed wastes and dairy manure based on changing herd sizes, as well as providing the ability to vary the timing and volume of addition of multiple organic wastes, throughout the course of a simulated year. With this user-friendly tool, we hope to enable producers to better explore the opportunities that co-digestion offers.
What Did We Do?
The originally developed Cornell Anaerobic Digester Simulations software allowed the user to input a herd size and to select how much (if any) of seven wastes would be co-digested with the dairy manure. This rudimentary method of simulation assumed that the same volume/mass would be applied to the digester in a steady-state constant fashion for the entire year that the simulations were run for. However, that is unlikely to be the case in a real-world production environment.
In the new version of the software, we have incorporated the characteristics of over 200 wastes into a user selectable interface. Once a waste type is selected, the user has the option to select when the waste is placed into the digester, whether that be on an everyday, weekly, monthly or custom basis with the option to select to which months of the year the additions occur. When selecting a weekly or monthly basis, the user can select which day(s) of the week or month wastes are added, and in the custom basis, the user can select which days of the year additions occur.
Once the timing of addition is completed, the user can select how much of the waste is applied during each addition. Whether that be a constant volume for each addition, or a custom volume for each addition.
The data for the specific wastes includes the dry matter and organic matter content as well as the biogas and methane yields. Based on the type of waste we have also assigned a “digestibility” curve to the particular waste which when assuming a first order kinetic model of gas production, can provide the production of gas a function of time. The production of biogas from all added wastes and the added manure is then summed for each day of the year to provide an estimate of the biogas production, on a daily basis, that can be summarized with a minimum/maximum/average on a monthly and annual basis.
What Have We Learned?
During the process of developing the software, we examined a few different techniques for estimating the timing of biogas production from co-digested wastes. There are more complicated models available such as Anaerobic Digestion Model #1 (ADM1), however many more parameters must be known/estimated for each waste type, (not to mention requiring a much more complicated user interface). We felt that using a simplified first order kinetic model provides a good way to add the necessary complexity to model biogas production over time without overly complicated calculations. The simplification allowed us to include a more complicated and yet more real world means of modeling the addition of wastes to a digester that wouldn’t be possible with more complicated digestion/biogas production models.
Future Plans
Currently, the Cornell Dairy Anaerobic Digestion Simulation Software is capable of predicting the amount of heat necessary to maintain digester temperatures, as well as the parasitic electrical load. Future additions will include modeling the energy usage (and effects on biogas) of treatment processes to produce Renewable Natural Gas (RNG) from biogas.
We would also like to include the ability to track nutrients through the process of digestion. Nutrient additions from the co-digestion of wastes also represent an important consideration for farm as they may or may not have the land base/crop requirements to use all of the imported nutrients. The cost of treatment of the effluent from the digester to remove nutrients, or the shipment of effluent off site may have to be added into the determination of how much of a “tipping fee” a farmer would need to charge for taking an organic waste for co-digestion.
We hope to make the program freely available to the public to use. Currently, the software is written in MATLAB which ordinarily requires a license to operate, however it is possible to create an executable standalone program that can be shared and run without the need to purchase MATLAB.
Authors
Timothy Shelford, Extension Associate, School of Integrated Plant Science, Cornell University
Corresponding author email address
tjs47@cornell.edu
Additional authors
Curt Gooch, Senior Extension Associate Emeritus, Department of Biological and Environmental Engineering, Cornell University
Peter Wright, Agricultural Engineer, Department of Animal Science, Cornell University
Lauren Ray, Agricultural Energy Systems Engineer, Cornell University
The authors are solely responsible for the content of these proceedings. The technical information does not necessarily reflect the official position of the sponsoring agencies or institutions represented by planning committee members, and inclusion and distribution herein does not constitute an endorsement of views expressed by the same. Printed materials included herein are not refereed publications. Citations should appear as follows. EXAMPLE: Authors. 2022. Title of presentation. Waste to Worth. Oregon, OH. April 18-22, 2022. URL of this page. Accessed on: today’s date.
Anaerobic digestion (AD) speeds up natural degradation of manure during storage, reduces odor, and produces energy by capturing methane. After AD, wastewater can be utilized on farms as a crop fertilizer and irrigation, and solids can be used for animal bedding.
Manure can be environmentally problematic and a reservoir of infectious agents (Guan et al., 2003). Previous studies have shown that anaerobic digestion of dairy manure decreases concentrations of viable fecal bacteria known to cause zoonotic diseases, notably E. coli and Salmonella (Aitken et al., 2007; Frear et al., 2011; Pandey and Soupir, 2011; Manyi-Loh et al., 2014; Chiapetta et al., 2019)
This study’s objective was to characterize and compare genetic changes in pathogens pre- and post-AD as evaluated by metabolic changes (sugar fermentation) or antimicrobial resistance to antibiotics. Generic E. coli (GEC) and Salmonella were selected for evaluation in this study as both are known to cause food borne and zoonotic disease. While a limited number of specific bacteria have been studied, AD has shown efficacy in pathogen reduction for both GEC and Salmonella. Characterizing these bacteria in AD influent and effluent can more firmly establish the efficacy of AD for reducing potential risks to human and animal health posed by these pathogens. We hypothesized that GEC and Salmonella would meet the 75% threshold of genetic similarity (post-AD vs pre-AD), suggesting limited mutation and lowered risk of AD creating resistant strain.
What Did We Do
An anaerobic digester (AD) in Monroe, WA was utilized from December 2008 through March 2010 to assess its effects on the survival and adaptation of pathogens in dairy manure (Chiapetta et al., 2019). The AD was a plug-flow design with a capacity of approximately 6.1million liters that was operated at ~38°C for a 17-day retention time. Inputs to the AD were comprised of 70% dairy cow manure and 30% pre-consumer food wastes from the dairy farm where the AD was located and from local food processors, respectively. Salmonella and general E. coli (GEC) were isolated from samples collected before and after AD. GEC isolates were characterized by sugar fermentation profiles (adonitol, dulcitol, melibiose, raffinose, rhamnose, salicin, sorbose, sucrose and the indicator medias MAC and MUG) and genetically compared using repetitive extragenic palindromic chain reaction (REP-PCR) followed by Ward’s cluster analysis. Salmonella were separated into serogroups. The Kirby Bauer disk diffusion method was used to identify antibiotic resistance (AMR). Antibiotics used were: ampicillin, chloramphenicol, gentamycin, amikacin, kanamycin, sulfamethaxazole/triemthroprim, streptomycin, tetracycline, amoxicillin/clavulanic acid, nalidixic, sulfisoxazole, and ceftazidime.
What Have We Learned
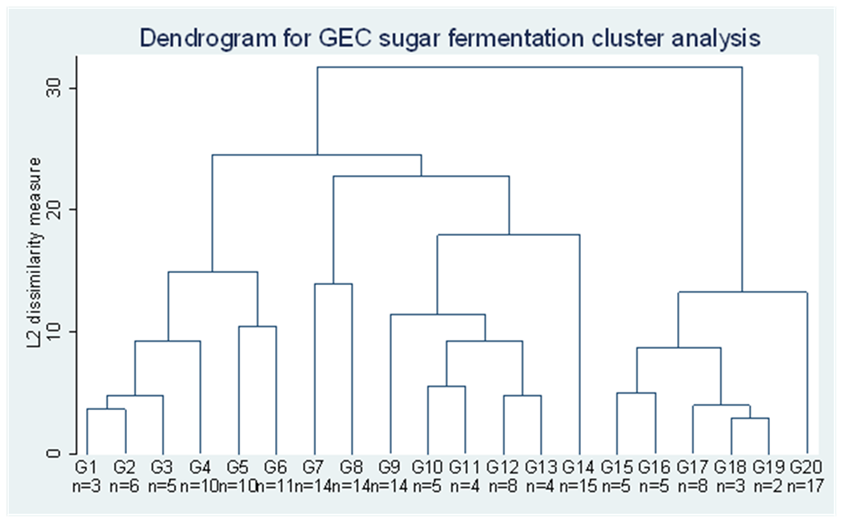
Antibiotic resistant GEC isolates were isolated from 22.3% and 19.1% of pre- and post-AD samples, respectively, and were observed to be genetically similar after clustering for sugar fermentation. Analysis of genetic similarity using the Pearson’s chi square method (e.g. likelihood–ratio) revealed that AD status (pre- vs. post AD) antibiotic resistance was not statistically significantly associated with AD (Figure 1, Table). Any effect of AD on AMR was dependent on grouping based on % genetic similarity.
Genetic analysis (REPPCR for GEC) yielded similar results, following a Pearson’s Chi Square test of log likelihood it was determined that AD status (pre- vs. post AD) and AMR were not significantly associated (Figure 1). Any effect of AD on AMR was dependent on grouping (Table 1).
Salmonella predominant serogroups (Table 2) (B, C1, and E1) remained at 23%, 9%, and 2% AMR pre- and post-AD. Analyses showed a significant interaction between Salmonella serogroup vs. source (p=0.0004) and serogroup vs. AMR (p<0.0001). No interaction was observed between source (pre- or post-AD) and AMR for Salmonella, p=0.12. There was no uniform effect for Salmonella as a group based on AD.
In summary, GEC sampled pre- and post-AD showed no difference in sugar fermentation, nor significant genetic dissimilarity, nor antibiotic resistance. Salmonella serotypes were observed to be equally or inconsistently effected by AD. Overall, the evidence suggests that anaerobic digestion does not create antibiotic resistant GEC and Salmonella.
Figure 1. Dendrogram of the sugar fermentation cluster analysis of generic E. coli. G= group based on sugar fermentation similarity, and n= number of isolates within each group.
Running a Chi Square on that: AD status (pre- vs. post AD) antibiotic resistance was not statistically significantly associated with this set of fermentation cluster memberships.
*Am = Ampicillin, C= Chloramphenicol, CF = Ceftiofur, S = Streptomycin, G = Sulfasoxizole, Te = Tetracycline, Amc = Amoxycillin clavulanic acid
(fisher.test(tbl, simulate.p.value = TRUE, B = 1e5)
Fisher’s Exact Test for Count Data with simulated p-value (based on 1e+05 replicates)
p-value = 0.104
If no selection is occurring, output equals input, so at P < 0.1 is a trend for a selective process.
Table 2 – Salmonella – Number of susceptible or resistant bacteria
Serogroup
Pre-AD Susceptible
Pre-AD Resistant
Post-AD Susceptible
Post-AD Resistant
B
6
1
1
10
C1
12
4
14
0
C2
1
8
0
0
E1
34
0
50
0
K
4
2
2
2
Total
57
65
29
12
%
47
53
71
29
Configuration 1 SeroGrp*ABResist = best fits – association (interaction) of serogroup and resistance
Configuration 2 SeroGrp*PrePost = best fits – association (interaction) of serogroup and pre- post AD, but is conditioned by whether it is resistant
Goodness-of-fit Summary Statistics
Statistic
Chi-Sq
DF
P
Pearson
6.91
5
0.2276
Likelihood
8.67
5
0.1230
Freeman-Turkey
8.28
5
0.1416
Number of Near Zero Expected Cells 4
Three observations were made:
a serotype may become more resistant as it goes through the AD
a serotype may become less resistant, or
a serotype may not survive.
Authors
J. H. Harrison – Livestock Nutrient Management Specialist, Department of Animal Sciences, Washington State University Puyallup Research and Extension Center
jhharrison@wsu.edu
Additional Authors
J. Gay – Department of Veterinary Clinical Medicine, Washington State University, Pullman, WA
R. McClannahan – Facility Manager – Integrated Research and Innovation Center – University of Idaho, Moscow, ID
E. Whitefield – Research and Outreach Specialist Department of Animal Sciences, Washington State University Puyallup Research and Extension Center
References
Aitken M. D., M. D.Sobsey, M. D., N. A.Van Abel, K. E.Blauth, D. R.Singleton, P. L.Crunk, C.Nichols, G. W.Walters, and M.Schneider. 2007. Inactivation of Escherichia coli O157:H7 during thermophilic anaerobic digestion of manure from dairy cattle. Water Res. 41:1659-1666. doi:10.1016/j.watres.2007.01.034.
Chiapetta, H., Harrison, J. H., Gay, J., McClanahan, R., Whitefield, E., Evermann, J., Nennich, T., Gamroth, M. (2019). Reduction of pathogens in bovine manure in three full scale commercial anaerobic digesters. Water, Air, and Soil Pollution, 230:111.
Frear C., W.Liao, T.Ewing, and S.Chen. 2011. Evaluation of co-digestion at a commercial dairy anaerobic digester. Clean—Soil, Air, Water. 39:697-704. doi:10.1002/clen.201000316.
Guan T. Y., and R. A.Holley. 2003. Pathogen survival in swine manure environments and transmission of human enteric illness—a review. J. Environ. Qual. 32:383-392.
Manyi-Loh C. E., S. N.Manphweli, E. L.Meyer, A. I.Okoh, G.Makaka, and M.Simon. 2014. Inactivation of selected bacterial pathogens in dairy cattle manure by mesophilic anaerobic digestion (balloon type digester). Int. J. Environ. Res. Public Health. 11:7184-7194. doi:10.3390/ijerph110707184.
Pandey P. K., and M.L.Soupir. 2011. Escherichia coli inactivation kinetics in anaerobic digestion of dairy manure under moderate, mesophilic, and thermophilic temperatures. AMB Express. 1:18. doi:10.1186/2191-0855-1-18.
The authors are solely responsible for the content of these proceedings. The technical information does not necessarily reflect the official position of the sponsoring agencies or institutions represented by planning committee members, and inclusion and distribution herein does not constitute an endorsement of views expressed by the same. Printed materials included herein are not refereed publications. Citations should appear as follows. EXAMPLE: Authors. 2022. Title of presentation. Waste to Worth. Oregon, OH. April 18-22, 2022. URL of this page. Accessed on: today’s date.
Manage Cookie Consent
To provide the best experiences, we use technologies like cookies to store and/or access device information. Consenting to these technologies will allow us to process data such as browsing behavior or unique IDs on this site. Not consenting or withdrawing consent, may adversely affect certain features and functions.
Functional
Always active
The technical storage or access is strictly necessary for the legitimate purpose of enabling the use of a specific service explicitly requested by the subscriber or user, or for the sole purpose of carrying out the transmission of a communication over an electronic communications network.
Preferences
The technical storage or access is necessary for the legitimate purpose of storing preferences that are not requested by the subscriber or user.
Statistics
The technical storage or access that is used exclusively for statistical purposes.The technical storage or access that is used exclusively for anonymous statistical purposes. Without a subpoena, voluntary compliance on the part of your Internet Service Provider, or additional records from a third party, information stored or retrieved for this purpose alone cannot usually be used to identify you.
Marketing
The technical storage or access is required to create user profiles to send advertising, or to track the user on a website or across several websites for similar marketing purposes.