Manure from beef feedlot productions can be managed through a diversity of strategies. When choosing from the possible scenarios the main factors influencing the decision are financial, logistical or from a regulatory fulfillment focus, however it is necessary to consider the environmental impact generated from the manure management system in order to generate less burdens on behalf of meat production. One of the most reliable methodologies for this matter is Life Cycle Assessment (LCA), which considers every input and output throughout the process and will calculate environmental emissions quantitatively. In this study we compared various LCA studies of beef lot manure management processes, with the aim of understanding the different systems´ hotspots and global emissions so that these can be considered when establishing a manure management system in similar facilities.
What Did We Do?
We gathered LCA studies published from peer-reviewed scientific journals that assessed the environmental impact of beef manure management. The search terms taken into account were “LCA and beef manure” and “LCA and feedlot manure”. To enable comparison between studies the following criterion were considered for inclusion: a) manure collected from intensive feedlot facilities b) results reporting at least global warming potential.
In order to categorize emissions generated from the entire manure life cycle we established four stages of manure management: Feedlot, transport, storage/transformation and use/disposal. Next, we identified which of these stages were taken into account in each study and if emissions were reported for stages individually as well as globally. Lastly, a comparison between LCAs was conducted for which we converted the functional units reported in the references to 1 ton of manure (dry basis). With this we can visualize the emissions generated from every ton of dry manure that enters the system despite the functionality to which it´s destined.
What Have We Learned?
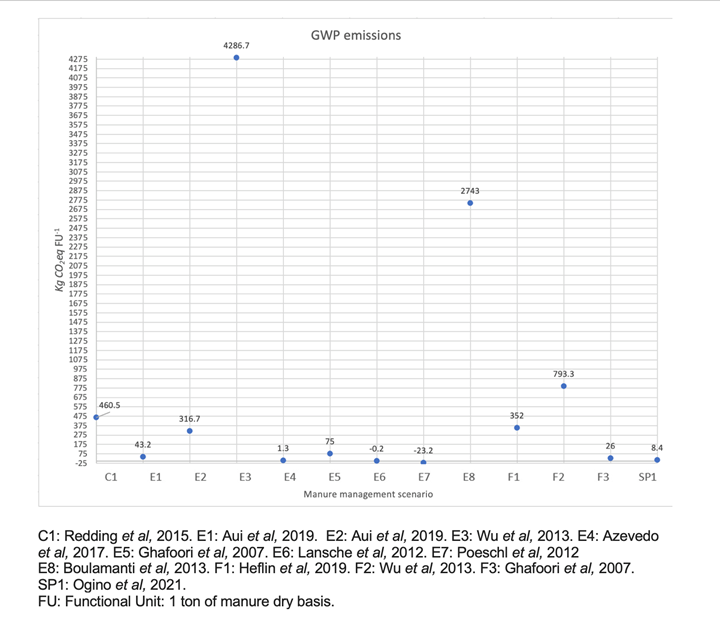
The final review included 14 references which resulted in 19 scenarios evaluated, ranging from 2007 to 2021. Initially we noted that the system with the greatest number of evaluations performed was the transformation of manure into an energetic resource (E), with 12 of the 19 scenarios being focused on energy generation through manure treatment processes, emphasizing that the current trends are not only leaning towards a better manure use but also cleaner energy sources. On the counter part, composting (C) and stockpiling (SP) are the two least evaluated scenarios through LCA (just once in the articles present in this review). Manure composting and stockpiling aren´t perceived as innovative solutions when aiming to mitigate emissions, but shouldn´t be left aside when performing evaluations, since they´re the most applied techniques for feedlot manure management.
The energetic evaluations represented both, the most (E3) and the least emissions (E7) through the whole process. This is because bioenergetic sources, such as the one generated from manure transformation, frequently are given environmental credits and therefore negative emission values considering the substitution of other energetic resources. In this review 10 of the 12 energetic scenarios considered emission reduction by substitution, but not because the actual process generated less amount of greenhouse gases in itself. Energy production from manure is, in many cases assessed as a life cycle for transformation and excluding other stages of the entire management system. In fact, apart from the kind of treatment only 21.4% of all the LCAs considered in this study included all four stages. Since two of them (Lansche et al, 2012; Van Stappen et al, 2016) mentioned that the best mitigation emission option was to reduce storage time, and one (Giwa et al, 2017) reported the largest emissions coming from transportation we can assume that both, storage and transport are important stages when looking at sources of emissions and should not be left aside.
The difference between emissions between different manure management systems can be as extreme as 4,000X depending on system boundaries, allocation procedures, emission factors, environmental credits, amongst others. When evaluating a manure management system, it is necessary to consider every stage and so that emission reduction can be addressed in the whole process hotspots and not only during the transformation of organic matter.
Future Plans
To conduct an attributional LCA of beef feedlot manure management system as a case study. With this we will contribute more data to contrast composting or stockpiling scenarios and address the weight of the different manure management in a feedlot facility. Also, we will report eutrophication potential and water depletion, as their importance in the environmental impacts of manure management is well known and should be considered when decisions are being made.
Authors
Andrea Wingartz, National Autonomous University of Mexico
Corresponding author email address
anwiot@gmail.com
Additional author
PhD. Rafael Olea Pérez, National Autonomous University of Mexico
Animal production is part of a larger agricultural nutrient recycling system that includes soil, water, plants, animals and livestock excreta. When inefficient storage or utilization of nutrients occurs, parts of this cycle become overloaded. The U.S. Beef industry has made great strides in improving production efficiency with a significant emphasis on improving feed efficiency. Improved feed efficiency results in fewer excreted nutrients and volatile organic compounds (VOC) that impair environmental quality. Anabolic steroids are used to improve nutrient feed efficiency which increases nitrogen retention and reduces nitrogen excretion. This study was conducted to determine the methane (CH4), carbon dioxide (CO2), nitrous oxide (N2O), odorous VOCs, ammonia (NH3), and hydrogen sulfide (H2S) production from beef cattle manure and urine when aggressive steroid implants strategies were used instead of moderate implant strategies.
What Did We Do?
Two groups of beef steers (60 animals per group) were implanted using two levels of implants (moderate or aggressive). This was replicated three times, twice with spring-born calves and once with fall-born calves, for a total of 360 animals used during the study. Both moderate and aggressive treatment groups received the same initial implant that contain 80 mg trenbolone acetate and 16 mg estradiol. At second implant, steers in the moderate group received an implant that contained 120 mg trenbolone acetate and 24 mg estradiol, while those in the aggressive group received an implant that contained 200 mg trenbolone acetate and 20 mg estradiol. Urine and feces samples were collected individually from 60 animals that received a moderate implant and 60 animals that received an aggressive implant at each of three sampling dates (Spring and Fall 2017 and Spring 2018). Within each treatment, fresh urine and feces from five animals were mixed together to make a composite sample slurry (2:1 ratio of manure:urine) and placed in a petri dish. There were seven composite mixtures for each treatment at each sampling date. Wind tunnels were used to pull air over the petri dishes. Ammonia, carbon dioxide, and nitrous oxide concentrations were measured using an Innova 1412 Photoacoustic Gas Analyzer. Hydrogen sulfide and methane were measured using a Thermo Fisher Scientific 450i and 55i, respectively. Gas measurements were taken a minimum of six times over 24- to 27-day sampling periods.
What Have We Learned?
Flux of ammonia, hydrogen sulfide, methane, nitrous oxide, and total aromatic volatile organic compounds were significantly lower when an aggressive implant strategy was used compared to a moderate implant strategy. However, the flux of total branched-chained volatile organic compounds from the manure increased when aggressive implants were used compared to moderate implants. Overall, this study suggests that air quality may be improved when an aggressive implant is used in beef feedlot animals.
Table 1. Overall average flux of compounds from manure (urine + feces) from beef feedlot cattle implanted with a moderatea or aggressiveb anabolic steroid.
Hydrogen Sulfide
Ammonia
Methane
Carbon Dioxide
Nitrous Oxide
Total Sulfidesc
Total SCFAd
Total BCFAe
Total Aromaticsf
µg m-2 min-1
——–mg m-2 min-1——–
Moderate
4.0±0.1
2489.7±53.0
117.9±4.0
8795±138
8.6±0.1
0.7±0.1
65.2±6.6
5.9±0.5
2.9±0.3
Aggressive
2.7±0.2
2186.4±46.2
104.0±3.8
8055±101
7.4±0.1
0.8±0.1
63.4±5.7
7.6±0.8
2.1±0.2
P-value
0.01
0.04
0.01
0.01
0.01
0.47
0.83
0.05
0.04
aModerate treatment = 120 mg trenbolone acetate and 24 mg estradiol at second implant; bAggressive treatment = 200 mg trenbolone acetate and 20 mg estradiol at second implant; cTotal sulfides = dimethyldisulfide and dimethyltrisulfide; dTotal straight-chained fatty acids (SCFA) = acetic acid, propionic acid, butyric acid, valeric acid, hexanoic acid, and heptanoic acid; eTotal branch-chained fatty acids (BCFA) = isobutyric acid and isovaleric acid; fTotal aromatics = phenol, 4-methylphenol, 4-ethylphenol, indole, and skatole
Future Plans Urine and fecal samples are being evaluated to determine the concentration of steroid residues in the livestock waste and the nutrient content (nitrogen, phosphorus, potassium and sulfur) of the urine and feces.
Authors
mindy.spiehs@ars.usda.gov Mindy J. Spiehs, Research Animal Scientist, USDA ARS Meat Animal Research Center, Clay Center, NE
Bryan L. Woodbury, Agricultural Engineer, USDA ARS Meat Animal Research Center, Clay Center, NE
Kristin E. Hales, Research Animal Scientist, USDA ARS Meat Animal Research Center, Clay Center, NE
Additional Information
Will be included in Proceedings of the 2019 Annual International Meeting of the American Society of Agricultural and Biological Engineers.
USDA is an equal opportunity provider and employer.
Acknowledgements
The authors wish to thank Alan Kruger, Todd Boman, Bobbi Stromer, Brooke Compton, John Holman, Troy Gramke and the USMARC Cattle Operations Crew for assistance with data collection.
The authors are solely responsible for the content of these proceedings. The technical information does not necessarily reflect the official position of the sponsoring agencies or institutions represented by planning committee members, and inclusion and distribution herein does not constitute an endorsement of views expressed by the same. Printed materials included herein are not refereed publications. Citations should appear as follows. EXAMPLE: Authors. 2019. Title of presentation. Waste to Worth. Minneapolis, MN. April 22-26, 2019. URL of this page. Accessed on: today’s date.
Ionophores are a type of antibiotics that are used in cattle production to shift ruminal fermentation patterns. They do not kill bacteria, but inhibit their ability to function and reproduce. In the cattle rumen, acetate, propionate, and butyrate are the primary volatile fatty acids produced. It is more energetically efficient for the rumen bacteria to produce acetate and use methane as a hydrogen sink rather than propionate. Ionophores inhibit archaea forcing bacteria to produce propionate and butyrate as hydrogen sinks rather than working symbiotically with methanogens to produce methane as a hydrogen sink. Numerous research studies have demonstrated performance advantages when ionophores are fed to beef cattle, but few have considered potential environmental benefits of feeding ionophores. This study was conducted to determine if concentrations of greenhouse gases, odorous volatile organic compounds (VOC), ammonia, and hydrogen sulfide from beef cattle manure could be reduced when an ionophore was fed to finishing cattle.
What Did We Do?
Four pens of feedlot cattle were fed an ionophore (monensin) and four pens received no ionophore (n=30 animals/pen). Samples were collected six times over a two-month period. A minimum of 20 fresh fecal pads were collected from each feedlot pen at each collection. Samples were mixed within pen and a sub-sample was placed in a small wind-tunnel. Duplicate samples for each pen were analyzed. Ammonia, carbon dioxide (CO2), and nitrous oxide (N2O) concentrations were measured using an Innova 1412 Photoacoustic Gas Analyzer. Hydrogen sulfide (H2S) and methane (CH4) were measured using a Thermo Fisher Scientific 450i and 55i, respectively.
What Have We Learned?
Table 1. Overall average concentration of compounds from feces of beef feedlot cattle fed diets with and without monensin.
Total CH4 concentration decreased when monensin was fed. Of the VOCs measured, only total sulfide concentration was lower for the manure from cattle fed monensin compared to those not fed monensin. Ammonia, N2O, CO2, H2S, and all other odorous VOC were similar between the cattle fed monensin and those not fed monensin. The results only account for concentration of gases emitted from the manure and do not take into account any urinary contributions, but indicate little reduction in odors and greenhouse gases when monensin was fed to beef finishing cattle.
Future Plans
A study is planned for April – July 2019 to measure odor and gas emissions from manure (urine and feces mixture) from cattle fed with and without monensin. Measurements will also be collected from the feedlot surface of pens with cattle fed with and without monensin.
Authors
Mindy J. Spiehs, Research Animal Scientist, USDA ARS Meat Animal Research Center, Clay Center, NE
Bryan L. Woodbury, Agricultural Engineer, USDA ARS Meat Animal Research Center, Clay Center, NE
Kristin E. Hales, Research Animal Scientist, USDA ARS Meat Animal Research Center, Clay Center, NE
Additional Information
Dr. Hales also looked at growth performance and E. coli shedding when ionophores were fed to finishing beef cattle. This work is published in Journal of Animal Science.
Hales, K.E., Wells, J., Berry, E.D., Kalchayanand, N., Bono, J.L., Kim, M.S. 2017. The effects of monensin in diets fed to finishing beef steers and heifers on growth performance and fecal shedding of Escherichia coli O157:H7. Journal of Animal Science. 95(8):3738-3744. https://pubmed.ncbi.nlm.nih.gov/28805884/.
USDA is an equal opportunity provider and employer.
Acknowledgements
The authors wish to thank Alan Kruger, Todd Boman, and the USMARC Cattle Operations Crew for assistance with data collection.
The authors are solely responsible for the content of these proceedings. The technical information does not necessarily reflect the official position of the sponsoring agencies or institutions represented by planning committee members, and inclusion and distribution herein does not constitute an endorsement of views expressed by the same. Printed materials included herein are not refereed publications. Citations should appear as follows. EXAMPLE: Authors. 2019. Title of presentation. Waste to Worth. Minneapolis, MN. April 22-26, 2019. URL of this page. Accessed on: today’s date.
The audience will learn about different beef production systems and their performance outcomes. Participants will have the opportunity to expound upon the information shared, inquire with panelists, and actively participate in beef marketing improvements.
Interactive Panel
Moderators
Dr. Megan Webb, Assistant Professor and Beef Production Systems Extension Specialist, University of Minnesota
Ms. Karin Schaefer, Executive Director, Minnesota Beef Council
Panelists
Ms. June Dunn, Field Specialist, Greater Omaha Packing Company
Dr. Alan Rotz, Agricultural Engineer, USDA-ARS Pasture Systems and Watershed Management
Dr. Garrett Steede, Teaching Assistant Professor, Ag. Education, Communication and Marketing, University of Minnesota
The authors are solely responsible for the content of these proceedings. The technical information does not necessarily reflect the official position of the sponsoring agencies or institutions represented by planning committee members, and inclusion and distribution herein does not constitute an endorsement of views expressed by the same. Printed materials included herein are not refereed publications. Citations should appear as follows. EXAMPLE: Authors. 2019. Title of presentation. Waste to Worth. Minneapolis, MN. April 22-26, 2019. URL of this page. Accessed on: today’s date.
There are known benefits and challenges to finishing beef cattle under roof. The accumulated manure is typically stored in either a bedded pack (mixture of bedding and manure) or in a deep pit below a slatted floor. Previous research measured particulate matter, ammonia and other gases in bedded pack barn systems. Deep pit manure storages are expected to have different aerial nutrient losses and manure value compared to solid manure storage and handling. Few studies have looked at concentrations at animal level or aerial/temperature distributions in the animal zone. There is little to no documentation of the air quality impacts of long-term deep pit manure storage in naturally ventilated finishing cattle barns. The objective of this work is to describe the seasonal and spatial variations in aerial ammonia concentrations in deep pit beef cattle barns.
What Did We Do?
We measured ammonia concentrations among four pens in three beef cattle barns oriented east and west with deep pit manure storage during summer and fall conditions in Minnesota. We measured the concentration below the slatted floor (above the manure surface), 4-6 inches above the floor (floor level) and 4 ft above the floor (nose level). While collecting samples from within a pen, we also collected samples from the north and south wall openings surrounding the pen. We collected air and surface temperatures, air speed at cow level, and surface manure samples to supplement the concentration data. We collected measurements three times between 09:00 and 17:00 on sampling days. The cattle (if present) remained in the pen during measurement collection.
All farms had 12 ft deep pits below slatted floors, and pen stocking densities of 22 ft2 per head at capacity. Barn F finished beef cattle breeds under a monoslope roof, in four pens, with feed alleys on north and south side of pens. Two pens shared a common deep pit, and the farm pumped manure from the deep pits 1 week prior to the fall sampling period. Two pens were empty and the other two pens partially filled with cattle during the fall sampling period. Barn H finished dairy steers under a gable roof in a double-wide barn, in twelve pens over a deep pit and two pens with bedded packs, with a feed alley down the center of the barn. Four (east end) and eight (west end) pens shared common deep pits; the bedded pack pens were in the middle of the barn. The farm moved approximately 1 foot of manure from the east end pit to the west end pit one week prior to fall sampling period. Barn R finished dairy steers under a gable roof with four pens and a feed alley on the north side of the pens. All pens shared a common deep pit. Two pens were empty of cattle during the summer and fall sampling periods.
What Have We Learned?
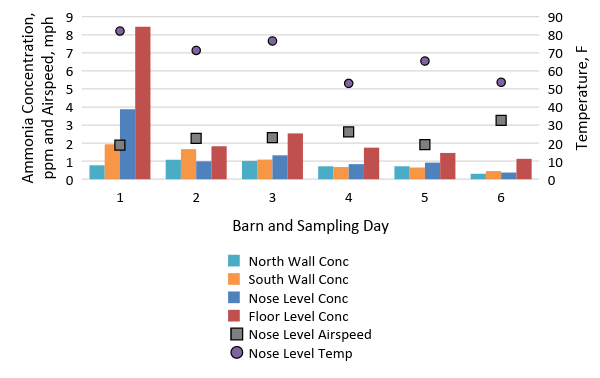
The ammonia concentration levels differed based on the location in the pen area (Figures 1 and 2). As expected, the ammonia concentrations in the pit headspace above the manure surface was the greatest, and at times more than 10x the concentration at floor and nose level. The higher concentration levels measured at Barn F coincided with higher manure nitrogen levels (Total N and Ammonium-N) (Figure 2). Based on July and September measurements, higher ammonia concentration levels also coincided with higher ambient temperatures (Figure 1). The presence and size of cattle in the pens we measured did not strongly influence ammonia concentrations at any measurement height within a barn on sampling days.
Ammonia concentration is variable between barns, and within barns. However, at animal and worker level, average concentrations for the sampling periods were less than 10 ppm during the summer and fall periods. Higher gas levels can develop in the confined space below the slatted floor.
Future Plans
The air exchange between the deep pit headspace and room volume relates these two areas, but is challenging to measure. We are looking at indirect air exchange estimations using ammonia and other gas concentration measurements collected to quantify the amount of air movement through the slatted floor related to environmental conditions. Additional gas and environmental data collected will enhance our understanding of deep pit beef cattle barn environments.
Authors
Erin Cortus, Assistant Professor and Extension Engineer, University of Minnesota
Brian Hetchler, Research Technician, University of Minnesota; Mindy Spiehs, Research Scientist, USDA-ARS; Warren Rusche, Extension Associate, South Dakota State University
Additional Information
USDA is an equal opportunity provider and employer
Acknowledgements
The research was supported through USDA NIFA Award No. 2015-67020-23453. We appreciate the producers’ cooperation for on-farm data collection. Thank you to S. Niraula and C. Modderman for assisting with measurements.
Figure 1. Average ammonia concentration levels in the animal and worker zone for three deep pit beef cattle barns during spring and fall sampling days, and the corresponding airspeed and temperature at cow nose level.Figure 2. Average ammonia concentration levels at nose and manure surface levels for three deep pit beef cattle barns during spring and fall sampling days, and the corresponding surface* manure characteristics. (* Barn F 14-Sep-18 manure sample was an agitated sample collected during manure removal).
The authors are solely responsible for the content of these proceedings. The technical information does not necessarily reflect the official position of the sponsoring agencies or institutions represented by planning committee members, and inclusion and distribution herein does not constitute an endorsement of views expressed by the same. Printed materials included herein are not refereed publications. Citations should appear as follows. EXAMPLE: Authors. 2019. Title of presentation. Waste to Worth. Minneapolis, MN. April 22-26, 2019. URL of this page. Accessed on: today’s date.
These presentations were recorded at the Beef Facilities Conference and focused on cattle comfort and performance with four different barns. The accompanying papers are in pages 27-37 of the written proceedings.
Comparing Open Lot, Partially Covered, and Monoslope (Completely Covered) Systems
Robbi Pritchard, South Dakota State University (SDSU)
When SDSU rebuilt their cattle feeding facilities, the decision was made to compare three different systems:
earthen lots with no overhead roof
lots that are partially roofed
a monoslope bedded barn in which the entire facility is covered
The feedlot manager tracked feed deliveries, cattle performance, carcass characteristics, and labor inputs for each system for two years. The results of that are presented in the video to the right.
Comparing Hoop Buildings and a Semi-Confinement Facility for Beef Cattle Production
Dan Loy and Shawn Shouse, Iowa State University
The design of beef facilities have evolved over time. The presenters review changes they have seen as the use of both types of facilities has increased. Research data from a University farm compared animal performance, carcass characteristics, feed conversion, and mud score.
Lastly, the presenters discussed the effect of pen density on cattle fed in bedded hoop barns.
Use of Rubber Mats in Slatted-Floor Buildings
Russ Euken, Iowa State University
Rubber mats represent a significant investment. This presentation examines research into animal performance and behavioral indicators of animal comfort when using rubber mats versus uncovered concrete slatted floors. Some of the research cited also compared to bedded systems.
Related: Virtual tour of a slatted floor beef barn with rubber mats
Frank Wideman is a Natural Resources Engineering Specialist with the University of Missouri Extension. He specializes in natural resource management, water quality, farm and home energy and emerging technologies. He includes GIS, GPS, and Remote Sensing in all those areas. He also utilizes distance education, social media, and community resource management to develop these programs. He is currently serving as an eXtension Question Wrangler along with his duties for University of Missouri. Frank has a B.S. & M.S. in Agricultural Engineering, both from University of Missouri.
Currently, Frank is working on projects that include natural resource management and energy conservation and alternative energy sources. His emphasis is on using the emerging technologies to solve local community issues and needs with science based information.
Ammonia volatilization is a major component of the nitrogen balance of a feedyard, and the effects of ammonia loss range from the economic (loss of manure fertilizer value) to the environmental (air quality degradation, overfertilization of ecosystems). Although not yet regulated, ammonia emissions from cattle are required to be reported under the Emergency Planning and Community Right to Know Act. Emission factors are used to estimate ammonia emissions for purposes of reporting and national inventories, but current emission factors are based on limited data. Our objective was to definitively quantify ammonia emissions and emission factors from commercial feedyards on the southern High Plains of Texas.
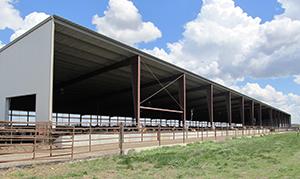
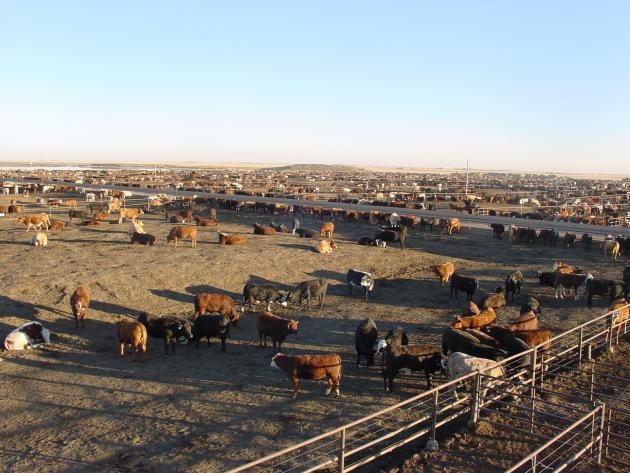
A typical feedyard on the High Plains of Texas. In the foreground, cattle in corrals with a stocking density of about 150 sq. ft./animal. In the background on the left, the runoff water retention pond, and center, a mound of stockpiled manure.
What Did We Do?
Ammonia emissions were quantified at three commercial feedyards in the Texas Panhandle from 2002 to 2008 using micrometeorological methods. Seasonal, intensive measurement campaigns were conducted from 2002 to 2005 at one feedyard, and ammonia emissions were near-continously monitored from 2007-2008 at two more feedyards. Meteorological and cattle management data were also collected.
What Have We Learned?
Ammonia emissions followed a distinct annual pattern. Emissions during summer were about twice those during winter, while spring and autumn emissions were intermediate. Annualized ammonia emissions ranged from 0.20 to 0.37 lb NH3/animal/day, and averaged 0.26 lb NH3/animal/day over all studies. Ammonia loss as a fraction of nitrogen fed to cattle averaged 41% during winter and 69% during summer; on an annual basis, 54% of fed nitrogen was lost as ammonia. Greatest emissions were observed when crude protein in cattle rations exceeded the nutrient requirements of beef cattle. Mean monthly ammonia emissions were strongly correlated with mean monthly temperature, and the relationship can be used to predict ammonia emissions from southern High Plains feedyards. Cattle feeders that meet recommended crude protein in rations can expect to lose half of fed N as ammonia. We recommend an annual emission factor of 88 lb/head for beef cattle feedyards based on one-time capacity, or 39 lb/head fed, based on a 150-d feeding period.
The annual pattern of ammonia emission rates (ER) followed seasonal temperatures, but also was sensitive to dietary crude protein (CP). Adding distillers grains to rations from March, 2008 to October, 2008 increased crude protein at Feedyard A to as high as 19%. Ammonia emissions greatly increased compared with the previous year and compared with Feedyard E.
Future Plans
Next steps involve using the extensive database from this research to adapt and refine process-based models of ammonia emissions. These models, based on the actual physical and chemical processes that control ammonia loss, will be more generally applicable than emission factors to a wider range of feedyards.
On an annual basis, ammonia emission averaged 0.26 lb per animal per day across the three feedyards and six years of study. Increased ammonia emission at Feedyard A in 2008 was due to high dietary crude protein when distillers grains were added to rations. Using these data and other estimates of ammonia loss from retention ponds and stockpiles, we recommend, for beef cattle fed a diet that meets protein requirements, an annual emission factor of 88 lb/head based on one-time capacity, or 39 lb/head fed, based on a 150-d feeding period.
Authors
Richard W. Todd, Research Soil Scientist, USDA-ARS Conservation and Production Research Laboratory, Bushland, Texas, richard.todd@ars.usda.gov
Richard W. Todd, Research Soil Scientist; N. Andy Cole, Research Leader and Research Animal Scientist (Nutrition); and Heidi M. Waldrip, Research Soil Scientist: USDA-ARS Conservation and Production Research Laboratory, Bushland, Texas.
Additional Information
Cole, N.A., R.N. Clark, R.W. Todd, C.R. Richardson, A. Gueye, L.W. Greene, and K. McBride. 2005. Influence of dietary crude protein concentration and source on potential ammonia emissions from beef cattle manure. J. Anim. Sci. 83:722 731.
Cole, N.A., A.M. Mason, R.W. Todd, M. Rhoades, and D.B. Parker. 2009. Chemical composition of pen surface layers of beef cattle feedayrds. Prof. Anim. Sci. 25:541-552.
Flesch, T.K., J.D. Wilson, L.A. Harper, R.W. Todd, and N.A. Cole. 2007. Determining ammonia emissions from a cattle feedlot with an inverse dispersion technique. Agric. For. Meteorol. 144:139-155.
Hristov, A. N., M. Hanigan, A. Cole, R. Todd, T. A. McAllister, P. M. Ndegwa, A. Rotz. 2011. Ammonia emissions from dairy farms and beef feedlots: A review. Can. J. Anim. Sci. 91:1-35.
Rhoades, M.B., D.B. Parker, N.A. Cole, R.W. Todd, E.A. Caraway, B.W. Auvermann, D.R. Topliff, and G.L. Schuster. 2010. Continuous ammonia emission measurements from a commercial beef feedyard in Texas. Trans. ASABE 53:1823-1831.
Sakirkin, S.L., N.A. Cole, R.W. Todd, and B.W. Auvermann. 2011. Ammonia emissions from cattle-feeding operations. Part 1: issues and emissions. Texas Agricultural Experiment Station Bulletin, Air Quality Education in Animal Agriculture, Issues: Ammonia, December, 2011. p. 1-11.
Sakirkin, S., R.W. Todd, N.A. Cole, and B.W. Avermann. 2011. Ammonia emissions from cattle-feeding operations. Part 2: abatement. Texas Agricultural Experiment Station Bulletin, Air Quality Education in Animal Agriculture, Issues: Abatement, December, 2011. p. 1-11.
Todd, R.W., N.A. Cole, and R.N. Clark. 2006. Reducing crude protein in beef cattle diet reduces ammonia emissions from artificial feedyard surfaces. J. Environ. Qual. 35:404-411.
Todd, R.W., N.A. Cole, M.B. Rhoades, D.B. Parker, and K.D. Casey. 2011. Daily, monthly, seasonal and annual ammonia emissions from southern High Plains cattle feedyards. J. Environ. Qual. 40:1-6.
Todd, R.W., N.A. Cole, H.M. Waldrip, and R.M. Aiken. 2013. Arrhenius equation for modeling feedyard ammonia emissions using temperature and diet crude protein. J. Environ. Qual. 2013. (accepted for publication).
Acknowledgements
Research was supported by CSREES Grant #TS2006-06009 under the direction of Dr. John Sweeten, Resident Director, Texas A&M University AgriLife Research and Extension Center, Amarillo, TX. Larry Fulton, Research Technician, USDA-ARS-CPRL, provided invaluable technical and logistical support and expertise.
The authors are solely responsible for the content of these proceedings. The technical information does not necessarily reflect the official position of the sponsoring agencies or institutions represented by planning committee members, and inclusion and distribution herein does not constitute an endorsement of views expressed by the same. Printed materials included herein are not refereed publications. Citations should appear as follows. EXAMPLE: Authors. 2013. Title of presentation. Waste to Worth: Spreading Science and Solutions. Denver, CO. April 1-5, 2013. URL of this page. Accessed on: today’s date.
The purpose of this study was to investigate greenhouse gas (GHG) emission sources in a typical cow-calf operation in Florida and to calculate its total carbon footprint. The most important greenhouse gas source found was enteric fermentation, hence further investigation of this factor is being developed with field trials.
Why Study the Carbon Footprint of Cow-Calf Systems?
We estimated the carbon footprint of the cow-calf operation held in Buck Island Ranch, with data from 1998 to 2008. This production system has around 3000 cows and 250 bulls, has low fertilizer and lime inputs and feeding is pasture and hay based with some use of molasses and urea. Natural mating is used and calves are kept in the farm until 7 months old. The Intergovernmental Panel on Climate Change (IPCC, 2006) methodology was used along with emission factors from USDA (EPA, 2009) to estimate emissions at different levels of complexity (Tier 1 being the least complex and Tier 3 the most), according to data availability, and transformed in carbon dioxide equivalent (CO2eq). A field trial to measure ruminal methane emissions was held at the North Florida Research and Education Center in Marianna, Florida, from June 26th to September 18th. The experiment treatments consisted of three stocking rates (1.2, 2.4 and 3.6 AU/ha, where one animal unit is 360) with four replicates each. The ruminal methane emissions were measured three times using the sulfur hexafluoride (SF6) tracer technique (Johnson et al., 1994). Experimental weight gain and average initial weight of each experimental unit were used to estimate emissions with the IPCC’s Tier 3 methodology.
Table 1. Sources of greenhouse gases in units of carbon dioxide equivalent (CO2eq). Data retrieved from Buck Island Ranch from 1998 to 2008.
Figure 2. Animal with SF6 sample collection apparatus. Marianna, Florida, August 2012.
What Have We Learned?
Results of the carbon footprint calculation are shown in Table 1. We can observe that enteric fermentation is responsible for almost 60% of total emissions in this production system, varying with feed quality, age of animal (since calves under 7 months age are not considered to produce any methane), and number of animals in the farm. It was also found that this model is most sensitive to variations in weight gain. The second most important source of GHG is manure with more than 23 of emissions. The yearly variation in emissions is a result of the use of nitrogen fertilization and lime or burning of the pasture. On average 477,936 kg of live weight are produced every year in the ranch, resulting in an average of 24.6 kg CO2eq/kg live weight that leaves the farm. Results from the field trials were compared with default values from IPCC’s Tier 1 methodology and USDA, and to IPCC’s Tier 3. We can see that on Period 2 the weight gain on the 2.4 AU/ha treatment was greater than on the 3.6 AU/ha (Figure 1). Since the model used is highly sensitive to weight gain, the prediction resulted in higher methane emissions from the 2.4 AU/ha treatment. The field measurements (Figure 2), however, showed more emissions in the 3.6 AU/ha treatment showing that other factors besides weight gain might play an important role on enteric fermentation methane emissions.
Future Plans
Our future plans include the use of field data to perform a prediction analysis with the model under study. Also, we plan to do in vitro gas production technique (IVGPT) to simulate ruminal fermentation and have a better understanding of emissions.
Authors
Marta Moura Kohmann, M.S. student, Agricultural and Biological Engineering Department, University of Florida. mkohmann@ufl.edu
Clyde W. Fraisse, PhD., Associate Professor, Agricultural and Biological Engineering Department, University of Florida.
The author would like to thank Faculty and Staff at the North Florida Research and Education Center for the assistance during the field trial.
The authors are solely responsible for the content of these proceedings. The technical information does not necessarily reflect the official position of the sponsoring agencies or institutions represented by planning committee members, and inclusion and distribution herein does not constitute an endorsement of views expressed by the same. Printed materials included herein are not refereed publications. Citations should appear as follows. EXAMPLE: Authors. 2013. Title of presentation. Waste to Worth: Spreading Science and Solutions. Denver, CO. April 1-5, 2013. URL of this page. Accessed on: today’s date.
Beef cattle are responsible for around 15% of the total anthropogenic ammonia (NH3) emitted in the U.S., and the cattle feeding industry is highly concentrated spatially, with the majority of commercial feedyards located in Texas, Iowa, Kansas,Colorado, and Nebraska (USEPA, 2005; USDA-NASS, 2009). Valid estimates of ammonia (NH3) emissions from beef cattle feedyards are needed to assess the impact of beef production on the environment, to comply with reporting requirements, and to develop reasonable regulatory policies. The processes involved in production and volatilization of NH3 from livestock housing are strongly influenced by environmental conditions and management practices (Fig. 1), which may not be captured by constant emission factors or mathematically-derived empirical models. Among different modeling approaches, process-based models, which track components of interest through biochemical and geochemical reactions as functions of specific conditions (e.g. temperature, wind speed, pH, precipitation, surface heating, animal diet), offer a better approach for predicting NH3 emissions from open-lot animal production systems than emission factors or empirical models. However, while process-based models have been developed to estimate NH3 emissions from dairy barns and other livestock facilities, little work has been conducted to assess their accuracy for large, commercial feedyards in the semi-arid Texas High Plains: the top beef producing region in the United States.
Figure 1. Processes and factors affecting feedyard ammonia emissions and modeled with IFSM and Manure-DNDC.
What Did We Do?
We evaluated two process-based models, the Integrated Farm Systems Model (IFSM) (Rotz et al., 2012) and the newly developed Manure-DNDC (DeNitrification DeComposition) model (Li et al., 2012), for predicting feedyard NH3 emissions in the Texas High Plains. To meet this objective, we compared model-simulated emissions to measured NH3 flux data collected from two commercial feedyards, Feedyard A and Feedyard E, in Deaf Smith County, Texas. Feedyard NH3 fluxes were measured from February 2007 to January 2009 using open-path lasers and an inverse dispersion model (Todd et al., 2011). The input data for the two models differed slightly; however, both required daily climate data (temperature, precipitation, wind speed, solar radiation), animal population (Feedyard A, 12,684 head; Feedyard E, 19,620 head), and concentration of crude protein (%CP) in cattle diets. Model performance was evaluated by the difference between predicted and observed emissions using both linear regression analysis and summary, univariate, and difference measures (Wilmott et al., 1982).
Figure 2 (above). Comparison of observed and IFSM predicted per capita NH3 emission rates (g head-1 d-1) at (a) Feedyard A, and (b) Feedyard E. Daily predictions were in good agreement (p < 0.001) with observations at both feedyards and responded appropriately to changes in ambient temperature and % CP in feedyard diets.
Figure 3 (below). Comparison of observed and Manure-DNDC predicted NH3 emission rates (kg ha-1 d-1) at (a) Feedyard A, and (b) Feedyard E. The units for Manure-DNDC (kg hectare-1 d-1) differ from IFSM (g head-1 d-1); however, daily Manure-DNDC predictions for 2008 agreed with observations (p < 0.001) in a manner similar to IFSM predictions.
What Have We Learned?
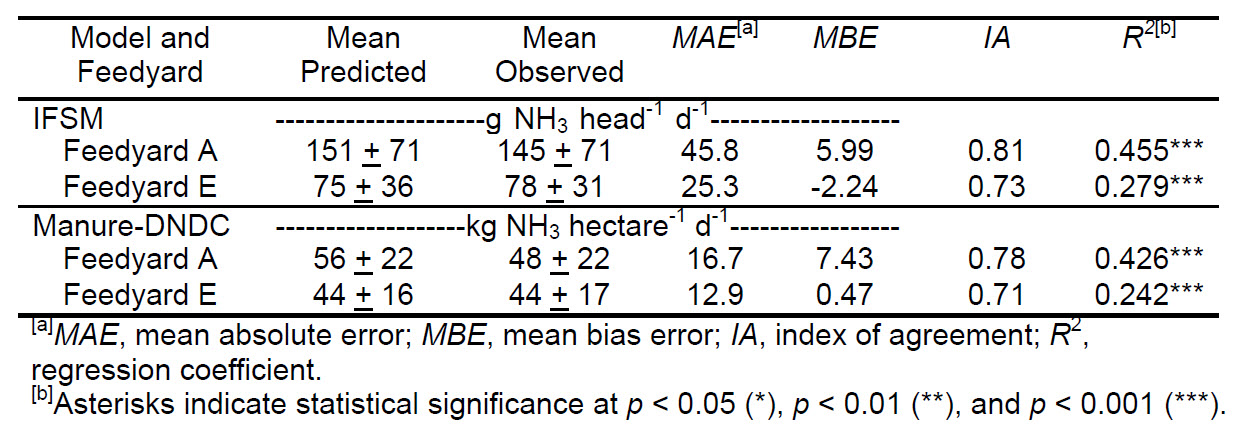
Predictions of daily NH3 emissions made by IFSM and Manure-DNDC were in good agreement (p < 0.001) with observations at both feedyards (Figs. 2 and 3, Table 1). IFSM predicted average NH3 fluxes of 151 and 75 g head-1 d-1 for Feedyards A and E, respectively (Table 1). Manure-DNDC output is on an area basis, and average modeled NH3 fluxes were 56 (Feedyard A) and 44 kg hectare-1 d-1 (Feedyard E). In addition, both models responded appropriately to changes in ambient temperature and %CP in feedyard diets, as shown by higher emissions in summer than winter, and the period of February to October 2008 at Feedyard A, when diets contained as much as 19% CP due to the inclusion of distillers grains (Figs. 2 and 3). The index of agreement (IA) indicates 71% to 81% agreement between model predictions and observed emissions (Table 1). Overall, both IFSM and Manure-DNDC predictions for Feedyard E had lower values for error and bias (MAE and MBE), while there was better agreement between observations and model predictions for NH3 emissions for Feedyard A.
Figure 4. Comparison of mean predicted and observed per capita NH3 emission rates from (a) Feedyard A and (b) Feedyard E in 2008. For most months, model predictions did not differ from observations, indicating that both models were useful for predicting average feedyard NH3 emissions.
Comparisons of modeled and observed mean daily per capita NH3 emissions for each month in 2008 are shown in Figure 4. For most months, model predictions did not differ significantly from observations, indicating that both models were useful for predicting average emissions. We also wanted to compare model predictions for annual per capita NH3 emissions to the emission factor of 13 kg head-1 y-1 that is currently used by the USEPA (USEPA, 2005). For 2008, IFSM and Manure-DNDC estimates of annual per capita emissions were 61 and 55 kg head-1 y-1 (Feedyard A) and 33 and 25 kg head-1 y-1 (Feedyard E), and model estimates for total feedyard emissions were within 3% to 24% of measured values (Table 2). In contrast, the current EPA emission factor underestimated total feedyard emissions by 61% to 79%: indicating that predictions by IFSM and Manure-DNDC can more accurately predict feedyard NH3 emissions than current constant emission factors.
Table 1. Regression and mean difference comparisons for observed and predicted daily feedyard NH3 emissions from Feb. 2007 to Jan. 2009, where there were 386 and 272 paired comparisons for Feedyard A and Feedyard E, respectively. Regression analysis indicated a highly significant (p < 0.001) relationship between observations and predictions made by both models. The index of agreement (IA) indicates 71% to 81% agreement between model predictions and observed emissions. Overall, both IFSM and Manure-DNDC model predictions for Feedyard E had lower values for error and bias (MAE and MBE), while there was better agreement between observations and model predictions for NH3 emissions for Feedyard A.
Table 2. Comparison of observed annual emissions at Feedyards A and E in 2008 with predictions by Manure-DNDC, IFSM, and the USEPA emission factor (EF) for beef cattle. For 2008, IFSM and Manure-DNDC estimates were within 3% to 24% accuracy. In contrast, the current EPA emission factor underestimated emissions by as much as 79%.
Future Plans
Future plans include using process-based models to predict nitrous oxide (N2O) emissions from feedyard pen surfaces. In addition, we will conduct laboratory and field-scale studies to better characterize the chemical and physical properties of feedyard manure in order to refine input parameters and improve model predictions of feedyard NH3 and N2O emissions.
Authors
Heidi M. Waldrip, Research Soil Scientist, USDA-ARS Conservation and Production Laboratory, Bushland, TX, heidi.waldrip@ars.usda.gov
C. Alan Rotz, Agricultural Engineer, USDA-ARS Pasture Systems and Watershed Management Research Unit, University Park, PA.
Changsheng Li, Research Professor, Institute for the Study of Earth, Oceans, and Space, University of New Hampshire, Durham, NH.
Richard W. Todd, Soil Scientist, USDA-ARS Conservation and Production Laboratory, Bushland, TX.
William Salas, President and Chief Scientist, Applied Geosolutions, LLC, Durham, NH.
N. Andy Cole, Research Leader and Animal Scientist, USDA-ARS Conservation and Production Laboratory, Bushland, TX.
Additional Information
Li, C., W. Salas, R. Zhang, C. Krauter, A. Rotz, and F. Mitloehner. 2012. Manure-DNDC: a biogeochemical process model for quantifying greenhouse gas and ammonia emissions from livestock manure systems. Nutr. Cycl. Agroecosyst. 93:163-200.
Rotz, C.A., M.S. Corson, D.S. Chianese, F. Montes, S.D. Hafner, R. Jarvis, and C.U. Coiner. 2012. Integrated Farm System Model: Reference Manual. University Park, PA: USDA Agricultural Research Service. Available at: http://www.ars.usda.gov/Main/docs.htm?docid=21345. Accessed 5 January 2013.
Todd, R. W., N. A. Cole, M. B. Rhoades, D. B. Parker, and K. D. Casey. 2011. Daily, monthly, seasonal, and annual ammonia emissions from Southern High Plains cattle feedyards. J. Environ. Qual. 40:1090-1095.
USEPA. 2005. National Emission Inventory – Ammonia Emissions from Animal Agricultural Operations: Revised Draft Report. 2005 Apr. 22. United States Environmental Protection Agency, Washington DC. Available at: http://www.epa.gov/ttnchie1/net/2002inventory.html. Accessed 02/27/2013.
Wilmott, C. J. 1982. Comments on the evaluation of model performance. Bull. Am. Meterol. Soc. 63:1309-1313.
This project was partially supported by USDA-NIFA funding to Texas A&M AgriLife Research for the federal special grant project TS2006-06009, “Air Quality: Reducing Emissions from Cattle Feedlots and Dairies (TX & KS)”.
The authors are solely responsible for the content of these proceedings. The technical information does not necessarily reflect the official position of the sponsoring agencies or institutions represented by planning committee members, and inclusion and distribution herein does not constitute an endorsement of views expressed by the same. Printed materials included herein are not refereed publications. Citations should appear as follows. EXAMPLE: Authors. 2013. Title of presentation. Waste to Worth: Spreading Science and Solutions. Denver, CO. April 1-5, 2013. URL of this page. Accessed on: today’s date.
To provide the best experiences, we use technologies like cookies to store and/or access device information. Consenting to these technologies will allow us to process data such as browsing behavior or unique IDs on this site. Not consenting or withdrawing consent, may adversely affect certain features and functions.
Functional
Always active
The technical storage or access is strictly necessary for the legitimate purpose of enabling the use of a specific service explicitly requested by the subscriber or user, or for the sole purpose of carrying out the transmission of a communication over an electronic communications network.
Preferences
The technical storage or access is necessary for the legitimate purpose of storing preferences that are not requested by the subscriber or user.
Statistics
The technical storage or access that is used exclusively for statistical purposes.The technical storage or access that is used exclusively for anonymous statistical purposes. Without a subpoena, voluntary compliance on the part of your Internet Service Provider, or additional records from a third party, information stored or retrieved for this purpose alone cannot usually be used to identify you.
Marketing
The technical storage or access is required to create user profiles to send advertising, or to track the user on a website or across several websites for similar marketing purposes.


 /a>
/a>