Why Develop a Feed Management Certification Program?
To develop a program to train ARPAS-certified (American Registry of Professional Animal Scientists) dairy and beef nutritionists on how to prepare and evaluate Feed Management plans as it relates to the NRCS Feed Management (592) practice in Pennsylvania. The objective is to compare how formulated diets match to the consumed diets. Phosphorus is monitored through manure testing and nitrogen by milk urea nitrogen and calculating milk nitrogen efficiency. Dry matter intake efficiency is also monitored as this can affect the total manure volume excreted.
What Did We Do?
In 2007, Mid-Atlantic Water Program (MAWP) scientists applied the national feed management program to meet the needs of dairy consultants to implement feed management in the Chesapeake Basin. This program certifies consultants in precision feed management, a practice that reduces nutrient loads in animal wastes by minimizing the phosphorus and nitrogen content in the feed.
With the recent release of the US Environmental Protection Agency’s Total Maximum Daily Load for the Chesapeake Bay, the agricultural community is looking for the best practices to control nutrient pollution while minimizing impacts to profit. Over the years, the work of this project team has established precision feed management as both an economically and environmentally viable best management practice. As such, state watershed implementation plans include precision feed management as a method to meet load allocations.
Pennsylvania currently has twenty-four NRCS qualified nutritionists to write feed management plans. In 2011, fifty-one operations received EQIP or CBWI funding through USDA-NRCS for feed management, with the majority consisting of dairy farms. An additional 10 farms entered into contracts with NRCS in 2012. Farms are currently in the process of being assessed on how well they implemented recommendations from the first year of quarterly reports and are working through their second year of implementation.
Additional efforts have been implemented to educate consultants about the regulations and issues affecting dairy producers. Currently, the Pennsylvania team is working with producers to monitor income over feed costs and to develop cash flow plans, which provides the opportunity to implement precision feeding practices while monitoring the economic benefits to the herd. A study of six component fed dairy herds in Pennsylvania is also being completed to evaluate the effects of the feed, forage, and manure sampling protocols along with feeding order on fecal phosphorus levels and to update current sampling recommendations.
Funding from the MAWP was critical to providing these trainings and projects and establishing precision feed management as a best management practice that farmers can realistically utilize. The infrastructure is in place to address the demand for more feed management plans and the MAWP will continue to meet the educational needs of this audience.
What Have We Learned?
There are a lot of opportunities on farms to improve feed management and nutrient balance. Challenges have been observed pertaining to nutrient reduction strategies that could impact overall nutrient balances in dairy and beef rations. Many of these challenges are greatly influenced by the volatility in today’s commodity pricing. Producers need to become more engaged in what they are feeding and how it affects their profitability. It has been observed that inorganic phosphorus is still being used in grain mixtures when rations contain high phosphorus forages or inclusion of byproduct feeds. We have also observed some challenges in obtaining test analyses for complete grain and mineral mixes on a regular basis. More education is needed for both industry professionals as well as producers.
Future Plans
As the feed management program in Pennsylvania progresses, pounds of phosphorus excreted can be tracked to monitor the effects of reducing phosphorus in dairy and beef rations. This can be used to evaluate its effect on water quality and potential phosphorus accumulations in the soil when manure is applied to crops at nitrogen-based rates. Crop rotations, inclusion of alternative forages and whole farm nutrient balance will be included in future trainings and feed management plans. The Penn State Extension Dairy team is also working on the development of a Feed Management mobile app for producers and nutritionist to be able to track and monitor their progress on nutrient reductions in their rations.
The authors are solely responsible for the content of these proceedings. The technical information does not necessarily reflect the official position of the sponsoring agencies or institutions represented by planning committee members, and inclusion and distribution herein does not constitute an endorsement of views expressed by the same. Printed materials included herein are not refereed publications. Citations should appear as follows. EXAMPLE: Authors. 2013. Title of presentation. Waste to Worth: Spreading Science and Solutions. Denver, CO. April 1-5, 2013. URL of this page. Accessed on: today’s date.
We conducted a field study on corn to evaluate the effect of liquid dairy manure applied pre-plant (injection or surface broadcast with immediate or 3-day disk incorporation) or sidedressed at 6-leaf stage (injected or surface-applied) on emission of NH3 and N2O. Manure was applied at a rate of 6500 gal/acre, which supplied an average of 150 lb/acre of total N and 65 lb/acre of NH4-N. Ammonia emission was measured for 3 days after manure application using the dynamic chamber/equilibrium concentration technique, and N2O flux was quantified using the static chamber method at intervals of 3 to 14 days throughout the season. Ammonia-N losses were typically 30 to 50 lb/acre from pre-plant surface application, most of the loss occurring in the first 6 to 12 hours after application. Emission rates were reduced 60-80% by quick incorporation and over 90% by injection. Losses of N2O were relatively low (1 lb/acre or less annually), but pronounced peaks of N2O flux occurred from either pre-plant or sidedress injected manure in different years. Results show that NH3 emission from manure can be reduced substantially by injection or quick incorporation, but there may be some tradeoff with N2O flux from injection.
Why Study Land Application Emissions of Ammonia and Nitrous Oxide?
Figure 1. Injection equipment used for pre-plant application (top) and sidedress application (bottom) of liquid dairy manure.
Manure is a valuable source of nitrogen (N) for crop production, but gaseous losses of manure N as ammonia (NH3) and nitrous oxide (N2O) reduce the amount of N available to the crop and, therefore, its economic value as fertilizer. These N losses can also adversely affect air quality, contribute to eutrophication of surface waters via atmospheric deposition, and increase greenhouse gas emission. And the decreased available N in manure reduces the N:P ratio and can lead to a more rapid build-up of P in the soil for a given amount of available N. The most common approach to controlling NH3 volatilization from manure is to incorporate it into the soil with tillage or subsurface injection, which can reduce losses by 50 to over 90% compared to surface application (Jokela and Meisinger, 2008). Injecting into a growing corn crop at sidedress time offers another window of time for manure application (Ball-Coelho et al., 2006). While amounts of N lost as N2O are usually small compared to NH3, even low emissions can contribute to the greenhouse effect because N2O is about 300 times as potent as carbon dioxide in its effect on global warming (USEPA, 2010). We carried out a 4-year field experiment to evaluate the effect of dairy manure application method and timing and time of incorporation on a) corn yield, b) fertilizer N credits, c) ammonia losses, and) nitrous oxide emissions.
What Did We Do?
Figure 2. Average (2009-2011) NH3-N emission rates as affected by method and timing of manure application.
This field research was conducted at the Univ. of Wisconsin/USDA Agricultural Research Station in Marshfield, WI, on predominantly Withee silt loam (Aquic glossudalf), a somewhat poorly drained soil with 0 to 2% slope. Dairy manure was applied either at pre-plant (mid- to late May) or sidedress time (5-6-leaf stage). Pre-plant treatments were either injected with an S-tine injector (15-inch spacing; Fig. 1) or incorporated with a tandem disk immediately after manure application (< 1 hour), 1-day later, or 3 days later. All plots were chisel plowed 3 to 5 days after application. Sidedress manure applications were either injected with an S-tine injector (30-inch spacing) or surface applied (Fig. 1). Fertilizer N was applied to separate plots at pre-plant at rates of 0, 40, 80, 120, 160, and 200 lb/acre as urea and incorporated with a disk. Liquid dairy manure (average 14% solids) was applied at a target rate of 6,500 gal/acre. Manure supplied an average of 158 lb total N and 62 lb NH4-N per acre, but rates varied across years and application times.
Ammonia emission was measured following pre-plant and sidedress manure applications in 2009-2011 with the dynamic chamber/equilibrium concentration technique (Svensson, 1994). Measurement started immediately after manure application and continued through the third day. Ammonia measurement ended just before disking of the 3-day incorporation treatment, so the 3-day treatment represents surface-applied manure. Nitrous oxide was measured using the static, vented chamber technique following the GRACEnet protocol (Parkin and Venterea, 2010). Measurement began two days after pre-plant manure application and continued approximately weekly into October.
What Have We Learned?
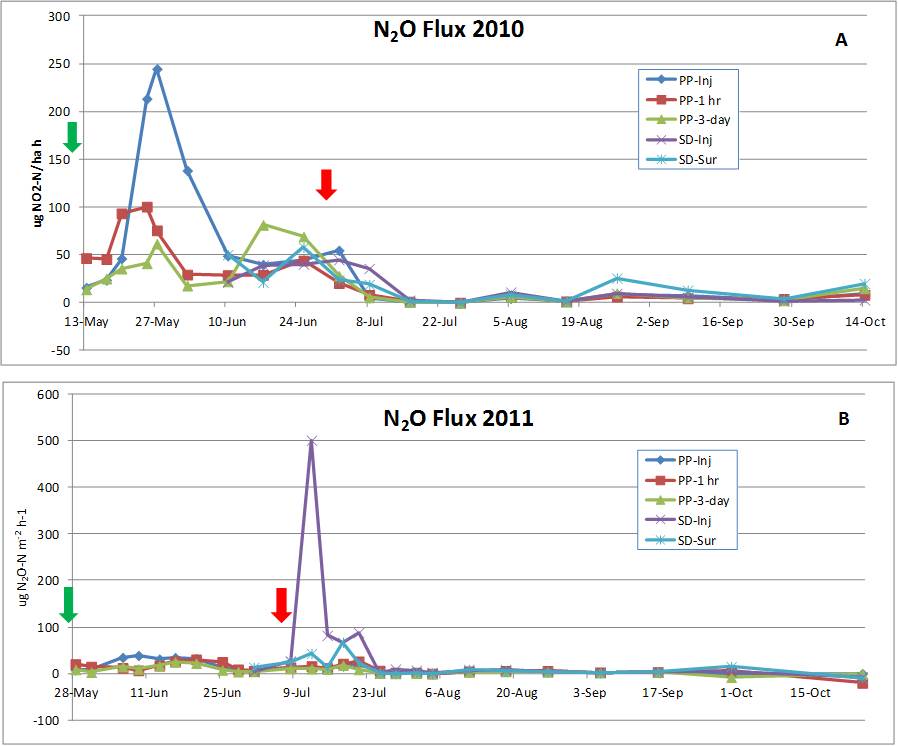
Figure 3. Nitrous oxide (N2O) flux as affected by method and timing of dairy manure application from May to October of 2010 (A) and 2011 (B). Arrows show times of manure application. Note differences in scale for 2010 and 2011.
The 3-year average annual NH3 emission rate from surface applied (3-day incorporation) manure was relatively high immediately following application but declined rapidly after the first several hours to quite low levels (Fig. 2). Cumulative NH3-N loss over the full measurement period averaged over 40 lb/acre from surface application but was reduced by 75% with immediate disking and over 90% by injection. Ammonia losses varied somewhat by year, but patterns over time and reductions by incorporation were similar. The pattern of ammonia loss, 75% of the total loss in the first 6 to 12 hours, emphasizes the importance of prompt incorporation to reduce losses and conserve N for crop use.
Nitrous oxide flux was quite low for most manure treatments during most of the May to October period in both years (Fig. 3). However, there were some increases in N2O flux after manure application, and pronounced peaks of N2O emission from the injection treatment at either pre-plant (2010) or sidedress (2011) time. Greater emission from injection compared to other treatments may have occurred because injection of liquid manure places manure in a relatively concentrated band below the surface, creating anaerobic (lacking in oxygen) conditions. Nitrous oxide is produced by denitrification, a microbial process that is facilitated by anaerobic conditions. Reasons for the difference between 2010 and 2011 are not readily obvious, but are probably a result of different soil moisture and temperature conditions.
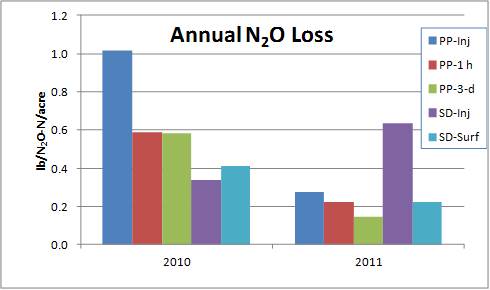
Figure 4. Annual (May-Oct.) loss of N2O as affected by method and timing of liquid dairy manure application. 2010 and 2011.
Based on these results, injection of liquid dairy manure resulted in opposite effects on NH3 and N2O emission, suggesting a trade-off between the two gaseous N loss pathways. However, the total annual N losses from N2O emissions (1 lb/acre or less; Fig. 4) were only a fraction of those from ammonia volatilization, so under the conditions of this study N2O emission is not an economically important loss. As noted earlier, however, N2O is a potent greenhouse gas, so even small amounts can contribute to the potential for global climate change. The dramatic reduction in NH3 loss from injection, though, may at least partially balance out the increased N2O because 1% of volatilized N is assumed to be converted to N2O (IPCC, 2010). Immediate disk incorporation was almost as effective as injection for controlling NH3 loss and, on average, resulted in less N2O emission than injection. But the separate field operation must be done promptly after manure application to be effective. A possible alternative is to use sweep injectors or other direct incorporation methods that place manure over a larger volume of soil and/or create more mixing with soil, thus creating conditions less conducive to denitrification and N2O loss.
Manure application timing and method/time to incorporation significantly affected grain yield in 2009, 2010, and 2012 and silage yield in 2012. Pre-plant injection produced greater yields than one or more of the broadcast treatments in 2009 (grain) and 2012 (grain and silage). Overall, yield effects of application and incorporation timing were variable from year to year, probably because of differences in weather and soil conditions and actual manure N rates applied. The fertilizer N equivalence of manure was calculated by comparing the yield achieved from each manure treatment to the yield response function from fertilizer N. Fertilizer N equivalence values were quite variable by year, but 4-year averages expressed as percent of total manure N applied were 52% for injection (pre-plant and sidedress), 37% for 1-hour or 1-day incorporation, and 34% for 3-day incorporation. So, when expressed as a percent of total manure N applied, N availability generally decreased as time to incorporation increased, which reflects the amounts of measured NH3 loss.
In summary, ammonia volatilization losses increased as the time to incorporation of manure increased. Injection of manure resulted in the lowest amount of NH3 volatilization, but higher N2O emissions. In this study, reducing the large NH3 losses by injecting manure provided more environmental benefit compared to the small increase in N2O emissions. In addition, injection or immediate incorporation resulted, on average, in higher fertilizer N value of manure for corn production. The decreased need for commercial fertilizer N could potentially result in greater profitability and a smaller carbon footprint.
Future Plans
We have started other research to evaluate yield response, N cycling, and emission of NH3 and N2O from various low-disturbance manure application methods in silage corn and perennial forage systems.
Authors
Bill Jokela, Research Soil Scientist, USDA-ARS, Dairy Forage Reserch Center, Marshfield, WI, bill.jokela@ars.usda.gov
Carrie Laboski, Assoc. Professor, Dept. of Soil Science, Univ. of Wisconsin
Todd Andraski, Researcher, Dept. of Soil Science, Univ. of Wisconsin
Additional Information
Ball Coelho, B.R., R.C. Roy, and A.J. Bruin. 2006. Nitrogen recovery and partitioning with different rates and methods of sidedressed manure. Soil Sci. Soc. Am. J. 70:464–473.
Intergovernmental Panel on Climate Change (IPCC). 2006 IPCC Guidelines for National Greenhouse Gas Inventories, vol. 4, Agriculture, Forestry and Other Land Use, edited by S. Eggleston et al., Inst. for Global Environ. Strategies, Hayama, Japan.
The authors gratefully acknowledge Matt Volenec and Ashley Braun for excellent technical assistance in conducting this research. Funding was provided, in part, by the USDA-Agricultural Research Service and the Wisconsin Corn Promotion Board.
The authors are solely responsible for the content of these proceedings. The technical information does not necessarily reflect the official position of the sponsoring agencies or institutions represented by planning committee members, and inclusion and distribution herein does not constitute an endorsement of views expressed by the same. Printed materials included herein are not refereed publications. Citations should appear as follows. EXAMPLE: Authors. 2013. Title of presentation. Waste to Worth: Spreading Science and Solutions. Denver, CO. April 1-5, 2013. URL of this page. Accessed on: today’s date.
Why Is It Important for Industry and Regulators to Work Together?
The community in the Yakima Region of Washington State has raised concerns over the potential adverse effects of air emissions from dairy operations. To address these concerns, the Yakima Regional Clean Air Agency (YRCAA) proposed a policy process in October 2010 to control and mitigate emissions through implementation of site-specific best management practices (BMPs) on dairy operations. Absent a lack of reliable methodologies for estimating emissions from dairies, the YRCAA enrolled experts and scientists to help create tools that could be used for estimation of emissions from dairy operations. The assessment of BMPs aimed at mitigating air emissions from dairies was also included to determine their effect on the character, amount, and dispersion of specific air pollutants. This project assessed the effect of voluntary verses policy driven action on the dairy industry, community, and environmental impacts of air emissions from dairy operations.
What Did We Do?
The Yakima Regional Clean Air Agency (YRCAA) proposed a draft policy in October 2010 to control and mitigate emissions through implementation of site-specific best management practices (BMPs) on dairy operations. To validate the policy, a “Pilot Research Project” was launched in February 2011 to gather information for one year to test the feasibility of implementing and determining policy effectiveness. Twelve operations, representing ~40% of the estimated regional cow numbers, volunteered to participate.
A description of proven BMPs and a BMP selection-guide were created to help producers develop site-specific Air Quality Management Plans (AQMP). Each AQMP identified, systematically, specific BMPs to mitigate emissions from each area of the dairy system (nutrition, feed management, milk parlor, housing-drylot, housing-freestall, grazing, manure management, land application, other) based on effectiveness, practicality and economics. The pollutants addressed in each AQMP included ammonia, nitrous oxide, hydrogen sulfide, volatile organic compounds, odor, particulate matter, oxides of nitrogen, and methane. A universal score-sheet was created to assess implementation of BMPs at each dairy. The YRCAA inspectors were trained to evaluate, score, and record BMP implementation. A whole-farm score was generated during each visit, which identified areas of improvement to be addressed.
The process was very unique in that the dairy industry took a proactive role and actively participated. Using science and air quality experts to create and validate the evaluation tools and process also brought authority to the process. The policy was revised based on information collected from the pilot project and was adopted in February 2012. To date, 22 operations, representing 57% of total cow numbers in the Yakima Region, are enrolled.
What Have We Learned?
The voluntary approach used during the pilot project phase of the policy was very effective in enrolling the dairy community. Producers stepped up to volunteer and cooperatively participate in an unknown process. Even though they were very robust and integrated a large amount of scientific information, the emission assessment tools created as an outcome of the pilot project were very user friendly and easy to interpret by planners and producers. The air quality BMP assessment tool is currently being evaluated for use by other agencies and institutions.
Future Plans
The YRCAA has entered into phase two of the policy process and are now mandating that dairies participate in the air quality assessment. Starting in March 2013, all dairy operations in the Yakima basin will be either voluntarily or mandatorily inspected and assessed for air quality improvements. This provides an opportunity to compare voluntary and mandatory policy processes. The long-term impact of the process is yet unknown.
The authors are solely responsible for the content of these proceedings. The technical information does not necessarily reflect the official position of the sponsoring agencies or institutions represented by planning committee members, and inclusion and distribution herein does not constitute an endorsement of views expressed by the same. Printed materials included herein are not refereed publications. Citations should appear as follows. EXAMPLE: Authors. 2013. Title of presentation. Waste to Worth: Spreading Science and Solutions. Denver, CO. April 1-5, 2013. URL of this page. Accessed on: today’s date.
In an effort to assess the off-site transport of bioaerosols, airborne bacteria, fungi, and endotoxin were collected at a 10,000 cow dairy operation. Compared to background locations, the general trend was that bioaerosol concentrations were higher immediately downwind, then decreased with distance from the animal housing. While bioaerosol concentrations did not follow a seasonal trend, they did significantly correlate with meteorological factors such as temperature and solar radiation. Bioaerosol concentrations were also found to be greatest at night, which can be attributed to changes in animal activity and wind speed and reduced exposure of the microorganisms to UV radiation. An analysis of clones generated from air samples collected downwind from the animal housing and pivots spraying dairy wastewater revealed that none of sequence matches were affiliated with bacteria known to be pathogenic to otherwise healthy humans. Results from ongoing research to better understand bioaerosol formation and drift losses during spray irrigation events of dairy wastewater will also be discussed.
Using glass impingers to capture airborne bacteria at a downwind location from a dairy.
Why Study Bioaerosols at Dairies?
Because confinement of cattle increases the microbioal load at dairy production facilities, there are concerns about on-site and off-site exposures to airborne microorganisms and microbial byproducts. The purpose of this study was to monitor concentrations of airborne bacteria, fungi, and endotoxin at a 10,000 cow open-freestall dairy and fields being irrigated with wastewater to assess their potential to be transported off site. This information is important, as inhalation or ingestion of some bioaerosols can be detrimental to health through infection, allergy, or toxicosis.
Open-face filters for capture of airborne endotoxin.
What Did We Do?
Over a one-year period at the dairy, bioaerosols were collected at upwind (background) and downwind sites using glass impingers, direct impaction on media, and a wetted-wall cyclone. Bacteria and fungi were quantified using culture-dependent techniques, while bacteria were also characterized to the genus and species levels by analyzing a region of the 16S ribosomal RNA gene. Airborne endotoxin were captured on filters, then extracted and subsequenetly quantified using the Limulus amebocyte lysate assay.
Wetted-wall cyclone being used to capture bioaerosols for subsequent identification using PCR-based approach.
What Have We Learned?
Compared to background sites, the general trend was that concentrations of airborne bacteria and endotoxin were higher immediately downwind, then decreased with distance from the animal housing. While bioaerosol concentrations did not follow a seasonal trend, they did significantly correlate with meteorological factors such as temperature, wind speed, and solar radiation. Bacteria and endotoxin concentrations were also found to be greatest at night, which can be attributed to changes in animal activity and wind speed and reduced exposure of the microorganisms to UV radiation. Analysis of cloned 16S rRNA genes generated from air samples collected downwind from the animal housing and pivots spraying dairy wastewater revealed that none of sequences were affiliated with bacteria known to be pathogenic to healthy humans.
Future Plans
Conduct a quantitative microbial risk assessment for zoonotic bacterial pathogens in dairy wastewaters that are land applied using center pivot irrigation systems.
Authors
Robert Dungan, Research Microbiologist, USDA-ARS Northwest Irrigation & Soils Research Laboratory, Kimberly, Idaho, robert.dungan@ars.usda.gov
April Leytem, Soil Chemist, USDA-ARS, Kimberly, Idaho
David Bjorenberg, Agricultural Engineer, USDA-ARS, Kimberly, Idaho
Additional Information
Dungan, R.S. and A.B. Leytem. 2009. Airborne endotoxin concentrations at a large open-lot dairy in southern Idaho. J. Environ. Qual. 38:1919-1923.
Dungan, R.S., A.B. Leytem, and D.L. Bjorneberg. 2010. Year-long assessment of airborne endotoxin at a concentrated dairy operation. Aerobiologia. 26:141-148.
Dungan, R.S., A.B. Leytem, S.A. Verwey, and D.L. Bjorneberg. 2010. Assessment of bioaerosols at a concentrated dairy operation. Aerobiologia. 26:171-184.
Dungan, R.S. and A.B. Leytem. 2011. Ambient endotoxin concentrations and assessment of transport at an open-lot and open-freestall dairy. J. Environ. Qual. 40:462-467.
Dungan, R.S., A.B. Leytem, and D.L. Bjorneberg. 2011. Concentrations of airborne endotoxin and microorganisms at a 10,000 cow open-freestall dairy. J. Anim. Sci. 176:426-434.
Dungan, R.S. 2012. Use of a culture-independent approach to characterize aerosolized bacteria at an open-freestall dairy operation. Environ. Int. 41:8-14.
Acknowledgements
Independent Dairy Environmental Action League (IDEAL)
The authors are solely responsible for the content of these proceedings. The technical information does not necessarily reflect the official position of the sponsoring agencies or institutions represented by planning committee members, and inclusion and distribution herein does not constitute an endorsement of views expressed by the same. Printed materials included herein are not refereed publications. Citations should appear as follows. EXAMPLE: Authors. 2013. Title of presentation. Waste to Worth: Spreading Science and Solutions. Denver, CO. April 1-5, 2013. URL of this page. Accessed on: today’s date.
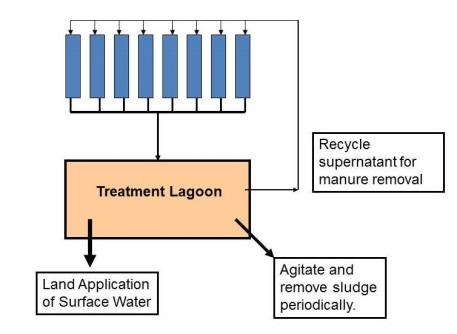
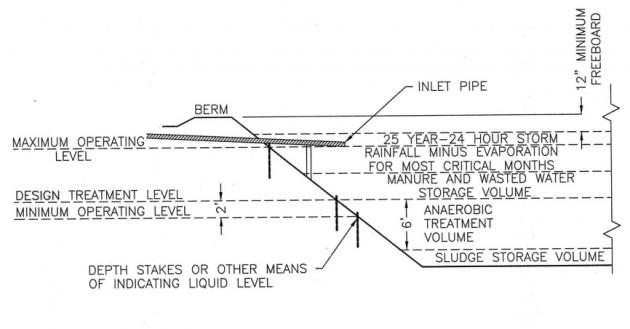
Treatment lagoons are one of the most common biological treatment methods used on swine and dairy farms that use recycled supernatant as a means to remove manure from animal housing facilities by flushing. A properly functioning treatment lagoon will provide adequate treatment to allow reuse of the effluent without compromising animal health or generating strong odor.
A typical treatment lagoon system used on swine and dairy farms.
A lagoon should have a minimum biological treatment volume and provide sufficient volume for settling and storage of sludge to provide the needed levels of treatment prior to recycling. This presentation will provide a summary of the benefits of using liquid-solid separation to maintain and potentially reduce the required treatment volume, reduce sludge build-up, increase useful life of an existing lagoon, and to reduce the size of new lagoons based on the ASABE Standard. Information will also be provided concerning desired loading rates and supernatant concentrations for recycling, and impacts of odor production potential.
Components of a treatment lagoon for animal manure.
What Did We Do?
The ASABE Lagoon Standard (ANSI/ASAE EP403.4, ASABE 2011) was used to calculate lagoon treatment volumes for swine and dairy manure using volatile solid loading rates for a variety of climates ranging from a cold climate, such as Southern Minnesota (3 lb VS/1000 ft3-day), to a hot climate, such as Central Florida (6.0 lb VS/1000 ft3-day). Liquid-solid separation methods can provide a reduction in the mass of VS in the liquid fraction by 10% to 80%. The corresponding reduction in treatment volume were also determined for swine and dairy manure over a wide range of climates.
The ASABE Standard also provides a method to estimate sludge storage volume requirments per year for swine and dairy lagoons that is based on the total solids loaded into a lagoon. The impact of implementing solid-liquid separation on the sludge accumulation rate was also destermined for TS removals in the range of 20% to 80%.
What Have We Learned?
The percent reduction in treatment volume of a lagoon was the same as the mass fraction of VS removed by liquid-solid separation. That is, a 30% reduction in VS provided a 30% reduction in treatment volume. The practical result is that implementation of liquid-solid separation system that can remove 30% of the VS would allow pork producers in the Midwest to use similar treatment volumes as pork producers located in South Carolina or Central Georgia.
Liquid-solid separation also reduced sludge build up in lagoons by the same percentage as the TS removal efficiency. Therefore, a 30% reduction in TS will reduce sludge accumulation by30%.
Reduction in TS and VS loading can help to reduce odors from lagoons, reduce the size of the lagoon needed to provide treatment, and can yield better treated surface water for flushing manure from the buildings.
Removal of large portions of the VS (60% to 80% reduction) using high-rate liquid-solid separation methods has the added benefit of greatly reducing the amount of the organic-N loaded. As a result, less organic-N will be converted to ammonium-N in a lagoon where a portion will be lost to the air as ammonia.
Future Plans
This information will be published as part of a new USDA-NRCS technical note or as part of the National Engineering Handbook, Part 651 Agricultural Waste Management Field Handbook.
Authors
Dr. John P. Chastain, Professor and Extension Agricultural Engineer, School of Agricultural, Forestry, and Environmental Sciences, Clemson University jchstn@clemson.edu
Jeffrey P. Porter, P.E. Environmental Engineer Manure Management Team USDA-Natural Resources Conservation Service
Additional Information
Solid-Liquid Separation Alterntives for Manure Handling Treatment, a new USDA-NRCS technical note or as part of the National Engineering Handbook, Part 651 Agricultural Waste Management Field Handbook.
Acknowledgements
Piedmont-South Atlantic Coast Cooperative Ecosystems Studies Unit (CESU). This Cooperative and Joint Venture Agreement allowed for this work to take place.
Manure Management Team USDA-Natural Resources Conservation Service, Greensboro, NC
Additional support was provided by the Confined Animal Manure Managers Program, Clemson Extension, Clemson University, Clemson, SC.
The authors are solely responsible for the content of these proceedings. The technical information does not necessarily reflect the official position of the sponsoring agencies or institutions represented by planning committee members, and inclusion and distribution herein does not constitute an endorsement of views expressed by the same. Printed materials included herein are not refereed publications. Citations should appear as follows. EXAMPLE: Authors. 2013. Title of presentation. Waste to Worth: Spreading Science and Solutions. Denver, CO. April 1-5, 2013. URL of this page. Accessed on: today’s date.
The Anaerobic Digester Workforce Development Project is a project funded by the New York State Energy Research and Development Authority, aimed at developing and delivering high quality educational programs targeted to a range of workforces within the dairy farm-based anaerobic digestion (AD) sector of the clean energy field.
A goal of the project was to form a farmer driven discussion group among existing AD owners and operators. Farmers value and learn from the insights of fellow producers because they trust the experience and knowledge of others who are in situations similar to their own. This is especially true when adopting new technology. The purpose of this discussion group was to allow farmers an opportunity to learn from each other by sharing their real world experiences integrating and operating an anaerobic digester system into their farm business. Realizing that frequent, long-distance travel of all involved was a barrier to continued, dedicated involvement, the group opted to pursue a virtually-based discussion group platform. Farmers from across the state were linked via an online meeting site. This is an efficient method to allow farmers to interact with each other in a meaningful way without leaving their farm. The use of high definition video conferencing enhanced the interaction considerably. There have been many lessons learned from this challenging venture, as well as many successful communication strategies to share.
What Did We Do?
Realizing that frequent, long-distance travel of all involved was a barrier to continued, dedicated involvement, the group opted to pursue a virtually-based discussion group platform. Farmers from across the state were linked via an online meeting site. This is an efficient method to allow farmers to interact with each other in a meaningful way without leaving their farm.
What Have We Learned?
The focus of this presentation is to introduce the topic of forming and facilitating farmer based discussion groups with an emphasis on distance learning. By using online meeting and video conferencing farmers from across geographic areas can meet and engage in meaningful dialogue. This is especially useful when producers are implementing new technology in which they have no or limited experience. The opportunity to have an open dialogue with other farmers that have real world experience with the technology is invaluable. The experience and exchange of knowledge between farmers assists in the implementation and operation of the technology.
Future Plans
The virtual discussion group will continue to meet and develop. As we gain more experience and farmers become more comfortable with this method of interact we expect for the discussions to increase in value and effectiveness.
Authors
Kathryn Barrett, Sr. Extension Associate, Cornell University, ProDairy Program, Director of Dairy Profit Discussion Group Program. kfb3@cornell.edu
Acknowledgements
The Anaerobic Digester Workforce Development Project is a project funded by the New York State Energy Research and Development Authority, aimed at developing and delivering high quality educational programs targeted to a range of workforces within the dairy farm-based anaerobic digestion (AD) sector of the clean energy field.
The authors are solely responsible for the content of these proceedings. The technical information does not necessarily reflect the official position of the sponsoring agencies or institutions represented by planning committee members, and inclusion and distribution herein does not constitute an endorsement of views expressed by the same. Printed materials included herein are not refereed publications. Citations should appear as follows. EXAMPLE: Authors. 2013. Title of presentation. Waste to Worth: Spreading Science and Solutions. Denver, CO. April 1-5, 2013. URL of this page. Accessed on: today’s date.
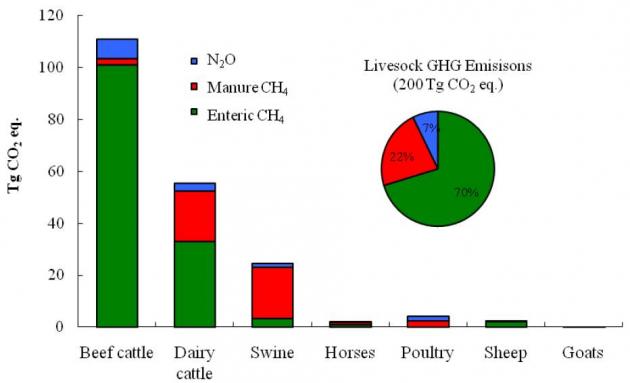
Agriculture is both a source and sink for greenhouse gases (GHG). A source is a net contribution to the atmosphere, while a sink is a net withdrawal of greenhouse gases. In the United States, agriculture is a relatively small contributor, with approximately 8% of the total greenhouse gas emissions, as seen below. Most agricultural emissions originate from soil management, enteric fermentation (the ruminant digestion process that produces methane), energy use, and manure management. The primary greenhouse gases related to agriculture are carbon dioxide, methane, and nitrous oxide. Within animal production, the largest emissions are from beef followed by dairy, and largely dominated by the methane produced in during cattle digestion.
U.S. greenhouse gas inventory with electricity distributed to economic sectors (EPA, 2013)
U.S. agricultural greenhouse gas sources (Adapted from Archibeque, S. et al., 2012)
Greenhouse gas emissions from livestock in 2008 (USDA, 2011)
Soil Management
Excess nitrogen in agriculture systems can be converted to nitrous oxide through the nitrification-denitrification process. Nitrous oxide is a very potent greenhouse gas, with 310 times greater global warming potential than carbon dioxide. Nitrous oxide can be produced in soils following fertilizer application (both synthetic and organic).
As crops grow, photosynthesis removes carbon dioxide from the atmosphere and stores it in the plants and soil life. Soil and plant respiration adds carbon dioxide back to the atmosphere when microbes or plants breakdown molecules to produce energy. Respiration is an essential part of growth and maintenance for most life on earth. This repeats with each growth, harvest, and decay cycle, therefore, feedstuffs and foods are generally considered to be carbon “neutral.”
Some carbon dioxide is stored in soils for long periods of time. The processes that result in carbon accumulation are called carbon sinks or carbon sequestration. Crop production and grazing management practices influence the soil’s ability to be a net source or sink for greenhouse gases. Managing soils in ways that increase organic matter levels can increase the accumulation (sink) of soil carbon for many years.
Animals
The next largest portion of livestock greenhouse gas emissions is from methane produced during enteric fermentation in ruminants – a natural part of ruminant digestion where microbes in the first of four stomachs, the rumen, break down feed and produce methane as a by-product. The methane is released primarily through belching.
As with plants, animals respire carbon dioxide, but also store some in their bodies, so they too are considered a neutral source of atmospheric carbon dioxide.
Manure Management
A similar microbial process to enteric fermentation leads to methane production from stored manure. Anytime the manure sits for more than a couple days in an anaerobic (without oxygen) environment, methane will likely be produced. Methane can be generated in the animal housing, manure storage, and during manure application. Additionally, small amounts of methane is produced from manure deposited on grazing lands.
Nitrous oxide is also produced from manure storage surfaces, during land application, and from manure in bedded packs & lots.
Other sources
There are many smaller sources of greenhouse gases on farms. Combustion engines exaust carbon dioxide from fossil fuel (previously stored carbon) powered vehicles and equipment. Manufacturing of farm inputs, including fuel, electricity, machinery, fertilizer, pesticides, seeds, plastics, and building materials, also results in emissions.
To learn more about how farm emissions are determined and see species specific examples, see the Carbon Footprint resources.
To learn about how to reduce on-farm emissions through mitigation technology and management options, see the Reducing Emissions resources.
Additional Resources
Additional Animal Agriculture and Climate Change Resources
Author: Crystal A. Powers, UNL
Reviewers:
Manage Cookie Consent
To provide the best experiences, we use technologies like cookies to store and/or access device information. Consenting to these technologies will allow us to process data such as browsing behavior or unique IDs on this site. Not consenting or withdrawing consent, may adversely affect certain features and functions.
Functional
Always active
The technical storage or access is strictly necessary for the legitimate purpose of enabling the use of a specific service explicitly requested by the subscriber or user, or for the sole purpose of carrying out the transmission of a communication over an electronic communications network.
Preferences
The technical storage or access is necessary for the legitimate purpose of storing preferences that are not requested by the subscriber or user.
Statistics
The technical storage or access that is used exclusively for statistical purposes.The technical storage or access that is used exclusively for anonymous statistical purposes. Without a subpoena, voluntary compliance on the part of your Internet Service Provider, or additional records from a third party, information stored or retrieved for this purpose alone cannot usually be used to identify you.
Marketing
The technical storage or access is required to create user profiles to send advertising, or to track the user on a website or across several websites for similar marketing purposes.