Due to a technical glitch, the beginning of the recorded presentation was not recorded. Please accept our apologies.
Purpose
As the adoption of dairy manure storage systems has increased as a best management practice for protecting water quality, the anaerobic conditions in these systems has inadvertently led to an increase in emission of the greenhouse gas methane. Current inventory and modeled estimates of this potent greenhouse gas are based on limited datasets, and there is a need for methodologies to better quantify these emissions so that the impacts of storage conditions, manure treatments and seasonality can be better assessed, mitigation strategies can be implemented, and greenhouse gas reduction estimates can be correctly accounted for.
What Did We Do?
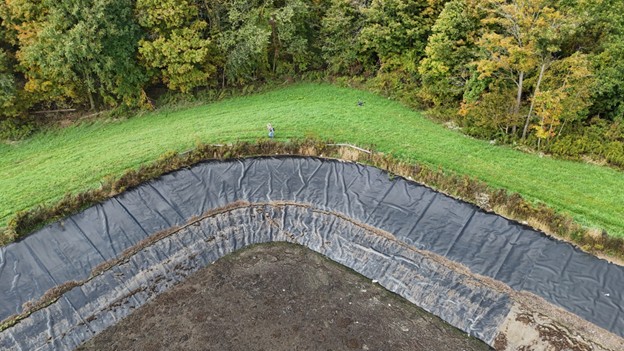
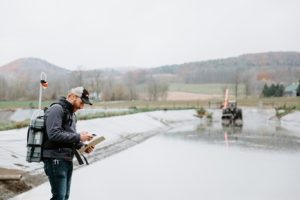 We are developing a ground-based, mobile measurement approach where manure storage systems are circled with a backpack methane gas analyzer and measurements are integrated with on-site wind measurements to calculate emission flux rates. Twelve commercial dairy farm manure storage systems, representing a range of herd sizes and pre-storage manure treatments are collaborating on the research. Once per month, each manure storage structure at each site is circled 10 consecutive times with a methane gas analyzer. A drone equipped with a separate methane analyzer is also used to verify ground-based measurements amidst the methane plumes. Divergence (Gauss’s) theorem is then applied to concentration measurements and anemometer wind data to estimate the net rate of methane flux. These observed methane emission fluxes are compared to International Panel of Climate Change (IPCC) modeled emissions as well as state inventories.
What Have We Learned?
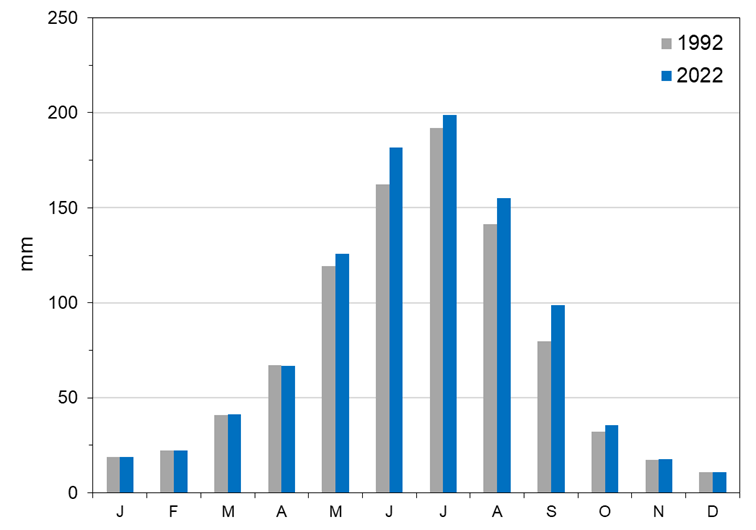
 We find that this methodology provides a reliable, cost-effective way to estimate methane emissions from manure storages. Observed emissions track modeled emissions with similar magnitudes, though models may be overestimating emissions during the growing season and underestimating during the winter months in this region (Figure 1). While emissions patterns are generally similar for each of the farm sites, with some farms and some individual monthly observational estimates there can be substantial deviation from predicted emission rates.
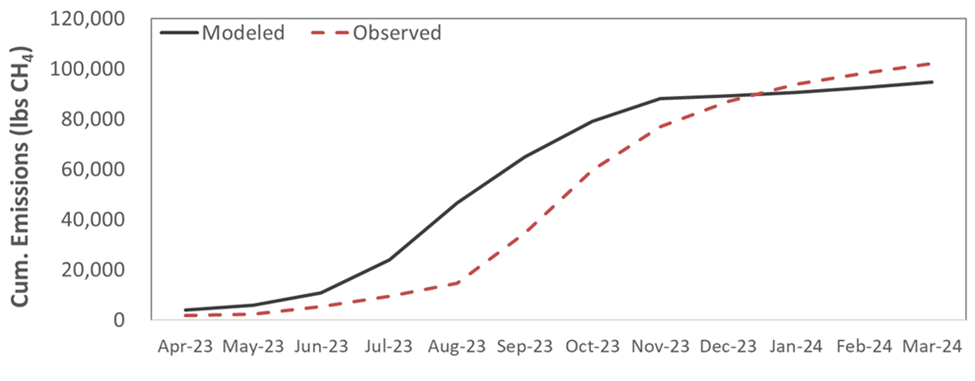
- Figure 1. Modeled and measured cumulative methane emissions from a dairy manure storage system over a 12-month period.
Future Plans
 Evaluation of 2024 field data is ongoing, and we will continue to measure methane around storages with ground-based and drone measurements into the summer of 2025. We will explore plume dynamics and the effects of pre-storage treatments on measured methane emission flux. For select sites, measurements will be expanded to include continuous, open-path laser absorption spectroscopy to verify this novel measurement approach, footprint emissions, and explore the implications of pre-storage manure treatments.
Authors
Presenting & corresponding author
Jason P. Oliver, Dairy Environmental Systems Engineer, Cornell University | PRO-DAIRY, jpo53@cornell.edu
Additional authors
Lauren Ray, Agricultural Sustainability and Energy Engineer, Cornell University | PRO-DAIRY
Eric Leibensperger, Associate Professor, Physics and Astronomy, Ithaca College
Additional Information
https://leibensperger.github.io/
Acknowledgements
Funding for this work was provided by the New York State Department of Agriculture and Markets. Agreement # CM04068CO
The authors are solely responsible for the content of these proceedings. The technical information does not necessarily reflect the official position of the sponsoring agencies or institutions represented by planning committee members, and inclusion and distribution herein does not constitute an endorsement of views expressed by the same. Printed materials included herein are not refereed publications. Citations should appear as follows. EXAMPLE: Authors. 2025. Title of presentation. Waste to Worth. Boise, ID. April 7–11, 2025. URL of this page. Accessed on: today’s date.
 Furthermore, this approach facilitates exposure to specialized aspects of the dairy industry that may otherwise remain unexplored, even by students residing in regions with high dairy production. By integrating diverse educational strategies, the curriculum broadens students’ conceptual understanding of sustainable dairy waste management, reinforcing the applicability of these practices within both local and global agricultural contexts.