Updating manure N and P credits: A growth chamber study

For a long time, farmers have realized the benefits of using manure as a nutrient source.  The ratio of various nutrients in manure, however, rarely matches the exact plant needs. Consequently, farmers must choose between overapplying some nutrients, or underapplying others and meeting the remaining needs with commercial fertilizers. Figuring out nitrogen (N) credits can be a difficult task since the total amount of N found in manure is not fully available the year of application, nor even after the second year of application. In addition, understanding P availability in manure is necessary because excess P can ultimately lead to eutrophication of surface waters. The amount of N that is available will depend on several factors such as animal species, bedding (if any), manure storage, and application method. We assume approximately 80% of the total manure P is available the first year, but even this can vary depending on soil texture, manure chemistry, and weather conditions. Current University of Minnesota recommendations help determine N and P credits for a variety of manures (Hernandez and Schmitt 2012). These recommendations were developed several decades ago and need an update since the diets of animals, storage of manures, and manure application equipment have changed over the years. Therefore, the primary purpose of this study is to estimate N and P mineralization from a variety of manures and soil types across different temperature regime. Our goal is to verify and/or update N and P credit recommendations from manure so that farmers are able to make better decisions when purchasing and applying commercial fertilizers in following years.  

What did we do?

Laboratory incubations were used to assess N and P release characteristics from a variety of manures in several different soil types. The incubation studies were a complete factorial with 4 replications and with manure type, soil type, and temperature as the main factors. We also included a control treatment that did not include any manure application to see how much nitrogen and phosphorus mineralized from the soils themselves. We tested 8 manures, including: dairy liquid (separated and raw [non-separated]), swine liquid (from a finishing house and a sow barn), beef manure (solid bedded pack and liquid from a deep pit), and poultry (turkey litter and chicken layer manure). Manure analyses to determine nutrient content were conducted on all samples prior to incubations. Soils for the incubations included a coarse textured soil from the Sand Plain Research Center at Becker, MN; a medium textured soil from a research field near Rochester, MN; and a fine textured soil from the West Central Research and Outreach Center in Morris, MN. Soils were collected from the top six inches of soil at each location in bulk and then air dried, ground down to pass a 2-mm sieve, and analyzed for nutrient and organic matter content.  

One liter clear glass canning jars were filled with 200 g of sieved soil and were kept at 60% of field capacity which was maintained by weighing every 4-6 days and adding deionized water as needed to replace the weight lost. We used the University of Minnesota guidelines and manure analysis results to calculate the appropriate application rate for each manure type. During the incubation study, the temperature inside the incubator was kept at either 25⁰C (77⁰F). We collected subsamples at 0, 7, 14, 28, and 56 days after the experiment had begun. Subsamples were destructively analyzed for potassium chloride extractable ammonium and nitrate and Bray-1 or Olsen extractable phosphate. Figure 1 shows the schematics of our experimental set-up and components.  

Figure 1: Growth chamber incubation study experimental set-up.

What have we learned?

At the time of writing, the experiment has only been run at one temperature, 25⁰C (77⁰F) and subsamples for days 0-28 have been collected. Ammonium and nitrate have been analyzed for subsamples for days 0-14. The remaining treatments will be completed later in 2019. Statistical analyses have not been conducted at this time.

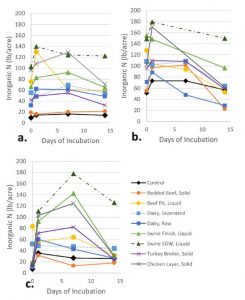
The results of the initial soil and manure tests can be found in Tables 1 and 2, respectively. This will give an idea of the starting conditions of the soils and manures. For visual reference, Figure 2 shows the inorganic N (ammonium + nitrate) from each treatment from days 0-14 for the incubation at 25⁰C. The control samples showed that more inorganic N was present in the medium textured soil than the other soils. In general, the swine manure from both finisher and sow barns released the most inorganic N compared with other manures. Of the beef manures, the liquid deep pit manure tended to release more inorganic N than the bedded pack manure, likely due to the lack of bedding to tie up nitrogen. Of the dairy manures, the raw and liquid separated tended to release inorganic N similarly, except in the medium textured soil where the liquid separated manure released more inorganic N. Across soil types, the inorganic N release tended to be stable in the coarse textured soil, while in the medium and fine textured soil, it appears to have increased initially then slowly decreased. It is unclear why this may have happened but could be due to volatilization of ammonium, denitrification of nitrate, or immobilization of N into organic forms. More tests are needed and will be completed later in 2019.

Table 1. Initial characteristics of three soil types used in this study: coarse textured soil from Becker, MN; medium textured soil from Rochester, MN; and a fine-textured soil from Morris, MN.
Soil Characteristics Soil Textural Class
Coarse Medium Fine
Organic matter (%) 1.1 1.0 3.3
pH 5.1 5.2 7.9
Phosphorus – Olsen (ppm) 11 8 7
Potassium (ppm) 95 101 140
Magnesium (ppm) 42 49 570
Calcium (ppm) 274 310 3482
Ammonium (ppm) 3.4 2.8 8.6
Nitrate (lb/acre) 3.0 2.5 8.5
Table 2. Initial characteristics of eight manure types used in this study. The units of nutrients are in pounds per ton for solid manure and in pounds per 1000 gallons for liquid manure.
Species Type Manure Type Moisture Total N Ammonium-N Total P (as P2O5) Total K (as K2O) C:N Ratio
(%) (lbs per unit) (lbs per unit) (lbs per unit) (lbs per unit)
Beef Bedded Pack, Solid 60.5 13.43 2.37 9.59 18.01 22:1
Deep Pit, Liquid 86.6 56.72 36.7 23.43 30.83 9:1
Dairy Separated, Liquid 93.2 32.7 15.8 13.31 29.26 7:1
Raw, Liquid 88.9 33.17 15.66 13.08 31.29 13:1
Swine Finisher, Liquid 86.8 59.16 41.63 37.63 27.35 9:1
Sow, Liquid 99.3 16.5 15.69 1.38 11.34 1:1
Poultry Chicken Layer, Solid 48.6 55.51 14.39 35.78 25.91 7:1
Turkey Litter, Solid 53.0 28.2 13.16 26.69 28.65 12:1
Figure 2. The amount of inorganic-N (the sum of ammonium-N + nitrate-N) in soil mixed with various manure types in: a. coarse textured soil from Becker, MN; b. medium textured soil from Rochester, MN; and c. fine textured soil from Morris, MN.

Future plans

We plan to analyze all the 25 °C samples for nitrogen and phosphorus as well as samples from experiment at 15 and 5 °C this year. We also collected ammonia (NH3) gas samples from the headspace of each jars. We plan to analyze these samples to understand the effects of manure application on ammonia volatilization losses. In addition, on a separate set of experiments we deployed anion and cation exchange resins in each jar. These resins were replaced each week on average. We plan to extract these resins for N and P.

Authors

Dr. Suresh Niraula

Postdoctoral Associate

Department of Soil, Water, and Climate

University of Minnesota (sniraula@umn.edu)


Dr. Melissa Wilson

Assistant Professor and Extension Specialist

Manure Management & Water Quality

Department of Soil, Water, and Climate

University of Minnesota

(Corresponding author email: mlw@umn.edu)

Acknowledgements

This material is based on work that is supported by the Sugarbeet Research and Education Board of Minnesota and North Dakota as well as the Agricultural Fertilizer Research and Education Council of Minnesota.

Additional information

Hernandez JA, Schmitt MA. 2012. Manure management in Minnesota. Saint Paul (MN): University of Minnesota Extension [accessed 24 Nov 2017].

Pagliari PH, Laboski CAM. 2014. Effects of manure inorganic and enzymatically hydrolyzable phosphorus on soil test phosphorus. Soil Soc. of Am. J. 78(4): 1301-1309.

Russelle MP, Blanchet KM, Randall GW, Everett LA. 2009. Characteristics and nitrogen value of stratified bedded pack dairy manure. Crop Management 8(1). https://dl.sciencesocieties.org/ publications/cm/abstracts/8/1/2009-0717-01-RS.

The authors are solely responsible for the content of these proceedings. The technical information does not necessarily reflect the official position of the sponsoring agencies or institutions represented by planning committee members, and inclusion and distribution herein does not constitute an endorsement of views expressed by the same. Printed materials included herein are not refereed publications. Citations should appear as follows. EXAMPLE: Authors. 2019. Title of presentation. Waste to Worth. Minneapolis, MN. April 22-26, 2019. URL of this page. Accessed on: today’s date.
Survey of Pennsylvania Manure Hauler and Broker Certification Program

This presentation will provide an overview of Pennsylvania’s Commercial Manure Hauler and Broker Certification program and highlight results of the industry survey. Pennsylvania’s Manure Hauler and Broker Certification Program was mandated by state law in 2006. The unique program has five certification levels, each with unique education requirements (Table 1). In 2018, a survey was completed by 218 certified individuals at eleven Continuing Education Credit events.

Analysis of the survey revealed a significant positive relationship between certification level and score on knowledge questions. Company owners, managers and supervisors are required to attend more educational programs, and these individuals scored higher on knowledge questions than their employees. Those individuals surveyed worked on an average of 38.5 farms per year.  Results of the survey indicated that the program empowers industry professionals with science-based knowledge. Thus, enabling wise field-level decisions across many farms, acres, and manure handling scenarios with positive implications on water quality.

The goals of the survey were to 1) gather descriptive information about certified individuals, 2) test certified individual on key program competencies, and 3) use test results as a tool for evaluation of educational impact and shortfalls to guide future programming. Furthermore, results can validate program effectiveness in discussions with local, state, and federal agencies. Such a body of facts is pertinent and timely as governmental agencies and agricultural interest groups work together to meet goals established for the Chesapeake Bay and beyond.

Program educators feel that survey results supported their thoughts that educational efforts and certification help the industry to continually improve responsible handling of manure nutrients in the state and affirm that these programs have real favorable impacts on water and air quality.

A peer-reviewed journal article is expected to be available later in 2019 that will include greater depth of information on the program and survey.

Table 1: Description of Certification Levels and Continuing Education Credit (CEC) requirements of Pennsylvania’s Commercial Manure Hauler and Broker Certification Program.
Certification Level Brief Description Certification Education Requirements Continuing Education Credit (CEC) Requirements
Manure Hauler Level 1 Transport but not land-apply manure. Completes verification form and understanding checklist. None. Must complete checklist annually.
Manure Hauler Level 2 Transport and land-apply manure. Must be supervised. Studies workbook and completes examination at county office. 6 CECs in 3-year period.
Manure Hauler Level 3 Owner or manager. Can supervise Hauler Level 2 ‘s. Attends Act 49 Orientation certification class and completes examination. 9 CECs in 3-year period.
Manure Broker Level 1 Assumes ownership of manure and determines its end-use. Cannot write Nutrient Balance Sheet. Can supervise Hauler Level 2 ‘s. Attends Act 49 Orientation certification class and completes examination. 9 CECs in 3-year period.
Manure Broker Level 2 Assumes ownership of manure and determines its end-use. Can write Nutrient Balance Sheet. Can supervise Hauler Level 2 ‘s. Can take additional course to write P-Index plans. Attends Act 49 Orientation certification class and completes examination. Attends Nutrient Balance Sheet class and completes examination. 12 CECs in 3-year period, 3 or more of which must be specific to Nutrient Balance Sheets.

Author:

Robert Meinen

Senior Extension Associate

Department of Animal Science

The Pennsylvania State University

rjm134@psu.edu


The authors are solely responsible for the content of these proceedings. The technical information does not necessarily reflect the official position of the sponsoring agencies or institutions represented by planning committee members, and inclusion and distribution herein does not constitute an endorsement of views expressed by the same. Printed materials included herein are not refereed publications. Citations should appear as follows. EXAMPLE: Authors. 2019. Title of presentation. Waste to Worth. Minneapolis, MN. April 22-26, 2019. URL of this page. Accessed on: today’s date.
New Technologies to Help Us Share Stories and Ideas

This two-part workshop exposes participants to a wide variety of existing and new technology, and how these applications can enhance learning and programming.

During each part of the session, there will be a series of short presentations, opportunity for sharing of ideas, followed by time to ask questions and try the tech at tables around the room.

Session moderated by Alison Holland, University of Minnesota Extension

Part 1: Bringing Science to Life Through Immersive Imagery and 3-D Modeling

Megan Weber and Angela Gupta, University of Minnesota Extension

Lecture-free, interactive online course

3D IS models

Augmented reality in IS

360-imagery

Part 2: New Education and Engagement Strategies with Familiar Tech Tools

Pollinator Qualtrics Survey

Julie Weisenhorn, University of Minnesota Extension

Qualtrics: Not Just for Surveys Anymore! Create Online Modules & Learning Centers

Abby Neu, University of Minnesota Extension

Mapping for Teaching and Showing Program Impact

Alison Holland, University of Minnesota Extension


The authors are solely responsible for the content of these proceedings. The technical information does not necessarily reflect the official position of the sponsoring agencies or institutions represented by planning committee members, and inclusion and distribution herein does not constitute an endorsement of views expressed by the same. Printed materials included herein are not refereed publications. Citations should appear as follows. EXAMPLE: Authors. 2019. Title of presentation. Waste to Worth. Minneapolis, MN. April 22-26, 2019. URL of this page. Accessed on: today’s date.

Comparison between Different Approaches to Estimating Nutrient Balances in Livestock Production Watersheds

Nutrient budgets have been historically developed on livestock farms to improve nutrient use efficiency and reduce field losses. There is growing interest in developing nutrient budgets, particularly for nitrogen and phosphorus, on larger spatial scales such as watersheds and river basins to guide water quality improvement efforts. A big obstacle to developing such budgets is the lack of access to management practices on individual farms. On the other hand, publicly-available data for larger spatial scales, such as survey and census data compiled by the U.S. Department of Agriculture, is typically aggregated to the county or state level. There is a need for a methodology that reliably estimates nutrient budgets in individual watersheds across different production conditions. This study investigates the potential of incorporating spatial data products to refine estimated nutrient budgets. Three different approaches for nutrient budget development will be evaluated across different watersheds, HUC-10 level. Sources of uncertainty in the developed nutrient budgets will be assessed and their respective contribution to the overall budgets will be quantified.

Corresponding Author

Sharara Mahmoud, North Carolina State University, m_sharara@ncsu.edu

Other authors

Horacio Aguirre-Villegas, University of Wisconsin-Madison

Rebecca Larson, University of Wisconsin-Madison


The authors are solely responsible for the content of these proceedings. The technical information does not necessarily reflect the official position of the sponsoring agencies or institutions represented by planning committee members, and inclusion and distribution herein does not constitute an endorsement of views expressed by the same. Printed materials included herein are not refereed publications. Citations should appear as follows. EXAMPLE: Authors. 2019. Title of presentation. Waste to Worth. Minneapolis, MN. April 22-26, 2019. URL of this page. Accessed on: today’s date.

Development of Short Educational Videos for CAFO Related Topics

Concentrated animal feeding operations (CAFOs) are encountering more resistance. There are cases where citizens file suit to stop application of a new or expansion of animal production facility; others petition the county commissioners to stop the facility via zoning or health ordinances. When extension personnel were asked about CAFOs, it became apparent that some user-friendly and brief information pieces are needed, especially those that are based in fact and able to capture the audience’s attention and address their emotions. Well-managed CAFOs tend to have less nutrient management and odor nuisance issues, and when needed, there are options to mitigate odor and improve nutrient management.  Many CAFOs have been shown to benefit the local economy, which is critical to rural communities. The videos are intended to be short so that the user can stay interested and choose next topics of interests. The goal is to capture users’ attention and provide them with essential facts rather than trying to push information to them.

What did we do?

The University of Missouri Extension team have created a series of short whiteboard videos that target concerned local citizens and county commissioners seeking information about the impacts of CAFOs on environment, economy, antibiotics, and health. Scripts were developed by the faculty based on facts and peer-reviewed publications. Artists were hired to develop the whiteboard videos. A total of five videos were developed in the first production round and posted onto a website. A website and YouTube Channel were created to present the videos.

What we have learned?

The team created the videos and showed to classes and university staff, to collect feedback and ideas to improve the videos. Iteration of the scrips, communication with the artists, panel review for clarity and improvement, are critical to the video production.

Implications of the project or research

General public who want to learn more about CAFOs or concerned about the potential impacts of newer, intensive animal farms are able to access research based information to answer their questions. Between 7/10/2018 and 3/1/19 the videos have a total of 963 views, CAFO Environmental Impact is the most viewed at 336.

What should people remember as take-home messages from your presentation?

More scientific based information and application of social media might be needed to convey more information, and stimulate non-agricultural and younger audiences to learn more about animal production facts.

Future plans

Based on the feedback and discussion, create more videos to promote science-based information pieces, to reach a broad audience.

Authors

Lim, Teng (Associate Professor and Extension Agricultural Engineer, Agricultural Systems Management, University of Missouri, limt@missouri.edu)

Massey, Ray; Bromfield, Cory; and Shannon, Marcia; University of Missouri

Additional information

Please visit https://www.youtube.com/channel/UCX-Y1Fuyi_l7SIs3y6u9Yhw to view the videos and http://agebb.missouri.edu/commag/cafo/ to find more information.

Acknowledgements

Four of the videos were developed by small grants provided by the U.S. Pork Center of Excellence.


The authors are solely responsible for the content of these proceedings. The technical information does not necessarily reflect the official position of the sponsoring agencies or institutions represented by planning committee members, and inclusion and distribution herein does not constitute an endorsement of views expressed by the same. Printed materials included herein are not refereed publications. Citations should appear as follows. EXAMPLE: Authors. 2019. Title of presentation. Waste to Worth. Minneapolis, MN. April 22-26, 2019. URL of this page. Accessed on: today’s date.

Transforming Manure from ‘Waste’ to ‘Worth’ to Support Responsible Livestock Production in Nebraska

The University of Nebraska – Lincoln (UNL) Animal Manure Management (AMM) Team has supported the environmental stewardship goals of Nebraska’s livestock and crop producers for many years using multiple traditional delivery methods, but recently recognized the need to more actively engage with clientele through content marketing activities. A current programming effort by the AMM Team to increase efficient manure utilization on cropland in the vicinity of intensive livestock production is the foundation for an innovative social media campaign.

What did we do?

content marketing plan
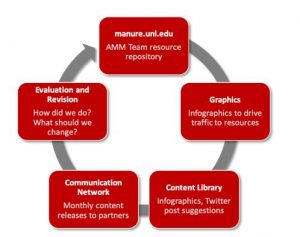
Figure 1. Content marketing plan to direct traffic to the AMM Team website.

While traditional extension outputs remain valuable for supporting the needs of clientele who actively seek out information on a topic, “content marketing” is a strategic tactic by which information is shared to not only attract and retain an audience, but to drive impactful action. Social media platforms are popular tools for delivery of current, research-based information to clientele; a key barrier to effectively using social media for content marketing by the project directors has been time. For instance, using Twitter efficiently requires regular attention to deliver messages frequently enough to remain relevant and to do so at times when user activity characteristics demonstrate the greatest opportunity for posts to be viewed and disseminated. Because this proved to be a challenge, a content marketing plan (Figure 1) was initiated using “waste to worth” as the topic of focus.

Three major components were identified as being critical to the success of the project (Figure 2): design of high-quality graphics that are tied to online content and resources and are suitable for use on Twitter, Facebook, or other social media platforms; development of a content library containing packaged content (graphic + suggested text for social media posts) that is easy to navigate and available for partners to access and utilize; and development  of a communication network capable of reaching a broad audience.

Graphics

circles containing graphics, content library and communication network
Figure 2. Components identified for successful content marketing effort.

An undergraduate Agricultural Leadership, Education and Communication (ALEC) student was recruited to support graphical content development using three basic guidelines: 1) Eye-catching but simple designs; 2) Associated with existing content hosted online; and 3) Accurate information illustrated Canva.com was utilized by team members  to design, review and edit social media content (Figure 3).

Content Library

Completed graphics are downloaded from Canva as portable network graphics (*.png) and saved to Box folders, by topic, using a descriptive title. When posting to social media, hashtags, mentions and links to other content help (a) reach users who are following a specific topic (e.g. #manure), (b) recognize someone related to the post (e.g. @TheManureLady) and (c) direct users to more content related to the graphic (e.g. URL to online article). For our content library, each graphic is accompanied by a file containing recommended text (Figure 4) that can be copied and pasted into Twitter or Facebook.

content example graphics
Figure 3. Graphical content examples for the “waste to worth” project
content example with sample text
Figure 4. Sample text to accompany a related image when posting on social media

Communication Network

content distribution network diagram
Figure 5. Content distribution network diagram.

Disseminating our messages through outlets outside the University was identified as a critical aspect of achieving the widespread message delivery that was desired. As such, agricultural partners throughout Nebraska were asked to help “spread the word about spreading manure” by utilizing our content in their social media outputs, electronic newsletters, printed publications, etc. Partners in this project include nearly 30 livestock and crop commodity organizations, media outlets, agricultural business organizations, and state agencies in Nebraska (Figure 5).

The effort to distribute content through the established communication network was launched in September 2018. Each month, three to four graphics with accompanying text are placed in a Box file to which all partners in the distribution network have access. Partners are notified via e-mail when new content is released. Folders containing prior months’ releases remain available to allow partners to re-distribute previous content if they wish.

What we have learned?

Since launching, 34 partnering organizations (Figure 6) have helped disseminate content to 50,000+ producers, advisors, allied industry members, and related professionals each month. Invited media appearances (radio and television) by team members have increased substantially in the past six months. For instance, the Nebraska Pork Producers Association hosts a weekly “Pork Industry Update” on a radio station that is part of the Rural Radio Network. Team members have recorded numerous interviews for broadcast during this weekly programming spot.

parter organizations
Figure 6. Partner organizations contributing to content distribution.

Page views within the AMM Team’s website (manure.unl.edu) increased by 139% from the fourth quarter of 2017 to the fourth quarter of 2018. Additional analytics are being collected to better define routes by which traffic is reaching the AMM Team’s website.

Future Plans

A survey is being prepared for distribution to audiences targeted through this project to assess impacts of this effort on changes in knowledge and behavior related to responsible use of manure in cropping systems, recognition of the AMM Team as a trusted source for manure and nutrient management information in Nebraska, and quality of AMM Team outputs.

Author

Amy Millmier Schmidt, Associate Professor, Biological Systems Engineering and Animal Science, University of Nebraska-Lincoln (UNL), aschmidt@unl.edu

Co-authors

Rick Koelsch, Professor, Biological Systems Engineering and Animal Science, UNL

Abby Steffen, UG Student, Ag Leadership, Education and Communication, UNL

Additional Information

Sign up for monthly notifications about new content from the UNL Animal Manure Management team at https://water.unl.edu/newsletter. Follow team members and the AMM Team.

Animal Manure Management Team    Amy Schmidt

Twitter: @UNLamm    Twitter: @TheManureLady

Facebook: https://www.facebook.com/UNLamm/    Facebook:  https://www.facebook.com/TheManureLady/


Rick Koelsch

Twitter: @NebraskaRick

Acknowledgements

Funding sources supporting this effort include We Support Ag, the Nebraska Environmental Trust, and the North Central Sustainable Agricultural Research and Education (NC-SARE) program.


The authors are solely responsible for the content of these proceedings. The technical information does not necessarily reflect the official position of the sponsoring agencies or institutions represented by planning committee members, and inclusion and distribution herein does not constitute an endorsement of views expressed by the same. Printed materials included herein are not refereed publications. Citations should appear as follows. EXAMPLE: Authors. 2019. Title of presentation. Waste to Worth. Minneapolis, MN. April 22-26, 2019. URL of this page. Accessed on: today’s date.

Greenhouse Gases and Ammonia Emissions from Application of Beef Manure and Urea in Corn

When manure is used as fertilizer on crop land, it has been shown to improve soil health and increase crop yields compared to commercial fertilizer. However, the nutrients in manure can be quite variable. Little is known about the potential emissions of ammonia and greenhouse gases (carbon dioxide, methane, and nitrous oxide) when manure is used as a nitrogen fertilizer. These emissions can lead to nutrient losses and environmental degradation. There is limited information on the influence of land application of solid beef manure on overall gaseous emissions. The ongoing integration of beef cattle manure and crop production, together with the impacts of management decisions needs to be understood to be sustainable at multiple levels. Furthermore, gaseous emissions and the mitigation from land-applied manure needs to be comparatively assessed with commercial fertilizer to fully understand management modifications on crop production. The purposes of this study were (i) to estimate daily and seasonal emission/uptake rates of CO2, CH4, N2O, and NH3 and soil inorganic N levels under different N sources in corn cropping system; (ii) to identify important soil and weather control variables for gaseous emissions; and (iii) to assess the effects of different N management strategies (manure vs. urea) on corn yield and grain quality.

What did we do?

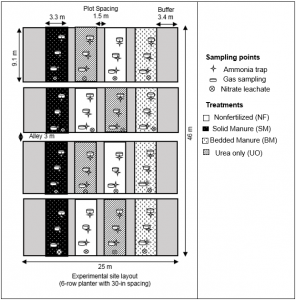
A 2-yr field experiment was conducted during the 2016 and 2017 growing seasons at the North Dakota State University (NDSU) research farm in Fargo, ND. The soil was poorly drained Fargo-Ryan silty clay. The experimental design was randomized with four replications. The treatments used were: (i) no fertilizer (NF) control (ii) solid beef cattle manure (SM) applied at 34 and 20.2 Mg ha1 in the preceding fall of Year 1 (15 Oct. 2015) and Year 2 (19 Oct. 2016), respectively; (iii) solid beef cattle manure with wheat straw bedding (BM) applied at 67.3 and 43 Mg ha1 in the preceding fall of Year 1 and Year 2, respectively; and (iv) urea only (UO) (46–0-0) applied at 220 kg ha1 in May of Year 1 (4 May 2016) and Year 2 (9 May 2017). In addition, 117 kg P ha1 (Year 1) and 88 kg P ha1 (Year 2) were applied to UO plots to meet the corn P demand. Phosphorus was supplied with triple superphosphate (0–45–0). For measuring N2O, CO2, and CH4 fluxes from the soil surface, headspace gas samples were collected using PVC static chambers. Ammonia volatilization losses from each plot were measured using a semi-static open chamber (trap). Emissions of GHGs and NH3 were calculated for (i) daily mean soil to atmosphere fluxes for Year 1 and Year 2 and (ii) cumulative growing season emission for Year 1 (May 2016–September 2016) and Year 2 (May 2017–September 2017).

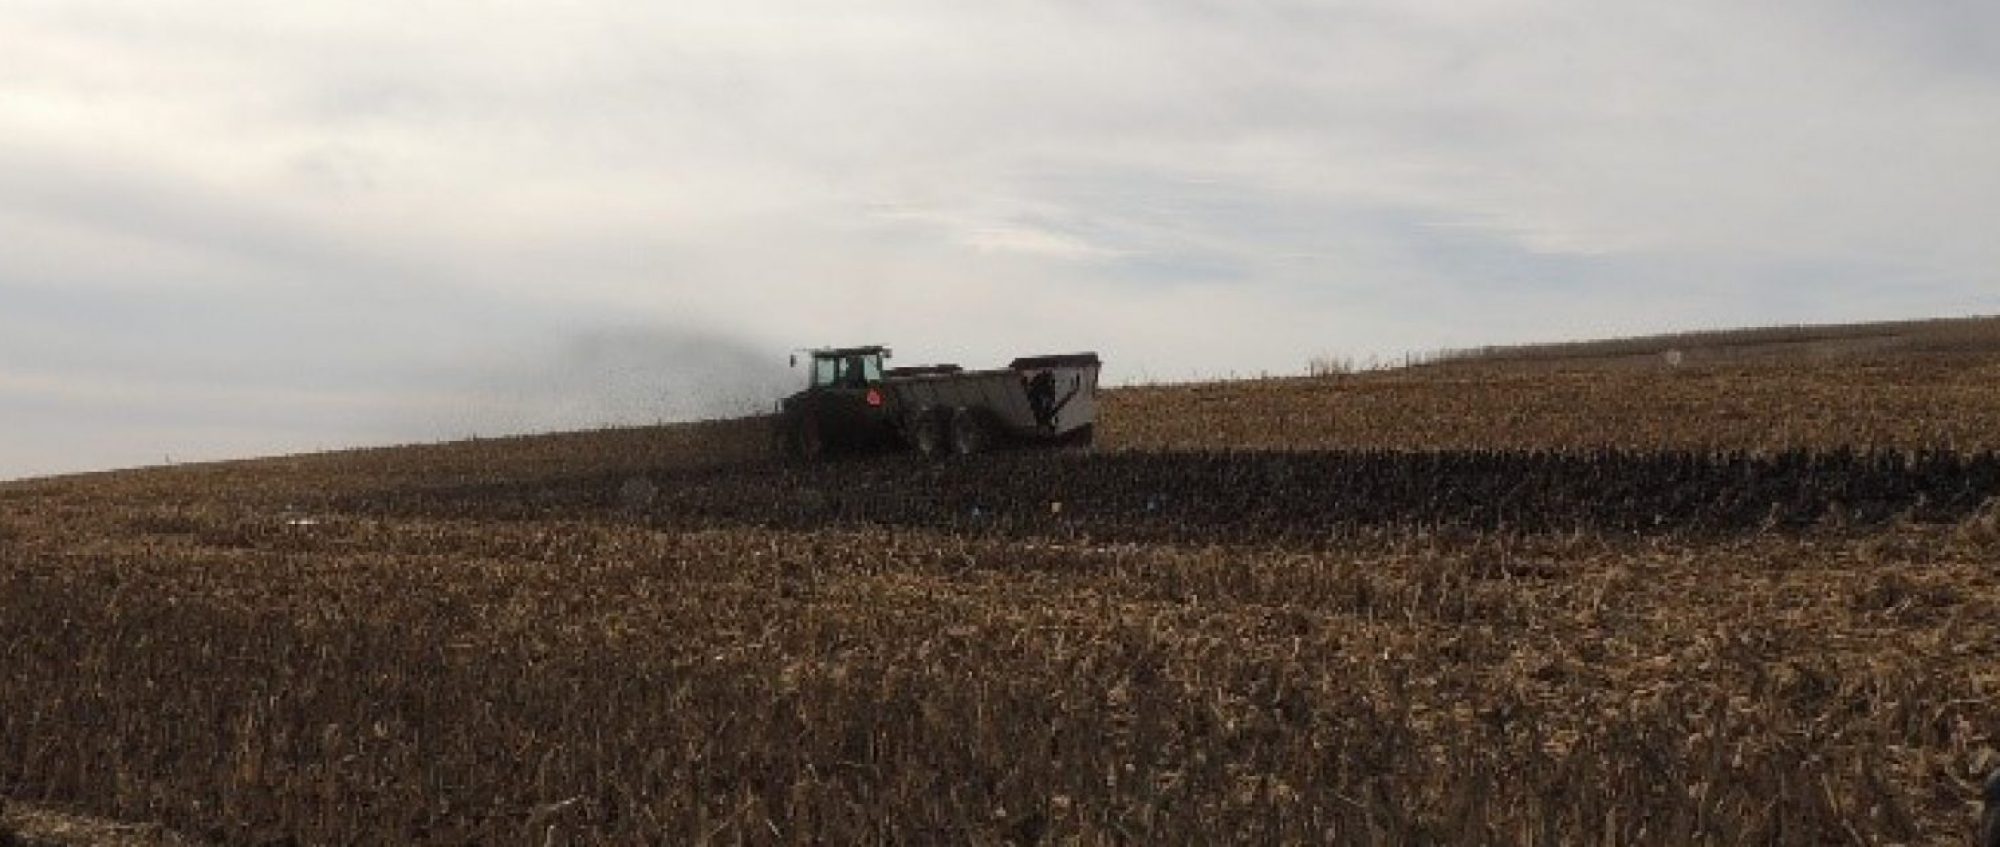
Figure: Experimental plots set up for measuring greenhouse gas fluxes using PVC static chambers from the soil surface in Fargo, North Dakota. (Photo credit: Suresh Niraula)

What have we learned?  

Manure applied to soil reduced cumulative nitrous oxide by 23% in SM and 31% in BM compared with the UO soil. Cumulative CO2 emission was 42% lower in UO than in SM or BM. Cumulative methane emission ranged from 0.04 (NF) to 0.21 (BM) kg CH4–C ha1, with the highest emission from BM. Cumulative NH3 emission was 11% lower from  manure treatments than UO. The results highlight the challenges that come with variability in manure, soil, and weather as well as the potential for meeting crop N demand while reducing greenhouse gas emissions when using manure as an N source. With contrasting weather patterns during the Year 1 and Year 2 growing seasons, this study emphasized the importance of long-term study to fully understand the emission trend because an individual year may not fully account for variabilities in soil N indices. In addition, further research on biogeochemical processes in soil of fall-applied manure compared with spring-applied urea is needed to overcome the limitation of this study.

Future plans

We recommend the use of an automated chamber from gaseous emissions to continuously build on existing guidelines for the use of static chambers. More research is needed in several other types of agricultural management systems to investigate the loss of soil and manure N.

Authors

Dr. Suresh Niraula, Postdoctoral Associate, Department of Soil, Water, and Climate – University of Minnesota (Corresponding author email: sniraula@umn.edu)

Dr. Shafiqur Rahman, Associate Professor Agricultural and Biosystems Engineering (North Dakota State University)

Dr. Amitava Chatterjee, Associate Professor Soil Science (North Dakota State University)

Acknowledgements

This material is based on work that is supported by the National Institute of Food and Agriculture, USDA (grant 2015-67020-23453). Any opinions, findings, conclusions, or recommendations expressed in this publication are those of the author(s) and do not necessarily reflect the view of the USDA.

Additional information

Jantalia, C., A. Halvorson, R. Follett, B. Alves, J. Polidoro, and S. Urquiaga. 2012. Nitrogen source effects on ammonia volatilization as measured with semi-static chambers. Agron. J. 104(6): 1595–1603. doi:10.2134/agronj2012.0210.

Parkin, T.B., and R.T. Venterea. 2010. Chapter 3. Chamber-Based Trace Gas Flux Measurements. In Follett, R.F. (ed.), Sampling Protocols. p. 3–39.

The authors are solely responsible for the content of these proceedings. The technical information does not necessarily reflect the official position of the sponsoring agencies or institutions represented by planning committee members, and inclusion and distribution herein does not constitute an endorsement of views expressed by the same. Printed materials included herein are not refereed publications. Citations should appear as follows. EXAMPLE: Authors. 2019. Title of presentation. Waste to Worth. Minneapolis, MN. April 22-26, 2019. URL of this page. Accessed on: today’s date.