
This webinar provides a basic understanding of PFAS. Some of the questions that are answered include: What is PFAS? Where did it come from? Where is it found? What are the potential issues related to PFAS? This is the first of a two-part series on PFAS and will focus mainly on water related factors and concerns. This presentation was originally broadcast on October 30, 2020. Continue reading “PFAS – What is in Your Water?”
Sand bedding for cows, is it a contaminant? Is it sustainable for our soils?
The question came up at an extension meeting on manure as to how adding 18,250 lbs. of sand per cow stall per year was impacting the soil. Words like a “it will take a long time” and “not sure” didn’t serve as satisfactory answers.
Upon talking to a soil scientist, I found in 25 to 50 years the soil texture could include 20% more sand, when using a vertical tillage system. By the look on his face I could tell that was not a good thing. This has led me to ask what impact will this have on our soil if it continues?
What did we find?
First, I confirmed the recommendation of 50 lbs. of sand per cow stall per day from the Dairyland Initiative. 50 lbs./ stall/ day x 365 days = 18,250 lbs./stall/year. About 2/3 of a dump truck per year per cow stall.
In surveying dairies in the Midwest, the average dairy has between 2 and 4 acres of land for which to spread manure, for each cow. At that rate, if equally spread, the dairy farmer will be adding between 4,550 lbs. and 9,125 lbs. per acre per year.
Also, in interviewing the farmers we found a majority of them utilize vertical tillage. In vertical tillage the top 3 inches of soil material is mixed. The sand will accumulate in the top 3” unless another system of tillage is utilized. At a rate of 4,550 – 9,125 lbs./year depending if you have 2, 3, 4 acres of area to spread your manure on with vertical tillage, it will take between 25 and 50 years to change the soil 20% more sand. Example-from a 40% loam to a 60% sandy loam.

W.H. Gardner published (1962) work he was doing on infiltration when there was a difference in soil texture. It showed when the pore space or texture differed, water infiltration slowed down.
If the pore space is smaller on top it will hold water tightly and will not allow it to infiltrate to the larger pore space until the pore spaces are filled up.
If the pore spaces are larger on top, the water more easily will move in the large spaces before moving downward once the upper pore spaces are filled.
We did an experiment adding 20% more sand to the top 3” of a glass cylinder (1). A second glass cylinder was filled with the same parent soil as the first (2).
Every soil will be unique, but in this trial, it took 5 minutes for the water to infiltrate to the bottom on the original parent soil (2). In the cylinder with sand added (1), it took 1 hour and 10 minutes to reach the bottom.
In several follow up trials with various soils the pattern was repeated. The sand added cylinder was significantly slower to let water in. Unlike the example with the cylinders we do not have a containment system on fields to hold the water in place until it can soak in. If our fields have no containment  system around them the water will become runoff as in this picture.
As we add sand to the top 3“of soil, organic matter is diluted. Organic matter plays a part in several areas.
 Sand has a cation exchange of 10 or less. Organic matter significantly increases the cation exchange of the soil. More sand and less organic matter decrease the ability of the soil to retain nutrients, such as phosphorus. If we cannot hold onto the nutrients, nutrification of our waters will occur and have negative consequences for the environment.
A second benefit of organic matter is at a 3” depth, for each 1% of organic matter we lose, we also lose 13,500 gallons of water holding capacity. This is important for filling out ears of corn and maturation of crops in a timely manner.
Summary of what we have learned.
-
- The addition of sand at these levels decreases the rate of infiltration of rainfall causing runoff. This runoff takes with it soil, nutrients and the water we could use for our crops.
- The cation exchange decreases as sand dilutes the top 3” of vertically tilled fields. With a lower cation exchange, there is a decrease in the soils ability to hold nutrients. Nutrients the crops could use. Nutrients that cost money to provide. Nutrients in too abundant supply, do harm in our water system.
- A decrease in organic matter also decreases the ability of soils to hold water. For each 1% loss of organic matter we lose 13,500 gallons of water holding capacity.
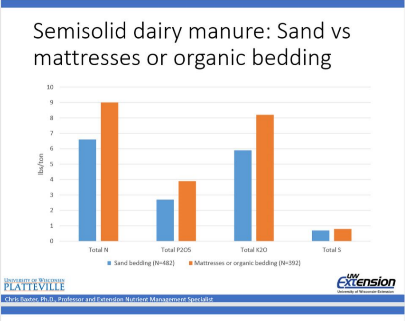
- The quality per volume of manure is also diminished. As sand is added to the manure the % of N, P, K, and sulfur is diminished.

A definition of a contaminant is “either biological, chemical, physical or radiological substance that becomes harmful for humans or living organisms”. If sand bedding is not a contaminant, it acts like one.
Future plans.
The challenge is to make this information aware to dairy farmers and people who assist them in understanding the options available and making decisions. Specifically, the challenge is to be able to bring the future to the present so the ramifications of the current practice of adding 18,250 lbs. of sand per cow stall per year to our soils is recognized as unsustainable and another system can be implemented to benefit the soils.
Author
Mark Misch of DCC Waterbeds, markm@advancedcomforttechnology.com
Acknowledgements.
I would like to thank Professors Bill Bland and Francisco Arriaga-University of Wisconsin Department of Soil Science for their assistance. One of several videos showing the dynamics of water movement through the soil can be accessed by the following link. https://www.youtube.com/watch?v=ego2FkuQwxc
The authors are solely responsible for the content of these proceedings. The technical information does not necessarily reflect the official position of the sponsoring agencies or institutions represented by planning committee members, and inclusion and distribution herein does not constitute an endorsement of views expressed by the same. Printed materials included herein are not refereed publications. Citations should appear as follows. EXAMPLE: Authors. 2019. Title of presentation. Waste to Worth. Minneapolis, MN. April 22-26, 2019. URL of this page. Accessed on: today’s date.
Development of a Cost-Effective Treatment Process for Removing Antimicrobials from Agricultural Wastewater
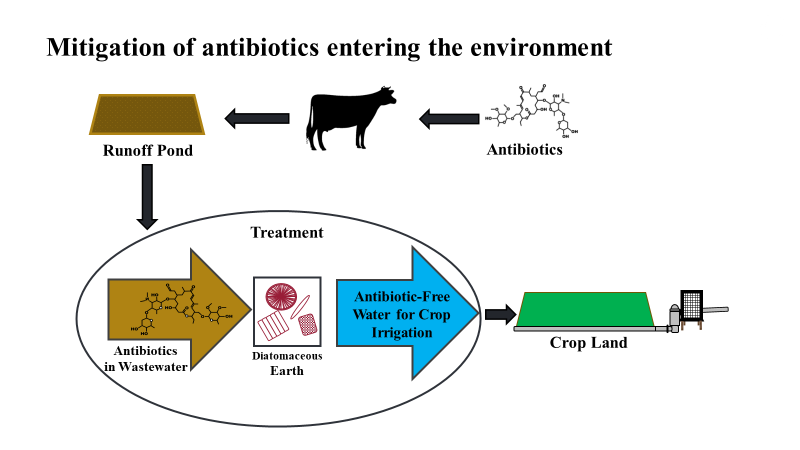
Much of the antimicrobials (AM) used therapeutically and prophylactically pass through the animal and enter the environment through irrigation with beef runoff wastewater (WW). There are concerns repeated low-level AM loading of soils through irrigation will alter the natural biota resulting in increased resistance; thereby, making AM critical for human and animal health less effective.
What Did We Do?
Several studies are summarized describing a cost-effective removal process of AM from beef wastewater before being applied as irrigation. Study 1 investigated three radiolabeled AM, ([14C]-erythromycin (ERY), [3H]-chlortetracycline (CTC), and [3H]-monensin (MON)) to quantify their partitioning in the aqueous and solids fractions of a beef wastewater (WW) containing suspended solids (SS). Following this, several flocculants were evaluated for removing SS with sorbed AM from WW. Study 2 evaluated the sorption properties of tylosin (TYL) with diatomaceous earth (DE) added to WW as a binding agent. Study 3 evaluated the proposed treatment process using pre-treatment of WW with flocculants then adding a binding agent to remove aqueous phase AM before being used an irrigation water.
What Have We Learned?
Study 1) After 48 hours, more ERY sorbed to the SS fraction than the aqueous. CTC partitioning occurred in three phases: a rapid sorption to the SS fraction between 0.5 and 8 hours with desorption into the aqueous fraction at 24 hours followed by short steady state at 48 hours with further desorption at 96 hours. The most lipophilic antibiotic, MON, quickly sorbed into the SS fraction and remained in equilibrium with the aqueous fraction after 48 hours. Calculated partitioning coefficients, Kd, for WW were very different from published soil-water values illustrating wastewater uniqueness. A follow up study determined alum and ferric chloride removed some ceftiofur (CEF) and chlorotetracycline (CTC); however, they were ineffective for removing TYL. Therefore, a process was needed to remove aqueous phase AM (figure 1). Study 2 evaluated three DE sources for binding aqueous TYL in WW. Raw (DER) contained organic carbon (OC) (3% g g-1), clays (20%) and amorphous silica (65%). Kieselguhr (DEK) had no OC (<1% g g-1), no clay (2%) and amorphous silica (96%). had nearly 3.5 times greater maximum sorption capacity when compared to DEK. Sorption of TYL to DEK and DER at different pH values showed cationic and hydrogen bonding interactions are important. Higher sorption of TYL to DER compared to DEK suggested clays-DE matrix was important for TYL sorption. Removing OC improved TYL sorption and decreased the separation time for DE/AM removal to complete treatment. Study 3 found CEF and CTC would bind to DE in controlled, neutral aqueous solution. When AMs were spiked into WW collected from a beef feedlot runoff pond, DE successfully removed TYL and CTC, but not CEF. Wastewater treated with excess alum to remove SS followed by DE treatment showed similar removal rates for TYL. Pretreatment of water with alum also resulted in CEF removal if larger amounts of DE are needed. The reason for change in CEF binding when pretreated WW with alum is still under investigation. Alum treatment appeared to remove most of the CTC spiked into WW and therefore no assessment of how CTC binding to DE after treatment.
Future Plans
Future work will include: evaluating the proposed treatment process on other AM and their metabolites. Development of modified DE matrices specific for non-polar AM and metabolites. These matrices could be combined to remove both polar and non-polar contaminants. Finally, the process needs to be evaluated for effectiveness of contaminant removal with municipal wastewater treatment systems.
Authors
Bryan L. Woodbury, Agricultural Engineer, USDA-U.S. Meat Animal Research Center, Clay Center, NE
Bobbi S. Stromer, Chemist Post Doc., USDA-U.S. Meat Animal Research Center, Clay Center, NE
Clinton. F. Williams, Lead Soil Scientist, USDA-US Arid-Land Agric. Research Center, Maricopa, AZ.
Katherine A. Woodward, Ph.D. Candidate, Tufts University, Civil & Environmental Eng., Medford, MA
Heldur Hakk, Research Chemist, USDA-Edward T. Schafer Agricultural Research Center, Fargo, ND.
Sara Lupton, Research Chemist, USDA-Edward T. Schafer Agricultural Research Center, Fargo, ND.
Additional Information
Stromer, B.S., B.L. Woodbury and C.F. Williams. 2018. Tylosin sorption to diatomaceous earth described by Langmuir isotherm and Freundlich isotherm models. Chemosphere. 193:912-920.
Acknowledgements
USDA is an equal opportunity provider and employer.
The authors are solely responsible for the content of these proceedings. The technical information does not necessarily reflect the official position of the sponsoring agencies or institutions represented by planning committee members, and inclusion and distribution herein does not constitute an endorsement of views expressed by the same. Printed materials included herein are not refereed publications. Citations should appear as follows. EXAMPLE: Authors. 2019. Title of presentation. Waste to Worth. Minneapolis, MN. April 22-26, 2019. URL of this page. Accessed on: today’s date.