
Animals excrete a lot of nitrogen as they grow with a large fraction escaping into the air as ammonia. What happens to that ammonia, and can we predict how that excess nitrogen might be beneficial to nearby crop production? This webinar will present pilot-scale research for manure and food waste treatment. This presentation was originally broadcast on May 16, 2025. Continue reading “A USDA multi-location project monitoring ammonia deposition near animal production sites”
Distillers grains impact on feedlot pen surface material
Purpose
Distillers grains (DGs) have been heavily researched as a diet additive for cattle since the early 2000s. Research has considered the nutritional value, optimization, and even how it impacts odors and greenhouse gases emitted from the surface of the pens that house cattle fed these diets. However, no work has been conducted to determine if there are changes in pen surface material properties after exposure to manure from diets containing DGs. Recent conversations with producers highlighted changes in pen surface characteristics such as significant loss in material and inability to maintain mounds in the pen. after DGs were fed for prolonged periods. Research has shown that manure from distillers diets contain excess proteins which we hypothesized could cause interruptions in soil particle interactions thus leading to a loss in integrity of the pen surface. The purpose of this work was to investigate if excess excreted protein in urine was the cause of changes in the properties of pen surface material.
What Did We Do?
This work was comprised of a large-scale study at a feedlot and a lab-scale study. In the feedlot study, cattle were fed either control (no DGs), wet DGs (40%) or dry DGs (40%) for 180 days. Once cattle were finished and removed from their pens, pen surface material (PSM) was collected from 4 general locations within each pen: behind the apron, on top of the mound, the side of the mound and the bottom of the pen. Samples from each pen with the same treatment were pooled into one single composite to represent each of the treatments. Samples were divided into two sets and analyzed by a commercial laboratory as either soil or manure. Soil analysis included pH, soluble salts, organic matter, nitrate nitrogen, potassium, sulfate, zinc, copper, calcium, sum of cations, % saturation of calcium and magnesium, and Mehlich-III phosphorus. Manure analysis included organic nitrogen, ammonium nitrogen, nitrate, phosphorus, potassium, sulfur, calcium, magnesium, sodium, zinc, iron, manganese, copper, boron, soluble salts pH, and moisture
For the lab-scale study, PSM was collected from a feedlot that does not feed DGs. Material was dried, ground, and sieved. Synthetic urine was added daily to bottles containing 300 g of PSM for 3 weeks to simulate prolonged addition of urine to feedlot pen surface. Samples were then shaken for 30 minutes and left at room temperature unsealed overnight. Synthetic urine contained either 0, 8, 16, or 32% additional protein. At the end of the study, samples were dried and sent to a commercial lab to be tested as soil in which the same properties listed above were again reported.
What Have We Learned?
In the feedlot study, differences (p < 0.05) in soluble salts were observed between all three treatments. Differences (p<0.05) were observed between the control and DGs diets for soluble salts, organic matter, potassium, sulfate, magnesium saturation, Mehlich P, pH, ammonium nitrogen, organic N, total N, phosphate, total phosphorus, and sulfur.
For the lab-scale study, properties in which differences (p<0.05) were measured between the control and treatments include: nitrate N, cation exchange capacity, magnesium, sodium, zinc, calcium saturation and magnesium saturation. Analysis which resulted in differences (p < 0.05) between control and all three added protein treatments include Mehlich P, potassium, calcium, and copper. No significant differences were determined between the control and the treatments for zeta potential and conductivity. Results of the feedlot study compared to the lab scale study suggest that changes in PSM are not solely caused by excess soluble protein excretion.
Future Plans
The lab scale study will be used to determine if fiber has any contribution to the observed changes in PSM properties. The results of this study will help us determine how best to manage feedlot pens when varying forms and concentrations of DGs are fed to the cattle. It may also provide insight into potential pen surface amendments that may be used to mitigate the negative effects of feeding DGs to cattle.
Authors
Corresponding author
Bobbi Stromer, Research Chemist, US Meat Animal Research Center, Bobbi.stromer@usda.gov
Additional authors
Mindy Spiehs, Research Nutritionist, US Meat Animal Research Center
Bryan Woodbury, Research Engineer, US Meat Animal Research Center
Additional Information
USDA is an equal opportunity provider and employer
Acknowledgements
The authors wish to thank Victor Gaunt for assistance with data collection.
The authors are solely responsible for the content of these proceedings. The technical information does not necessarily reflect the official position of the sponsoring agencies or institutions represented by planning committee members, and inclusion and distribution herein does not constitute an endorsement of views expressed by the same. Printed materials included herein are not refereed publications. Citations should appear as follows. EXAMPLE: Authors. 2025. Title of presentation. Waste to Worth. Boise, ID. April 7–11, 2025. URL of this page. Accessed on: today’s date.
Ammonia and greenhouse gas emissions when chicken litter is added to beef pen surface material
Purpose
One of the big challenges in animal agricultural waste management is reduction of greenhouse gas (GHG) emissions. Pen surface material (PSM) from beef feedlots has been characterized for its GHG emission profile and research has now shifted to focus on emission-reducing treatments for pen surfaces. Chicken litter (CL) has a nutrient and microbial profile unique from beef manure which was hypothesized to cause a change in GHG emissions. This study was conducted to determine if the addition of CL to beef PSM would reduce methane (CH4), carbon dioxide (CO2), ammonia (NH3), and nitrous oxide (NO2) emissions.
What Did We Do?
A lab scale study was conducted in which 24 stainless steel pans (12.75 x 20.75 x 2.5 in, L x W x H) were filled with PSM (3000 g, control) that had been collected from USMARC feedlot in August. Twelve pans of PSM had chicken litter (20% wt/wt) added to the top of the pan and gently raked into the PSM. All pans had 1000 g of water added. All samples were kept in an environmentally controlled chamber at 25 C for 18 days and watered after each measurement to keep sample moisture consistent. Sample pH and loss in water were recorded throughout the experiment. Flux measurements of CH4, CO2, N2O and NH3 were measured on days 0, 1, 3, 6, 8, 10, 13, 15, and 18 using Thermo Scientific gas analyzers. Data was analyzed for statistical differences in emissions as a function of time (days), treatment (control vs chicken litter), and time*treatment. At the conclusion of emission measurements, samples were pooled and sent to a commercial lab for nutrient analysis.
What Have We Learned?
All measured gases showed significant changes over the time of the experiment (p < 0.05). Significant differences between treatments (p < 0.05) were recorded for N2O with a higher emission recorded for PSM+CL. Significant treatment* day interactions were observed for CH4, NH3, and N2O (p < 0.05). Methane and NH3 emissions peaked on day 1 and steadily decreased over the 18 days; N2O emissions steadily rose from day 0 to day 8 and then steadily decreased through day 18. Nutrient analysis determined PSM with chicken litter contained significantly higher levels of organic N, ammonium N, and total nitrogen. There was no significant difference of N2O in control vs treated samples. Chicken litter treated samples showed higher levels of P2O5, K2O, sulfur, calcium, magnesium, sodium, zinc, copper, boron, soluble salts, and organic matter. From this work, we conclude that addition of chicken litter to PSM did not favorably alter emissions of greenhouse gasses. Mixing the manures may be beneficial for land application to cropland or for composting.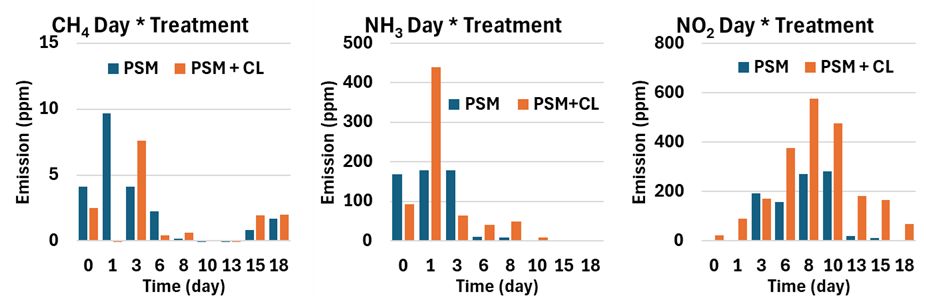
Future Plans
Future research will evaluate different sources of composted CL, the emission profile of CL, and consideration of how mixtures of PSM and CL impact nutrient retention and composting.
Authors
Presenting & corresponding author
Bobbi Stromer, Research Chemist, US Meat Animal Research Center, Bobbi.stromer@usda.gov
Additional authors
Mindy Spiehs, Research Nutritionist, US Meat Animal Research Center
Bryan Woodbury, Research Engineer, US Meat Animal Research Center
Additional Information
USDA is an equal opportunity provider and employer
Acknowledgements
The authors wish to thank Victor Gaunt for assistance with data collection
The authors are solely responsible for the content of these proceedings. The technical information does not necessarily reflect the official position of the sponsoring agencies or institutions represented by planning committee members, and inclusion and distribution herein does not constitute an endorsement of views expressed by the same. Printed materials included herein are not refereed publications. Citations should appear as follows. EXAMPLE: Authors. 2025. Title of presentation. Waste to Worth. Boise, ID. April 7–11, 2025. URL of this page. Accessed on: today’s date.
Particulate Matter Concentrations in a Swine Farrowing Room Microenvironment
Purpose
Microenvironment in swine buildings is the specific and localized environmental conditions that directly affect the animals. Air quality is one of the critical conditions for the safety, health, productivity, and behavior of the animals and the health of workers. However, limited research has been conducted on air quality within the microenvironment of swine barns. The purpose of this study is to improve the understanding and management of swine production and welfare by measuring and characterizing the microenvironmental particulate matter (PM) concentrations in a swine facility.
What Did We Do?
This study covered a batch of swine farrowing from September 20 to October 15, 2024, in a 12-pen room of an experimental building at Purdue University. Measurement started on September 21, the second day after the sows were moved into the room. Fine and inhalable particulate matter (PM2.5 and PM10, respectively) concentrations and air temperatures were monitored using 12 portable PM sensors and 12 T-type thermocouples, respectively, at approximately 50 cm (1.6 feet) above the slatted floor on the sow head/feeder end in each pen. Pig activity levels were monitored using a passive infrared detector positioned on the ceiling above each pen. Fan airflow rates were monitored using anemometers to determine room ventilation rates. All measurement data were recorded every minute. The PM concentration data from different sensors were normalized to remove sensitivity variations among the sensors. Data were analyzed for the dynamic and spatial variations of PM concentrations in the room and among different pens.
What Have We Learned?
Results showed that overall PM2.5 and PM10 concentrations changed dynamically. Sows did not generate a significant amount of PM before farrowing. The PM concentrations increased dramatically from pre-farrowing to farrowing and continued to increase to the maximum approximately 15 days after farrowing. After that the PM concentrations decreased daily until weaning. The PM concentrations in the pens were similar to empty pens right after the sows and piglets were removed at the end of the study (Figure 1). Diurnal variations in PM concentrations were evident and were affected by pig activities and room ventilation rates. Some management operations in the room caused spikes of PM concentrations, which did not last for long. Notable differences in PM2.5 and PM10 concentrations among the pens were observed. Concentrations of PM2.5 and PM10 within the same pen displayed similar variation patterns (Figure 1 top and bottom).

Future Plans
More experiments will be conducted to study PM emissions from swine farrowing facilities. Measurement methodologies will be improved to increase data accuracies and completeness. Additionally, the results of swine building microenvironment study will be disseminated via Extension to producers and other stakeholders.
Authors
Presenting & corresponding author
Ji-Qin Ni, Professor, Purdue University, jiqin@purdue.edu
Additional authors
Ritika Sachdeva, Graduate Student; Alexandra Elizabeth Fisk, Graduate Student; Katherine E. Klassen, Graduate Student; Subin Han, Graduate Student; Jae Hong Park, Associate Professor; Brian T. Richert, Associate Professor, Purdue University
Acknowledgements
This study was supported by the Foundation for Food and Agriculture Research and the National Pork Board under Grant ID: 22-000290
The authors are solely responsible for the content of these proceedings. The technical information does not necessarily reflect the official position of the sponsoring agencies or institutions represented by planning committee members, and inclusion and distribution herein does not constitute an endorsement of views expressed by the same. Printed materials included herein are not refereed publications. Citations should appear as follows. EXAMPLE: Authors. 2025. Title of presentation. Waste to Worth. Boise, ID. April 7-11, 2025. URL of this page. Accessed on: today’s date.
Optimizing Manure Application Timing for Methane Reduction and Economic Gains through Carbon Credits
Purpose
Methane emissions from manure storages significantly contribute to the livestock industry’s carbon footprint. While various manure management strategies are used to reduce greenhouse gas (GHG) emissions on farms, such as anaerobic digestion and composting, many of these strategies are cost-prohibitive for small-to-medium-sized farms. Strategic manure application timing to limit GHG emissions is a practical, scalable option to reduce methane production in manure storages.
Carbon credits are financial incentives for farmers who adopt practices that reduce greenhouse gas emissions, such as cover crops or methane emissions abatement. These credits can then be sold to companies seeking to offset their emissions. This study evaluates the impact of manure application timing on methane emissions from storages and explores how carbon credits could act as an incentive for farms to employ climate-smart manure management practices. By comparing different manure application strategies (fall, spring, in-season sidedress, and split applications), we assess the methane reductions and improved economics of optimized timing.
What Did We Do?
Methane emissions were estimated using data from a lab-based study conducted by Andersen et al. (2015), who measured methane emissions from deep-pit swine manure at various temperatures. From this data, we created a model incorporating manure production rates and ambient temperature dynamics to predict daily methane emissions from a 4800-head slurry storage and 4800-head deep-pit swine production facility.
Seven application scenarios were compared: fall (November 1), spring (April 15), sidedress (June 1), fall-spring, fall-sidedress, spring-sidedress, and fall-spring-sidedress split applications. Total methane emissions were calculated for each scenario, allowing us to determine the GHG emissions abated by shifting from a fall application to an alternate strategy. An economic assessment was conducted using a $30/metric ton carbon dioxide equivalent (MT CO2e) carbon credit valuation to determine the financial implications of these methane mitigation strategies.
What Have We Learned?
For our swine slurry store model, methane emissions were highest in the single fall application scenario due to the full storage attained during peak summer temperatures, with annual emissions totaling nearly 0.5 MT CO2e/pig-space (Figure 1). Shifting application to spring or sidedress reduced emissions by approximately 50%. Split applications showed a further reduction in emissions by maintaining lower storage volumes throughout the year.

From an economic perspective, carbon credits significantly enhanced the financial viability of the new application strategies. Carbon credits from abated emissions are projected to bring a maximum of $10/pig-space, or about $74/acre, to the farm annually in the F-S-SD scenario (Table 1). The improved manure application timing can also benefit crop yield, making a spring or sidedress manure application even more economically favorable.
Table 1: Projected carbon credit income for a 4800-head wean to finish swine farm with a slurry storage for fall, spring, sidedress, fall-spring split (F-S), fall-sidedress split (F-SD), spring-sidedress split (S-SD), and fall-spring-sidedress split (F-S-SD) applications.
| Fall | Spring | Sidedress | F-S | F-SD | S-SD | F-S-SD | |
| Carbon Credit Income
($/acre) |
$ – | $ 33.63 | $ 33.71 | $ 41.95 | $ 45.82 | $ 45.69 | $ 52.06 |
| Carbon Credit Income
($/pig-space) |
$ – | $ 6.50 | $ 6.51 | $ 8.10 | $ 8.85 | $ 8.83 | $ 10.06 |
Future Plans
Further research should be conducted to refine the temperature aspect of the model. In the slurry store model, we assume that the manure temperature equals the 10-day average temperature. A study to verify the true manure temperature throughout the year would improve the confidence level of the current model. For deep pit barns, we use measured temperature data from 58 barns over 13 months, but manure temperatures were collected from the manure pump out access port and may not represent average manure temperatures in the barn. Future models to assess differences between deep pit and slurry store emissions will highlight the optimal manure management strategies for limiting GHG emissions.
Using specialized high-clearance irrigation equipment, like the 360 RAIN from 360 Yield Center, could enhance the feasibility of more frequent manure applications, reducing methane emissions while maintaining crop nitrogen availability. Additionally, developing standardized carbon credit protocols for manure management could create opportunities for more producers to monetize methane reduction efforts, further incentivizing climate-smart manure application strategies.
Authors
Presenting author
Jacob R. Willsea, Graduate Research Assistant, Iowa State University Department of Agricultural and Biosystems Engineering
Corresponding author
Daniel S. Andersen, Associate Professor, Iowa State University Department of Agricultural and Biosystems Engineering, dsa@isatate.edu
Additional Information
Andersen, D.S., Van Weelden, M.B., Trabue, S.L., & Pepple, L. M. (2015). Lab-assay for estimating methane emissions from deep-pit swine manure storages. Journal of Environmental Management, 159, 18-26. https://doi.org/10.1016/j.jenvman.2015.05.003
Talkin’ Crap Podcast Episode:
Andersen Lab Poster Repository:
https://iastate.box.com/s/3kkzdzcjlk9qcfrgbv6mj9x7vdk1v0fp
Acknowledgements
USDA-NRCS
Brent Renner
360 Yield Center
The authors are solely responsible for the content of these proceedings. The technical information does not necessarily reflect the official position of the sponsoring agencies or institutions represented by planning committee members, and inclusion and distribution herein does not constitute an endorsement of views expressed by the same. Printed materials included herein are not refereed publications. Citations should appear as follows. EXAMPLE: Authors. 2025. Title of presentation. Waste to Worth. Boise, ID. April 7-11, 2025. URL of this page. Accessed on: today’s date.
Animal Feeding Operations Air Emission Estimation Methods
To be sustainable, producers need to conserve energy while still maintaining or improving their facilities and the lives of the animals they house. This presentation was originally broadcast on January 19, 2024. Continue reading “Animal Feeding Operations Air Emission Estimation Methods”
Use of Vermifiltration as a Tool for Manure Management
This webinar discusses the science and economics behind the use of worms in the processes of composting (i.e., vermicomposting) and treatment of wastewater and manure liquid waste stream (vermifiltration). This presentation was originally broadcast on May 20, 2022. Continue reading “Use of Vermifiltration as a Tool for Manure Management”
Manure emissions during agitation and processing
Purpose
Recent deaths associated with hydrogen sulfide exposure from manure systems have highlighted the need for increased awareness to reduce health risks. While information on some aspects of hydrogen sulfide release from manure are available, there is limited information on the characteristics when agitating manure storages and in manure processing buildings that result in concentrations that are dangerous to human health. This project aimed to gather data on emissions from manure storages and processing to assess risks and develop mitigation strategies for these risks.
What Did We Do?
Our research team acquired over 20 days of field data (at multiple livestock farms) to assess the air concentrations from manure storages with and without agitation, for hydrogen sulfide, methane, ammonia, and particulate matter. The emissions were measured over the course of eight hours using numerous sets of sensors around the manure storage during agitation for each sampling event. Each sampling event had one backpack that was worn by a researcher with a set of sensors to represent the concentrations relevant to someone working in the area. Five additional sensor sets were placed around the manure storage. Some sensor sets remained in the same position throughout sampling (e.g., at the location of the agitation equipment controls) while others were moved around the storage. Researchers also measured the concentrations of these gases inside a manure processing room to assess the concentration changes with different air exchange rates. During each event manure samples were collected as well as weather data to relate to the manure emissions data.
What Have We Learned?
This research assessed the environmental and design conditions of manure systems that may lead to increased concentrations of gases that have human health implications. The results indicate critical operating parameters on how to manage manure systems to limit risk from gases produced from manure processing and storage areas. More details on the study results will be available soon and will be presented at the conference.
Future Plans
This information is also being integrated into an existing fact sheet, https://learningstore.extension.wisc.edu/collections/manure/products/reducing-risks-from-manure-storage-agitation-gases-p1865, to provide an updated resource which integrates this new data. This information will be shared in a variety of settings to increase awareness and guide practices to reduce health risks to those working with livestock manure.
Authors
Rebecca A. Larson, Associate Professor & Extension Specialist, Biological Systems Engineering, University of Wisconsin-Madison
Corresponding author email address
rebecca.larson@wisc.edu
Additional author
Anurag Mandalika, Assistant Professor, Audobon Sugar Institute, LSU AgCenter
Additional Information
Reducing Risks from Manure Storage Agitation Gases
Acknowledgements
This work is supported by Foundational Program CARE 2019-68008-29829 from the USDA National Institute of Food and Agriculture.
The authors are solely responsible for the content of these proceedings. The technical information does not necessarily reflect the official position of the sponsoring agencies or institutions represented by planning committee members, and inclusion and distribution herein does not constitute an endorsement of views expressed by the same. Printed materials included herein are not refereed publications. Citations should appear as follows. EXAMPLE: Authors. 2022. Title of presentation. Waste to Worth. Oregon, OH. April 18-22, 2022. URL of this page. Accessed on: today’s date.
How are Filth Flies Involved in Wasting Nitrogen?
Purpose
Filth flies are species from the Diptera order associated with animal feces and decomposing waste. Beef cattle raised on open pastures are especially susceptible to two species of filth flies: Face flies (Musca autumnalis De Geer) and Horn flies (Haematobia irritans (L.)) because these flies develop exclusively in fresh cattle manure. Filth fly impact on cattle health is related not only to the loss of body weight but also to the transmission of diseases like pink eye and mastitis (Basiel, 2020; Campbell, 1976; Hall, 1984; Nickerson et al., 1995).
Nitrogen losses from cattle’s manure has been reported for domestic flies (Musca domestica) and bottle flies (Neomyia cornicina) (Iwasa et al., 2015; Macqueen & Beirne, 1975). Despite the regular presence of face fly and horn fly in pastures, their effect on the nutrient cycles is little known. The purpose of this study is to understand the relationship between filth fly’s presence in cattle manure with the nitrogen losses caused by an increase in ammonia and nitrous oxide emissions.
What Did We Do?
The study was conducted in four pastures in the Georgia Piedmont: two near Watkinsville and two near Eatonton during June, July, and August of 2021. Ammonia volatilization and nitrous oxide emissions were measured on days 1, 4, 8, and 15 following dung deposition. Manure samples were collected on days 1 and 15. A static chamber was sealed for 24 h on each sampling date to capture manure’s ammonia and nitrous oxide emissions. In each chamber, a glass jar with boric acid was used to trap ammonia, and gas samples were collected. The gas samples were analyzed for nitrous oxide with a Varian Star 3600 CX Gas Chromatograph using an electron capture detector.
The number of filth flies was determined using a net trap covered by a black cloth that was set after 1 min of manure deposition, allowing the flies to oviposit for 10 min. On the days in which ammonia was not measured, a net trap was set to avoid additional oviposits, and record the emergence of filth flies. On the 15th day, we collected the filth flies that emerged from the eggs deposited in the manure during the first day.
What Have We Learned?
We found that cattle’s manure nitrogen loss as nitrous oxide (N2O) and ammonia (NH3) emissions have a direct relationship with the number of horn flies and face flies in the dung, Figure 1. Eighty percent of the flies trapped were horn flies. Dung with less than 5 flies can emit as little as 0.11 mg of N/kg of manure per day, while cattle manure with more than 30 flies can increase this emission by more than 10 times.
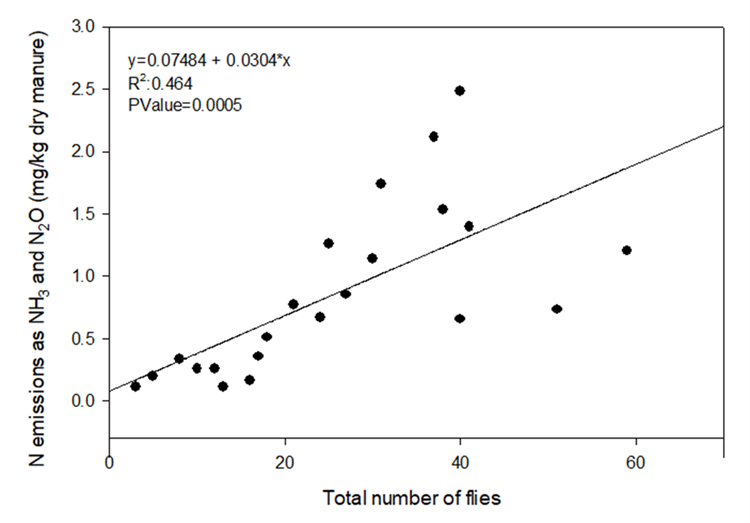
Every extra filth fly in manure can increase N emissions by 0.03 mg per kg of manure per day. According to NRCS, 59.1 lbs. of fresh manure is produced by a cow (approx. 1 000 pounds animal) every day (NRCS, 1995). Considering an average of 85 % relative humidity, 4.03 kg of dry manure can be produced per cow day. The actual economic threshold for horn fly is 200 flies per animal (Hogsette et al., 1991; Schreiber et al., 1987), considering a 1 to 1 sex ratio during emergence (Macqueen & Doube, 1988) we are assuming 100 female flies. Since the capacity of horn flies is 8-13 eggs per day (Lysyk, 1999), 100 female horn flies can generate approximately 1,000 new flies every day. Calculating the nitrogen emissions (4.03 kg of dry manure X 0.03 mg N kg manure x 1,000 flies per day) results in 121 mg of N loss per cow per day when assuming the number of flies is just at the economic threshold. In January of 2022, USDA released the Southern Region Cattle Inventory with a total of 91.9 million head, from which 30.1 million were beef cows (USDA, 2022). Considering the earlier numbers, the horn fly presence in the beef cattle of the Southern Region could be emitting 3,639 kg of Nitrogen to the atmosphere every day.
Future Plans
We will continue the study on ammonia and nitrous oxide emissions under the same conditions during another year to confirm the trends and accuracy of the results. Also, we will implement a study to analyze the effect of the introduction of a parasitic wasp Spalangia endius as a biological control on horn fly and face fly populations and therefore on the manure’s nitrogen losses.
Authors
Presenting author
Natalia B. Espinoza, Research Assistant, Department of Crop and Soil Science, University of Georgia
Corresponding author
Dr. Dorcas H. Franklin, Professor, Department of Crop and Soil Sciences, University of Georgia
Corresponding author email address
dfrankln@uga.edu or dory.franklin@uga.edu
Additional authors
Anish Subedi, Research Assistant, Department of Crop and Soil Science, University of Georgia
Dr. Miguel Cabrera, Professor, Department of Crop and Soil Sciences, University of Georgia
Dr. Nancy Hinkle, Professor, Department of Entomology, University of Georgia
Dr. S. Lawton Stewart, Professor, Department of Animal and Dairy Science, University of Georgia
Additional Information
Basiel, B. (2020). Genomic Evaluation of Horn Fly Resistance and Phenotypes of Cholesterol Deficiency Carriers in Holstein Cattle [PennState University]. Electronic Theses and Dissertations for Graduate Students.
Campbell, J. B. (1976). Effect of Horn Fly Control on Cows as Expressed by Increased Weaning Weights of Calves. Journal of Economic Entomology, 69(6), 711-712. https://doi.org/DOI 10.1093/jee/69.6.711
Hall, R. D. (1984). Relationship of the Face Fly (Diptera, Muscidae) to Pinkeye in Cattle – a Review and Synthesis of the Relevant Literature. Journal of Medical Entomology, 21(4), 361-365. https://doi.org/DOI 10.1093/jmedent/21.4.361
Hogsette, J. A., Prichard, D. L., & Ruff, J. P. (1991). Economic-Effects of Horn Fly (Diptera, Muscidae) Populations on Beef-Cattle Exposed to 3 Pesticide Treatment Regimes. Journal of Economic Entomology, 84(4), 1270-1274. https://doi.org/DOI 10.1093/jee/84.4.1270
Iwasa, M., Moki, Y., & Takahashi, J. (2015). Effects of the Activity of Coprophagous Insects on Greenhouse Gas Emissions from Cattle Dung Pats and Changes in Amounts of Nitrogen, Carbon, and Energy. Environmental Entomology, 44(1), 106-113. https://doi.org/10.1093/ee/nvu023
Lysyk, T. J. (1999). Effect of temperature on time to eclosion and spring emergence of postdiapausing horn flies (Diptera : Muscidae). Environmental Entomology, 28(3), 387-397. https://doi.org/DOI 10.1093/ee/28.3.387
Macqueen, A., & Beirne, B. P. (1975). Influence of Some Dipterous Larvae on Nitrogen Loss from Cattle Dung. Environmental Entomology, 4(6), 868-870. https://doi.org/DOI 10.1093/ee/4.6.868
Macqueen, A., & Doube, B. M. (1988). Emergence, Host-Finding and Longevity of Adult Haematobia-Irritans-Exigua Demeijere (Diptera, Muscidae). Journal of the Australian Entomological Society, 27, 167-174. <Go to ISI>://WOS:A1988P906100002
Nickerson, S. C., Owens, W. E., & Boddie, R. L. (1995). Symposium – Mastitis in Dairy Heifers – Mastitis in Dairy Heifers – Initial Studies on Prevalence and Control. Journal of Dairy Science, 78(7), 1607-1618. https://doi.org/DOI 10.3168/jds.S0022-0302(95)76785-6
NRCS, N. R. C. S. (1995). Animal Manure Management. RCA Publication Archive(7). https://www.nrcs.usda.gov/wps/portal/nrcs/detail/null/?cid=nrcs143_014211
Schreiber, E. T., Campbell, J. B., Kunz, S. E., Clanton, D. C., & Hudson, D. B. (1987). Effects of Horn Fly (Diptera, Muscidae) Control on Cows and Gastrointestinal Worm (Nematode, Trichostrongylidae) Treatment for Calves on Cow and Calf Weight Gains. Journal of Economic Entomology, 80(2), 451-454. https://doi.org/DOI 10.1093/jee/80.2.451
USDA. (2022). Southern Region News Release Cattle Inventory. https://www.nass.usda.gov/Statistics_by_State/Regional_Office/Southern/includes/Publications/Livestock_Releases/Cattle_Inventory/Cattle2022.pdf
A mass balance approach to estimate methane and ammonia emissions from non-ruminant livestock barns
Purpose
Producers are under pressure to demonstrate and document environmental sustainability. Responding to these pressures requires measurements to demonstrate greenhouse gas (GHG) emissions and/or changes over time. Stored manure emissions are a critical piece of livestock agriculture’s contribution to GHG production. Manure sample‐based estimates show promise for estimating methane (CH4) production rates from stored manure but deserve more extensive testing and comparison to farm‐level measurements. Understanding the causes for variability offer opportunity for more realistic and farm‐specific GHG emissions. Improved GHG measurements or estimates will more accurately predict current GHG emission levels, identify mitigation techniques, and focus resources where they are needed. This project offers an innovative approach to improvement of air quality and strengthens engagement by the livestock sector in sustainability discussions.
Although CH4 and ammonia (NH3) emissions from non-ruminant livestock production systems are primarily released from stored manure, current emission inventories (models) do not account for all production and management systems. The purpose of this project was to track flows of nitrogen, volatile solids (VS), and ash into and out of several commercial livestock barns to estimate CH4 and NH3 emissions. Using a mass balance approach, volatile components like nitrogen and volatile solids are supported through simultaneous balances with ash (fixed solids). These mass-balance based estimates can be compared to national inventory emission estimates and serve as sustainability metrics, regulatory reporting, and management decisions.
What Did We Do?
In the initial step of this project, experimental data for VS, the precursor to methane, are compared to fixed estimates in methane emission estimation tools, like the EPA State Greenhouse Gas Inventory Tool (US EPA, 2017).
The litter from a commercial turkey finishing barn housing between 13,000 and 18,000 birds was sampled weekly for one month, with one additional sampling day one month later. VS concentrations were analyzed for each sample and used to estimate total VS production per year assuming six 15,000 bird flocks (Soriano et al., 2022). A range of VS percentage values for deep-pit cattle facilities were taken from Cortus et al. (2021) and converted to total VS production per year. A range of VS concentrations for deep-pit swine manure storage were taken from Andersen et al. (2015) and used to find total VS production per year of that system as well. Next, total VS productions per year were estimated for the same three systems using the State Greenhouse Gas Inventory Tool.
What Have We Learned?
Table 1 summarizes all calculated total VS values and CH4 estimates per year for both the estimation tool and the experimental data. For each of the three systems, the state inventory estimated total VS value falls within the ranges calculated with experimental data, however, the estimates cannot account for the variabilities found within each system. As seen in the experimental total VS values, there can be a large range of VS production due to differences within specific operations of each system. Total VS relates directly to CH4 emissions, so accurate estimates are important for determining greenhouse gas emission potential of a specific operation.
| Total VS production (kg/yr) | Emissions* | ||
|---|---|---|---|
| State Inventory | Experimental Values | m3CH4 | |
| Feedlot Steer (500 head) | 334,990 | 260,758 – 1,002,675 | 1,262** |
| Grower-Finisher Swine (1,200 head | 160,408 | 107,514 – 216,669 | 19,050 |
| Turkey (15,000 head) | 314,594 | 206,838 – 359,245 | 1,699 |
| *Emissions estimates found through the State Greenhouse Gas Inventory Tool **Feedlot steer emission estimate assumes an open feedlot manure management system |
|||
Future Plans
Next steps for this study will include manure sampling at additional commercial turkey barns, deep-pit grower-finisher swine barns, and dairy cattle systems. Similar mass balances will be performed to determine total VS and nitrogen content to calculate CH4 and NH3 emissions from each system. These calculated values will again be compared to outputs of emission estimating tools.
Authors
Anna Warmka, Undergraduate Student, University of Minnesota – Twin Cities, Department of Bioproducts and Biosystems Engineering
Corresponding author email address
warmk011@umn.edu
Additional authors
Erin Cortus, Associate Professor, University of Minnesota – Twin Cities, Department of Bioproducts and Biosystems Engineering
Noelle Soriano, MS Student, University of Minnesota – Twin Cities, Department of Bioproducts and Biosystems Engineering
Melissa Wilson, Assistant Professor, University of Minnesota – Twin Cities, Department of Soil, Water, and Climate
Bo Hu, Professor, University of Minnesota – Twin Cities, Department of Bioproducts and Biosystems Engineering
Additional Information
Andersen, D.S., M.B. Van Weelden, S.L. Trabue, and L.M. Pepple. “Lab-Assay for Estimating Methane Emissions from Deep-Pit Swine Manure Storages.” Journal of Environmental Management 159 (August 2015): 18–26. https://doi.org/10.1016/j.jenvman.2015.05.003.
Cortus, E.L., B.P. Hetchler, M.J. Spiehs, and W.C. Rusche. “Environmental Conditions and Gas Concentrations in Deep-Pit Finishing Cattle Facilities: A Descriptive Study.” Transactions of the ASABE 64, no. 1 (2021): 31–48. https://doi.org/10.13031/trans.14040.
US EPA, OAR. “State Inventory and Projection Tool.” Data and Tools, June 30, 2017. https://www.epa.gov/statelocalenergy/state-inventory-and-projection-tool.
Soriano, N.C., A.M. Warmka, E.L. Cortus, M.L. Wilson, B. Hu, K.A. Janni. “A mass balance approach to estimate ammonia and methane emissions from a commercial turkey barn.” unpublished (2022).
Acknowledgements
This research was supported by the Rapid Agricultural Response Fund. We also express appreciation to farmer cooperators who allowed us to collect data on their farms and shared their observations with us.