
Environmental Footprints of Beef Produced At the U.S. Meat Animal Research Center

Waste to Worth: Spreading science and solutions logoWaste to Worth home | More proceedings….

Why Study the Environmental Footprint of Beef?

As a major contributor in food production, beef production provides a major service to our economy that must be maintained. Production of cattle and the associated feed crops required also impact our environment, and this impact is not well understood. Several studies have determined the carbon footprint of beef, but there are other environmental impacts that must be considered such as fossil energy use, water use, and reactive nitrogen loss to the environment. Because of the large amount of data available to support model evaluation, production systems of the U.S. Meat Animal Research Center were simulated with the Integrated Farm System Model for the purpose of evaluating the environmental impact of the beef cattle produced.

What Did We Do?

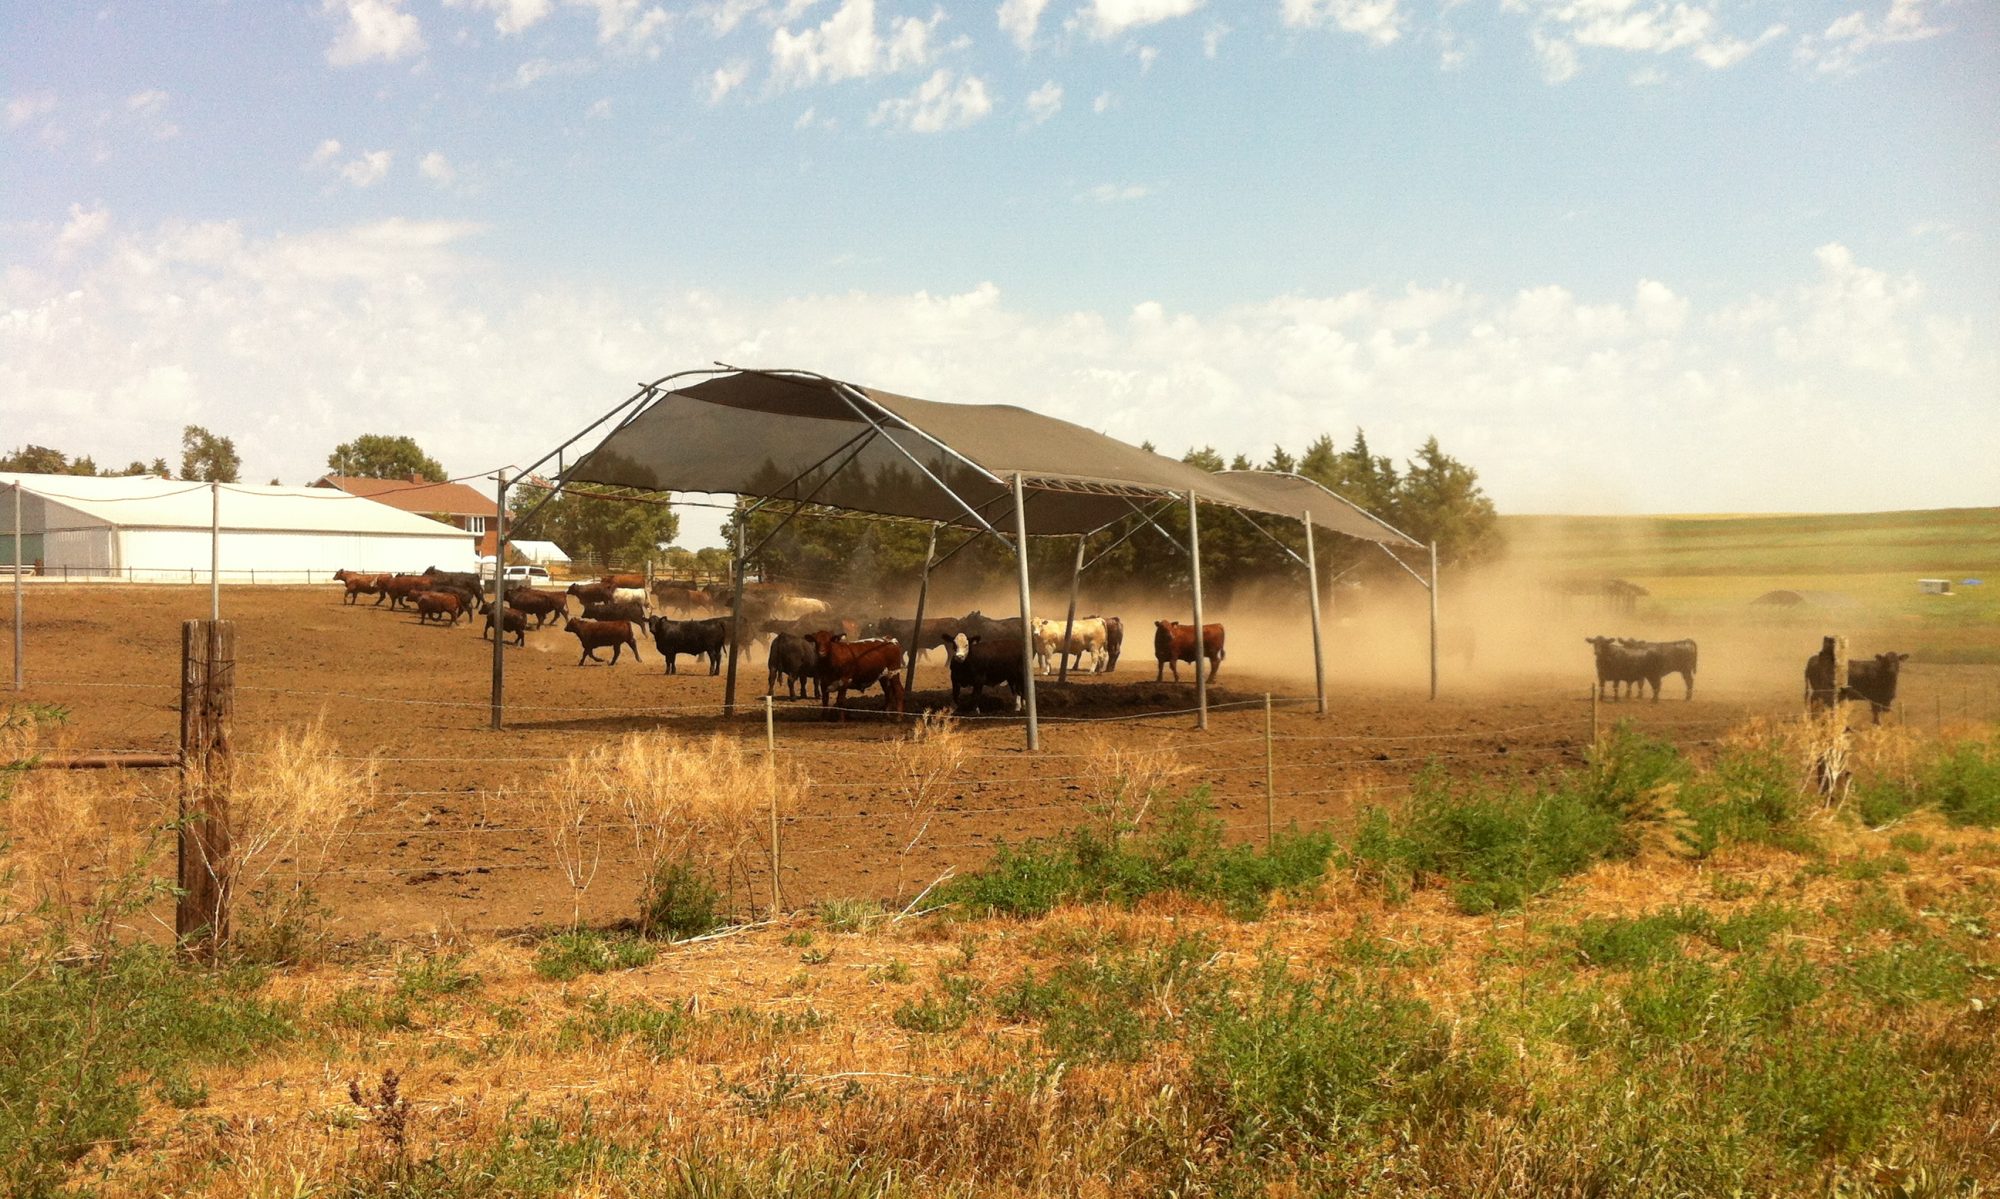
The environmental footprints of beef produced at the U.S. Meat Animal Research Center (MARC) in Clay Center, Nebraska were determined with the objective of quantifying improvements achieved over the past 40 years. Relevant information for MARC operations was used to establish parameters representing their production system with the Integrated Farm System Model. The MARC farm, cow calf and feedlot operations were each simulated over recent historical weather to evaluate performance, environmental impact and economics. The current farm operation included 2,078 acres of alfalfa and 2,865 acres of corn to produce feed predominately for the beef herd of 5,500 cows, 1200 replacement heifers and 3,724 cattle finished per year. Spring and fall cow calf herds were fed on 24,000 acres of pastureland supplemented through the winter with hay and silage produced by the farm operation. Feedlot cattle were backgrounded 3 mo on hay and silage and finished over 7 mo on a diet high in corn grain and wet distiller’s grain.

What Have We Learned?

Model simulated predictions for weather year 2011 were within 1% of actual records for feed production and use, energy use, and production costs. A 25-year simulation of their current production system gave a carbon footprint of 10.9 lb of CO2 equivalent units per lb body weight (BW) sold, and the energy required to produce that beef was 11,400 Btu/lb BW. The total water required was 2,560 gallon/lb BW sold, and the water footprint excluding that obtained through precipitation was 335 gallon/lb BW. Reactive N loss was 0.09 lb/lb BW, and the simulated total cost of producing their beef was $0.96/lb BW sold. Simulation of the production practices of 2005 indicate that the use of distiller’s grain in animal diets has had a small impact on environmental footprints except that reactive N loss has increased 10%. Compared to 1970, the carbon footprint of beef produced has decreased 6% with no change in the energy footprint, a 3% reduction in the reactive N footprint, and a 6% reduction in the real cost of production. The water footprint, excluding precipitation, has increased 42% due to greater use of irrigated corn production.

Future Plans

Now that the modeling approach has been shown to appropriately represent beef production systems, further simulation analyses are planned to evaluate beef production systems on a regional and national scale.

Authors

C. Alan Rotz, Agricultural Engineer, Pasture Systems and Watershed Management Research Unit, USDA/ARS al.rotz@ars.usda.gov

B.J. Isenberg, Research Assistant, The Pennsylvania State University

K.R. Stackhouse-Lawson, Director of Sustainability Research, National Cattlemen’s Beef Association

E.J. Pollak, Director, Roman L. Hruska U.S. Meat Animal Research Center, USDA / ARS

Additional Information

C. Alan Rotz, al.rotz@ars.usda.gov

Acknowledgements

Funded in part by The Beef Checkoff and the USDA’s Agricultural Research Service


The authors are solely responsible for the content of these proceedings. The technical information does not necessarily reflect the official position of the sponsoring agencies or institutions represented by planning committee members, and inclusion and distribution herein does not constitute an endorsement of views expressed by the same. Printed materials included herein are not refereed publications. Citations should appear as follows. EXAMPLE: Authors. 2013. Title of presentation. Waste to Worth: Spreading Science and Solutions. Denver, CO. April 1-5, 2013. URL of this page. Accessed on: today’s date.

What We Feed Dairy Cows Impacts Manure Chemistry and the Environment

Waste to Worth: Spreading science and solutions logoWaste to Worth home | More proceedings….

Why Be Concerned with Feed Rations and Their Environmental Implications?

During the last part of the 20th century, animal manure management became an environmental concern. In response to these concerns, legislation was enacted to control manure management and the emission of undesirable gasses (e.g., methane, ammonia, nitrous oxide) from animal production systems. The purpose of this paper is to illustrate how mineral phosphorus (P) supplements, forage types and amounts, and the crude protein (CP) fed to lactating cows impact manure chemistry and the fate of manure nutrients in the environment.

What Did We Do?

Source-sink relationships have been used to illustrate relationships between feed nutrient sources (e.g., forms and concentrations of P and CP in lactating cows rations) and nutrient sinks (milk and manure), and relationships between manure nutrient sources (e.g., soluble P, urea N) and sinks [soil test P, runoff P, atmospheric ammonia, soil inorganic nitrogen (N), crop N] and the impact of these relationships on the environment.

What Have We Learned?

As mineral P concentrations in dairy rations increase, the excretion of total P and soluble P in manure also increases. The amount of cropland needed to recycle manure P and runoff of soluble P from cropland after manure application can be related back to the P excreted in manure, which in turn can be linked to the amount of mineral P in cow rations.  Likewise, the type and amount of CP and forage fed to dairy cows impact manure chemistry and manure N losses as ammonia, N cycling in soil, including plant N uptake. Ammonia emissions from dairy barns and soil after manure application can be related back to the urea N excreted by dairy cows in urine, which is linked to the types and concentrations of CP and forages in cow rations, and the concentrations of urea in milk (milk urea N, or MUN).  Our results demonstrate that profitable rations can be fed to satisfy the nutritional demands of healthy, high producing dairy cows, reduce manure excretion and therefore the environmental impacts of milk production.

Future Plans

We continue investigations on how the feeding of tannins to lactating dairy cows, and the use of MUN as a management tool  may enhance feed CP use efficiency (more feed CP transformed into milk, less excreted in manure) and reduce losses of ammonia, nitrates and nitrous oxide from dairy farms.

Authors

J. Mark Powell, Soil Scientist. USDA-ARS U.S. Dairy Forage Research Center, Madison, Wisconsin,  mark.powell@ars.usda.gov

Glen A. Broderick,  Dairy Scientist,  USDA-ARS U.S. Dairy Forage Research Center, Madison, Wisconsin

Additional Information

Powell, J.M. and Broderick, G.A. Transdisciplinary soil science research: Impacts of dairy nutrition on manure chemistry and the environment. Soil. Sci. Soc. Am. J. 75:2071–2078.

Powell, J.M. Alteration of Dairy Cattle Diets for Beneficial On-Farm Recycling of Manure Nutrients. pp 21-42  In: Applied Research in Animal Manure Management. Zhongqi H. (Ed.) Nova Science Publ. Inc.

Powell, J.M., Wattiaux, M.A., and Broderick, G.A. Evaluation of milk urea nitrogen as a management tool to reduce ammonia emissions from dairy farms. J. Dairy Sci. 94:4690–4694.


The authors are solely responsible for the content of these proceedings. The technical information does not necessarily reflect the official position of the sponsoring agencies or institutions represented by planning committee members, and inclusion and distribution herein does not constitute an endorsement of views expressed by the same. Printed materials included herein are not refereed publications. Citations should appear as follows. EXAMPLE: Authors. 2013. Title of presentation. Waste to Worth: Spreading Science and Solutions. Denver, CO. April 1-5, 2013. URL of this page. Accessed on: today’s date.

Impacts of the Michigan Agriculture Environmental Assurance Program

Waste to Worth: Spreading science and solutions logoWaste to Worth home | More proceedings….

Abstract

The Michigan Agriculture Environmental Assurance Program (MAEAP) is a holistic approach to environmental protection. It helps farmers evaluate their entire operation, regardless of size or commodity, and make sustainable management decisions balancing society’s needs, the environment, and economics. MAEAP is a partnership effort that aims to protect natural resources and build positive communities by working with farmers on environmentally responsible agricultural production practices.

To become MAEAP verified, farmers must complete three comprehensive steps: educational seminars, an on-farm risk assessment, and development and implementation of an action plan addressing potential environmental risks. The Michigan Department of Agriculture and Rural Development (MDARD) conducts an on-farm inspection to verify program requirements related to applicable state and federal environmental regulations, including the Generally Accepted Agricultural and Management Practices (GAAMPs). MAEAP benefits Michigan by helping to protect the Great Lakes by using proven scientific standards to improve air, water, and soil quality. Annual phosphorus reduction through MAEAP is over 340,451 pounds per year which is enough to grow almost 85,104 tons of algae in lakes and streams.  Farming is an environmentally intense practice and the MAEAP-verification process ensures farmers are making choices that balance production and environmental demands. The measures aimed at protecting air, soil, water, and other environmental factors mean that MAEAP-verified farmers are committed to utilizing farming practices that protect Michigan’s natural resources.

Purpose

The Michigan Agriculture Environmental Assurance Program (MAEAP) is an innovative, proactive program that assists farms of all sizes and all commodities voluntarily prevent or minimize agricultural pollution risks. MAEAP is a collaborative effort of farmers, Michigan Department of Agriculture and Rural Development, Michigan Farm Bureau, commodity organizations, universities, conservation districts, conservation groups and state and federal agencies. MAEAP teaches farmers how to identify and prevent environmental risks and work to comply with state and federal environmental regulations. Farmers who successfully complete the three phases of a MAEAP system (Farmstead, Cropping or Livestock) are rewarded by becoming verified in that system.

What Did We Do?

To become MAEAP-verified, farmers must complete three comprehensive steps: educational seminars, a thorough on-farm risk assessment, and development and implementation of an action plan addressing potential environmental risks. The Michigan Department of Agriculture and Rural Development (MDARD) conducts an on-farm inspection to verify program requirements related to applicable state and federal environmental regulations, including the Generally Accepted Agricultural Management Practices. To retain MAEAP verification, a farm must repeat all three steps including MDARD inspection every three years.

Local MAEAP farm verified in the Cropping System

What Have We Learned?

The MAEAP program is positively influencing Michigan producers and the agriculture industry. Annually, an average of 5,000 Michigan farmers attend an educational session geared toward environmental stewardship and MAEAP verification. To date, over 10,000 farms are participating with over 1,500 MAEAP verifications. On a yearly basis, over $1.2 million is spent for practice implementation by producers working towards MAEAP verification. In 2012; the sediment reduced on MAEAP-verified farms could have filled 28,642 dump trucks (10 yards each), the phosphorus reduced on MAEAP farms could have grown 138,056 tons of algae in surface waters, and the nitrogen reduced on MAEAP farms could have grown 45,515 tons of algae in surface waters.

An example of the partnership between MAEAP and Michigan Farm Bureau

Future Plans

Michigan Governor Rick Snyder has taken a vested interest in the value of the MAEAP program. In March of 2011, Governor Snyder signed Public Acts 1 and 2 which codify MAEAP into law. This provides incentives and structure for the MAEAP program. It is a goal of Governor Snyder’s to have 5,000 farms MAEAP-verified by 2015. Most importantly, through forward thinking MAEAP strives to connect farms and communities, ensure emergency preparedness and protect natural resources.

Authors

Jan Wilford, Program Manager, Michigan Department of Agriculture & Rural Development – Environmental Stewardship Division,    wilfordj9@michigan.gov

Shelby Bollwahn, MAEAP Technician – Hillsdale Conservation District

shelby.bollwahn@mi.nacdnet.net

Additional Information

www.maeap.org – MAEAP Website

http://michigan.gov/mdard/0,4610,7-125-1567_1599_25432—,00.html – MDARD MAEAP Website

http://www.facebook.com/mimaeap – MAEAP Facebook Page

Acknowledgements

MDARD MAEAP Program Office Communications Department

Michigan Farm Bureau

Michigan Association of Conservation Districts

Hillsdale County Farm Bureau

Hillsdale Conservation District

Handout version of the poster (8.5 x 11; pdf format)

The authors are solely responsible for the content of these proceedings. The technical information does not necessarily reflect the official position of the sponsoring agencies or institutions represented by planning committee members, and inclusion and distribution herein does not constitute an endorsement of views expressed by the same. Printed materials included herein are not refereed publications. Citations should appear as follows. EXAMPLE: Authors. 2013. Title of presentation. Waste to Worth: Spreading Science and Solutions. Denver, CO. April 1-5, 2013. URL of this page. Accessed on: today’s date.
Balancing Earth, Air and Fire In The Kansas Flint Hills

Waste to Worth: Spreading science and solutions logoWaste to Worth home | More proceedings….

Abstract

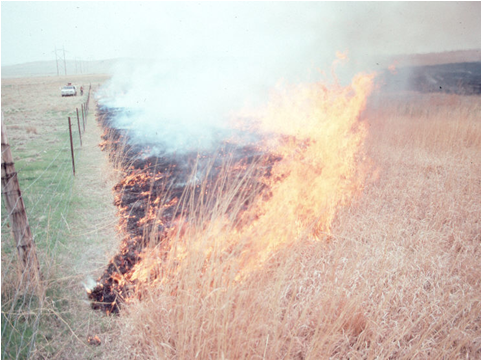
Native Americans placed great value on the four elements of life,  earth, water, air and fire. They recognized, as we do today, that fire is the most powerful land management tool. The 4.8 million acre Flint Hills region of Kansas is the largest remaining expanse of tallgrass prairie in North America.   Prescribed fire is routinely practiced in the region to enhance livestock forage quality, control invasive species, provide grassland wildlife habitat and improve plant vigor.  But where there is fire, there is smoke, and there are public health concerns when excessive smoke is in the atmosphere.   Ground level ozone can have serious public health consequences and major cities adjacent to the Flint Hills, have recorded excessive ozone levels resulting from Flint Hills prescribed fire.   A collaborative effort including the Kansas Dept of Health & Environment, EPA,  K-State Research & Extension, Kansas Livestock Association and other groups completed the Flint Hills smoke management plan in December, 2010, with the objective of reducing health concerns from prescribed fire, while retaining it as a land management tool.  The plan established a  website of “best smoke management practices” and a comprehensive education and outreach effort for land managers was implemented, involving prescribed fire schools, news articles and radio airplay.   Results of the plan are positive, indicating  that Kansas has responded to the smoke issue appropriately and will retain prescribed fire as a management practice that maintains both the tallgrass prairie of the hills, and the air quality of adjacent metro areas.  The inter-relationships of earth, water, air and fire are continual, each impacting the other.   The Kansas Flint Hills now has a plan to ensure harmony of these essential elements of life.

A prescribed fire in the Kansas Flint Hills

Prescribed Fire in Tallgrass Prairie

The Flint Hills Smoke Management Plan is a collaborative effort designed to maintain the benefit of prescribed fire on the private grasslands of the Flint Hills, while also protecting the air quality of ajor metropolitan areas such as Kansas City and Wichita.   The Flint Hills have particular environmental implications, as they are the largest expanse of tallgrass prairie remaining in North America.

What Did We Do?

Kansas Department of Health and Environment wrote the plan, but embraced those involved with the issue, including K-State Research and Extension, the KS Livestock Association, Farm Bureau, Tallgrass Legacy Alliance, KS Prescribed Fire Council, Cities of Wichita and Kansas City, Natural Resource Conservation Service, KS Dept. of Wildlife Parks & Tourism to develop a plan that would address the goals of all those involved.   A website was developed to give ranchers day by day information regarding smoke emission and direction from a prescribed fire that day or the following day.

What Have We Learned?

Those that practice prescribed fire in the Kansas Flint Hills respect the health and environment of their city neighbors.   Conversely, those living in neighboring metropolitan areas understand the economic importance of prescribed fire as related to beef cattle production, and the role fire plays in preserving the integrity of the tallgrass prairie.   By engaging all entities involved, agreements can be reached, solutions can be found and advancements can be made.

Prescribed fire controls woody species, maintaining the integrity of the tallgrass prairie.

Future Plans

In the years ahead,  KS Dept of Health and Environment will continue monitoring smoke emissions due to prescribed fire in the Flint Hills.  Those practicing prescribed fire will be encouraged to use the best smoke management methods of prescribed fire.   This will be done through K-State Research & Extension prescribed fire schools, the KS Prescribed Fire Council workshops and the KDHE website.

Authors

Jeff Davidson  K-State Research & Extension Watershed Specialist      Kansas State University     jdavidso@ksu.edu

Additional Information

http://ksfire.org

Acknowledgements

K-State Research & Extension, Kansas Precribed Fire Council, Kansas Livestock Association, KS Dept. of Health & Environment,  Tallgrass Legacy Alliance, KS Dept. of Wildlife, Parks & Tourism, Natural Resource Conservation Service, Farm Bureau, Cities of Wichita and Kansas City.


The authors are solely responsible for the content of these proceedings. The technical information does not necessarily reflect the official position of the sponsoring agencies or institutions represented by planning committee members, and inclusion and distribution herein does not constitute an endorsement of views expressed by the same. Printed materials included herein are not refereed publications. Citations should appear as follows. EXAMPLE: Authors. 2013. Title of presentation. Waste to Worth: Spreading Science and Solutions. Denver, CO. April 1-5, 2013. URL of this page. Accessed on: today’s date.

What’s the P Index?

The P Index is the Phosphorus Index, a risk assessment tool to quantify the potential for phosphorus runoff from a field. The P Index helps to target critical source areas of potential P loss for greater management attention. It includes source and transport factors. Source factors address how much P is available (for example, soil test P level and P fertilizer and manure application amounts). Transport factors evaluate the potential for runoff to occur (for example, soil erosion, distance and connectivity to water, soil slope, and soil texture). The P Index allows for relative comparisons of P runoff risk. When the P Index is high, recommendations are made either to apply manure on a P basis or not to apply manure at all. When the P Index is low, manure can be applied on a N basis. Also, if the P Index is high, the factors that are responsible for the higher risk of P loss are identified, and this information provides guidance for management practices to reduce the risk. For example, if the P Index is high because of high soil erosion, a recommendation to implement soil conservation best management practices (BMPs) may lower the risk and allow safe manure application.

For additional information:

To find your state’s P Index, do a web search for “phosphorus index” plus your state name.

Author: Jessica Davis, Colorado State University

What are the necessary components for composting animal mortalities?

For active decomposition of animal carcasses, compost microorganisms require a source of nitrogen (N) (dead livestock or birds), carbon (C) (straw, corn stalks, shavings, litter, etc.), oxygen, water and elevated temperatures. An ideal C:N ratio should fall between 15:1 to 35:1. Oxygen (air) can be introduced when turning the compost. If proper moisture is not supplied, the organisms cannot survive. Ideally, moisture content should range from 45-55%, or wet enough when the compost is squeezed to leave your hand feeling moist, without actually forming drops of water. When all components are present in the correct ratio, the compost pile heats naturally, destroying most pathogens while microbial activity degrades the carcasses.

Resources:

Check out the other video FAQs on carcass management

Author: Joshua Payne, Oklahoma State University

Reviewers: Shafiqur Rahman, North Dakota State University and Jean Bonhotal, Cornell University

How can I prevent leaching of nitrate into groundwater from manure applications?

Nitrate contamination of groundwater occurs when excess nitrate in the soil profile moves along with water that is moving down past the root zone of the crop. In most cases, it is not possible to keep water from moving past the roots, so the only other option for preventing nitrate leaching is to avoid having excess nitrate present in the root zone during times when leaching events are likely to occur. Determine the available nitrogen content of manure prior to application, and don’t apply more available nitrogen than the crop can use. Make the applications as close to the time the crop will use the nitrogen as possible.

Although only available nitrogen is subject to leaching, organic form nitrogen will become available as it mineralizes, at which time it too can leach if not utilized by the crop. The amount of nitrogen that will mineralize prior to and during the crop season should be taken into account when calculating manure application rates. If significant mineralization from previous applications is expected, plan to have a crop present to utilize it prior to leaching events.

How do you calibrate a manure spreader?

Calibrating a manure spreader is critical to ensure that the appropriate rate of manure nutrients is being applied to a field. For some livestock operations, this practice may be a required practice as part of their permit. Calibration will differ depending on the equipment and type of manure being applied.

If you know the capacity of the spreader, you need to determine the width of each pass and the distance it takes to empty the spreader to determine the rate of application. A measuring wheel is a useful tool and can often be borrowed from a local Cooperative Extension or Natural Resources Conservation Service (NRCS) office. After you have determined both of those measurements, use the charts in the publication linked below to determine application rate.

If the capacity of the manure spreader is unknown and solid manure is being spread, you can use a process that involves setting out plastic sheets or tarps of known size and driving the manure spreader over them and weighing the amount of manure that is collected on the sheets. A 22-square-foot tarp is a convenient size because the net weight of the manure on the sheet will be equal to the application rate in tons per acre. A step-by-step guide on making these calculations for other size tarps is available in the publication linked below.

For more, including specifics on calibrating solid, liquid, and irrigation manure equipment, visit Calibrating Manure Application Equipment.

Author: Jill Heemstra, University of Nebraska Extension Educator