
Scheduling conflicts, equipment breakdowns, and wet field conditions can wreak havoc on spring manure application and planting schedules. This webinar will provide valuable insights into maximizing the efficiency and timing of manure application for growing crops, especially corn. By exploring innovative techniques for liquid manure application and the potential for in-season poultry litter application, participants will learn possible ways to navigate challenges in crop management while ensuring nutrient efficiency and maintaining crop yield and quality. This presentation was originally broadcast on January 17, 2025. Continue reading “Application of Manure on Growing Crops”
Responding to PFAS on Dairy Farms in Maine
Per- and polyfluoroalkyl substances (PFAS) are persistent in the environment and in humans. While agriculture is not the source of PFAS, feed and animal production are potential transfer points. This webinar shares experiences from Maine, where PFAS was detected in soil, feed, milk, and meat and initiated a multi-pronged response and remediation approach from multiple agencies, on multiple farms. Our speakers will share the important distinctions between PFAS chemicals, short- and long-term ramifications for local farms, and remediation techniques – both implementation and research scale. This presentation was originally broadcast on December 13, 2024. Continue reading “Responding to PFAS on Dairy Farms in Maine”
Fifty Years of Environmental Progress for US Dairy Farms
Many changes have occurred in the technology, management, and resulting productivity and environmental impacts of United States dairy farms over the past 50 years. Based on research recently published in the Journal of Dairy Science, Dr. Al Rotz will discuss how changes in production have impacted 13 environmental metrics and where improvements can still be made in the future. This presentation was originally broadcast on August 16, 2024. Continue reading “Fifty Years of Environmental Progress for US Dairy Farms”
Changes in manure management between CEAP I & II
CEAP uses natural resource and farmer survey data along with physical process modeling to estimate the environmental impacts of conservation practices on cultivated cropland. This presentation was originally broadcast on September 23, 2022. Continue reading “Changes in manure management between CEAP I & II”
Cataloging and Evaluating Dairy Manure Treatment Technologies
Proceedings Home | W2W Home 
Purpose
To provide a forum for the introduction and evaluation of technologies that can treat dairy manure to the dairy farming community and the vendors that provide these technologies.
What Did We Do?
Newtrient has developed an on-line catalog of technologies that includes information on over 150 technologies and the companies that produce them as well as the Newtrient 9-Point scoring system and specific comments on each technology by the Newtrient Technology Advancement Team.
What Have We Learned?
Our interaction with both dairy farmers and technology vendors has taught us that there is a need for accurate information on the technologies that exist, where they are used, where are they effective and how they can help the modern dairy farm address serious issues in an economical and environmentally sustainable way.
Future Plans
Future plans include expansion of the catalog to include the impact of the technology types on key environmental areas and expansion to make the application of the technologies on-farm easier to conceptualize.
Corresponding author name, title, affiliation
Mark Stoermann & Newtrient Technology Advancement Team
Corresponding author email address
Other Authors
Garth Boyd, Context
Craig Frear, Regenis
Curt Gooch, Cornell University
Danna Kirk, Michigan State University
Mark Stoermann, Newtrient
Additional Information
Acknowledgements
All of the vendors and technology providers that have worked with us to make this effort a success need to be recognized for their sincere effort to help this to be a useful and informational resource.
The authors are solely responsible for the content of these proceedings. The technical information does not necessarily reflect the official position of the sponsoring agencies or institutions represented by planning committee members, and inclusion and distribution herein does not constitute an endorsement of views expressed by the same. Printed materials included herein are not refereed publications. Citations should appear as follows. EXAMPLE: Authors. 2017. Title of presentation. Waste to Worth: Spreading Science and Solutions. Cary, NC. April 18-21, 2017. URL of this page. Accessed on: today’s date.
Inclusion of the Environment Bottom Line in Waste to Worth: The Interaction Between Economics, Environmental effects, and Farm Productivity in Assessment of Manure Management Technology and Policy
Proceedings Home | W2W Home 
Purpose
In a global context, the pork industry constitutes a huge economic sector but many producers operate on very thin margins. In addition, pork is one of the largest and most important agricultural industries in North Carolina and the United States but faces a number of challenges in regards to waste management and environmental impacts.On more local scales, swine producers face a number of additional constraints including land availability, waste management options (technical and regulatory), nutrient management costs, profits, risk, and return on investment. In the face of increasingly stringent environmental regulations, decreasing land availability, and higher costs for fertilizer, it is necessary to consider alternative technologies with the potential for improving environmental conditions and creating value added products. Technology assessments generally focus on technical performance as the measure of “utility” or usefulness. Primary physical performance measures such as efficiency, production rate, and capacity, while necessary may not be sufficient for capturing the overall value of a technology. A significant amount of research has evaluated the feasibility of technology adoption based on traditional economic measures but far less research has attempted to “value” environmental performance either at farm-scale or in the larger context (e.g. supply chain response to changes in technology or policy and regulation). Considering response over time, the extent to which environmental and economic policies and regulations positively or negatively affect technology innovation, emission and nutrient management, competitiveness, and productivity, remains largely unknown.
The purpose of this study is to evaluate the environmental and economic tradeoffs between current swine waste management practices in North Carolina and alternative scenarios for future on-farm decision making that include new technologies for waste removal, treatment, and nitrogen recovery. In addition, we begin to understand these economic and environmental tradeoffs in the context of various environmental policy and regulation scenarios for markets of carbon, electricity, and mineral fertilizer.
What did we do?
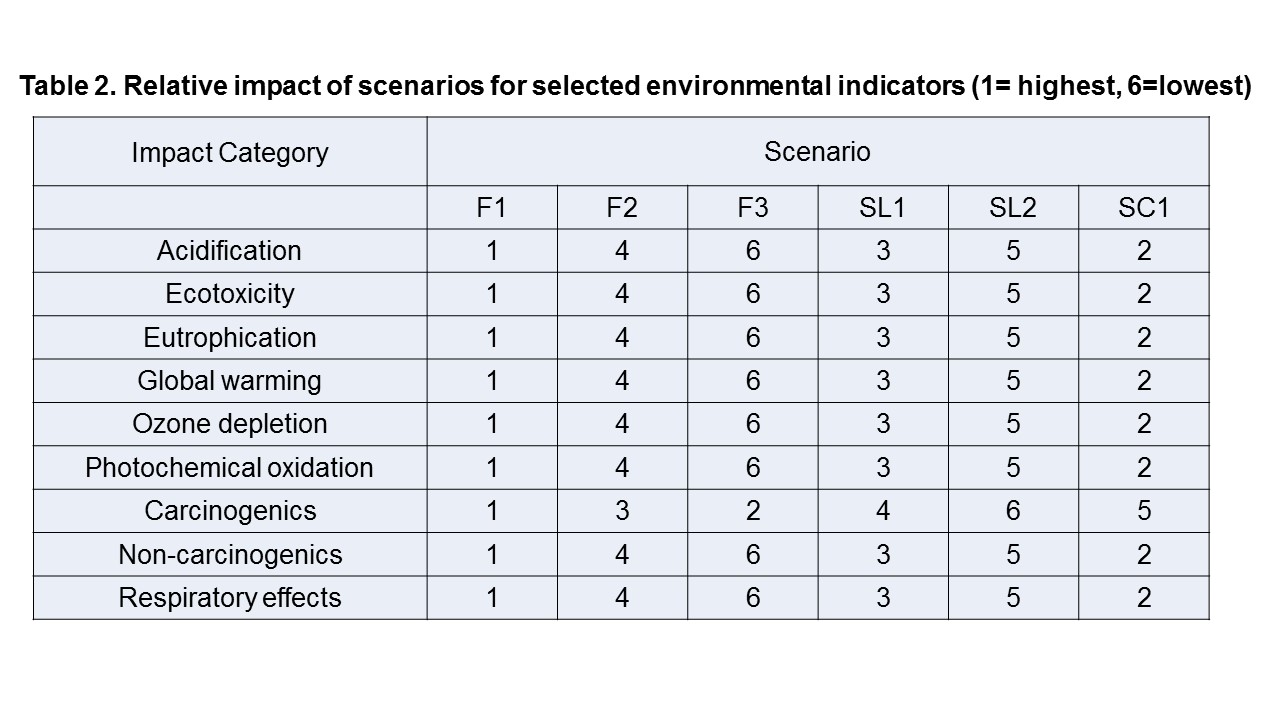
Using waste samples from swine finishing farms in southeastern NC, laboratory and bench scale experiments were conducted to determine the quantity and quality of biogas generation from anaerobic digestion and nitrogen recovery from an ammonia air stripping column. Based on these data as well as information from literature, six trial life cycle assessment scenarios were created to simulate alternatives for annual manure waste management for one finishing barn (3080 head) on the farm. Materials, energy, and emissions were included as available for all system components and processes including but not limited to waste removal from barns (flushing or scraping), treatment (open air lagoon or covered lagoon digester), nitrogen recovery (ammonia air stripping column), and land application (irrigation). A description of the scenarios as well as processes that are included/excluded for each can be found in Table 1. All scenarios were modeled over a one year operational period using a “gate to gate” approach where the mass and energy balance begins and ends on the farm (i.e. production of feed is not included and manure is fully utilized on the farm). It was assumed that each scenario included an existing anaerobic treatment lagoon with manure flushing system (baseline, representative of NC swine farms). In the remaining scenarios, the farm had an option of covering the lagoon and using it as a digester to produce biogas (offsetting natural gas); covering the digester and ammonia air stripping column for nitrogen recovery (offsetting mineral ammonium sulfate); installing a mechanical scraper system in the barn (replaces flushing); and/or different combinations of these. Open LCA, an open source life cycle and sustainability assessment software, was used for inventory analysis and the Tool for Reduction and Assessment of Chemicals and Other Environmental Impacts (TRACI 2.0) was used to characterize environmental impacts to air, water, and land. From Table 2 preliminary results indicate that all scenarios had a similar pattern in terms of impact for the assessed categories. The open air lagoon had the highest overall environmental impact followed by scraping manure with digestion and recovery and scraped slurry digestion with no nutrient recovery. Flushed manure to the digester with nutrient recovery had the lowest overall environmental impact, followed closely by scraped whole slurry to the digester with nutrient recovery.

Using energy and emissions data from the initial life cycle assessment on alternative scenarios for swine waste management systems we have started to characterize the environmental and economic outcomes arising from selected on farm technologies. More specifically we began to examine the regulatory, institutional, and market barriers associated with technology adoption within the swine industry. We provide a theoretical model to support quantification of the change in revenues and expenses that result from changes in three major markets connected to swine production – carbon, electricity, and fertilizer. We examine some of the economic characteristics of environmental benefits associated with changes to farm practices. Finally, we discuss implications for innovation in technology and policy.
What have we learned?
Preliminary results are somewhat mixed and further research is needed to see how sensitive the life cycle assessment inputs and outputs are to system components. While there is a clear indication that covering lagoons, with or without additional nutrient recovery, reduces environmental impact – farm scale systems can be quite expensive and no further determination can be made until a full economic analysis has been conducted. Modeling secondary effects, such as increased ammonia emissions in barns from flush water recirculated from digesters, remains to be included. Besides farm level cost and returns, review of literature has pointed to additional barriers to adoption of reduced environmental impact technologies. Examples of barriers include deficient or non-existent markets for environmental benefits, and various state and federal regulations and policies related to renewable energy, carbon offsets, new farm waste management technology, etc. Solutions such as better cooperation between energy firms, regulatory agencies, and farmers as well as increased financial incentives such as carbon credits, renewable energy credits, net metering options, and enabling delivery of biogas to natural gas pipelines can greatly increase the profitability and implementation of this technology on NC hog farms.
Future Plans
As this is an ongoing multi-disciplinary project, future plans include the expansion of existing data to form a more comprehensive life cycle inventory with options for both new and existing swine farms, which include additional options for waste treatment, nutrient recovery, and land application/fertilizer methods, etc. Energy and emissions data from the life cycle model will continue to be utilized as inputs into a more fully integrated model capable of reflecting the true “cost” and “values” associated with waste management treatment systems. In addition, it is expected that the integrated model will include the flexibility to simulate overall costs and returns for various sizes of operations within the county, region, and if possible state-wide.
Corresponding author, title, and affiliation
Shannon Banner, Graduate Student, North Carolina State University
Corresponding author email
Other authors
Dr. John Classen, Dr. Prince Dugba, Mr. Mark Rice, Dr. Kelly Zering
Acknowledgements
Funding for this project was provided by a grant from Smithfield Swine Production Group
The authors are solely responsible for the content of these proceedings. The technical information does not necessarily reflect the official position of the sponsoring agencies or institutions represented by planning committee members, and inclusion and distribution herein does not constitute an endorsement of views expressed by the same. Printed materials included herein are not refereed publications. Citations should appear as follows. EXAMPLE: Authors. 2017. Title of presentation. Waste to Worth: Spreading Science and Solutions. Cary, NC. April 18-21, 2017. URL of this page. Accessed on: today’s date.
Extension Recognizes Pennsylvania Farms that Adopt Sound Management Practices Protecting Water Quality and the Environment
 Purpose
The Environmentally Friendly Farm program was developed by Penn State Equine Extension and is designed to recognize farms that adopt environmentally sound management practices that protect water quality and the environment. The program is supported by funds from the USDA Natural Resource Conservation Service (NRCS), Conservation Innovation Grant. Strategies are employed on Environmentally Friendly Farms to maintain productive pastures, reduce soil erosion, limit nutrient runoff from animal facilities and barnyards, safely store manure, recycle nutrients, and control animal access to surface waters. Excess sediment and nutrient runoff from manure poses health threats not only to the environment, but also to animals and people. Farm managers who practice environmental stewardship maintain healthy environments for their animals, their families, and their community.
What did we do?
Farm managers can apply for the program by request a copy of the application from Penn State Equine Extension by visiting us online at http://www.extension.psu.edu/equine, emailing or calling our extension office. Second, complete the Environmentally Friendly Farm application requesting background information about the farm operation.
Next, complete the Environmentally Friendly Farm Self-Assessment Checklist. Each statement is checked “yes” if the practice is in place on the farm, “no” if the practice is not in place or “non-applicable if the statement does not pertain to the farm operation. The checklist consists of a series of statements that identify potential on-farm practices in the following areas: Environmentally Sensitive Areas, Pastures, Animal Concentration Areas, Manure Storage, and Mechanical Manure Application.
Once the paperwork has been received, a farm site visit will be scheduled. Personnel from Penn State Extension, the County Conservation District, or the Natural Resource Conservation District (NRCS) will visit farms to verify that statements made in the application and checklists are accurate. At the same time, additional information and assistance will be provided to help improve farm management and develop any necessary plans for the farm.
The farm will be recognized by the public, conservation and agricultural agencies, and other farm managers as an operation that is committed to clean water and a healthy environment. Each farm manager will receive an Environmentally Friendly Farm sign that can be displayed on the farmstead. Farms that qualify will also be given permission to use the Environmentally Friendly Farm artwork on their website, brochure, and other marketing materials. Approved farms will be listed on the Penn State Equine Extension website.
This recognition will reflect the commitment of the farm manager to environmental stewardship and can serve as a marketing tool for the farm.
What have we learned?
After personnel visited farms to verify that statements made in the application and checklists are accurate. At the same time, additional information and assistance is provided to help improve farm management and develop any necessary plans for the farm. In addition, agency personal developed a personal relationship with the farm manager. The farm managers who practice environmental stewardship maintain healthy environments for their animals, their families, and their community.
Future Plans
This program will be continued through 2016. We hope to provide additional information and assistance to help improve farm management.
Authors
Ann Swinker, Extension Horse Specialist aswinker@psu.edu
Donna Foulk, Helene McKernan, Pennsylvania State University, University Park, PA 16802
Additional information
Farms can request a copy of the application from the Penn State Extension Equine Team by visiting us online at http://www.extension.psu.edu/equine
Acknowledgements
This program was funded partly by a USDA NRCS-CIG grant.
The authors are solely responsible for the content of these proceedings. The technical information does not necessarily reflect the official position of the sponsoring agencies or institutions represented by planning committee members, and inclusion and distribution herein does not constitute an endorsement of views expressed by the same. Printed materials included herein are not refereed publications. Citations should appear as follows. EXAMPLE: Authors. 2015. Title of presentation. Waste to Worth: Spreading Science and Solutions. Seattle, WA. March 31-April 3, 2015. URL of this page. Accessed on: today’s date.
Environmental Antibiotic Resistance Bacteria and Genes: A Link to Public Health?
Purpose
The emergence of antibiotic resistant bacterial genes in previously susceptible pathogens has become a major challenge in treatment of infectious diseases in the 21st century. I will describe how environmental antibiotic resistance genes and resistant bacteria affect and interact with human health issues and the connection between human, animal and environmental health using the One Health model.

Figure 1. Antibiotic resistant genes and antibiotic resistant bacteria are shared by animals, humans and the environment.
What did we do?
The 2013 CDC publication estimates ~2 million people develop antibiotic-resistant infections with ~ 23,000 dying as a direct result of these infections. The rapid development of antibiotic resistant bacteria (ARB) and the identification of many new antibiotic resistant genes (ARG) over the last few decades is a recent event following the large-scale production and use of antibiotics in clinical/veterinary medicine, agriculture, aquaculture and horticulture over the past 70 years. The majority of today’s antibiotics are produced by soil Streptomyces spp. These microbes have genes which are able to protect their host from the action of these naturally produced antibiotics. These protection proteins often have similar action to “classical ARGs” or are genetically related to ARGs found in pathogens. Environmental bacteria are thought to be one ancestral source for many of the clinically relevant antibiotic resistant genes ass ociated with pathogens infecting humans and animals today. Another example is the qnrA gene which is associated with plasmid-linked fluoroquinolone resistance that originated in the aquatic bacterium Shewanell algae. Gene cluster conferring glycopeptide resistance in enterococci, which create vancomycin resistant enterococci (VRE), have been identified in many Gram-positive bacteria including common soil bacteria, some of which are plant pathogens. These same soil bacteria are also resistant to daptomycin, a relative newly developed antibiotic, which currently has restrictive use in clinical medicine. Recently it has been determined that municipal wastewater treatment does not remove antibiotics, ARGs and may be enriched for ARBs which contaminate the water environment. Indicating that human civilization, unknowingly is contaminating the environment, and contributes to the development of new ARB/ARGs.
In recent years, carbapenemase-producing Enterobacteriaceae (CPE) have increased throughout the USA and the world. Carbapenemase producing Klebsiella pneumoniae (KPC) have been associated with USA hospital outbreaks while other CREs carrying the New Delhi metallo-beta-lactamase (NDM-1) producing Enterobacteriaceae have generally been imported and still rarely cause disease in the USA. The NDM-1 containing Enterobacteriaceae have been found in sewage and drinking water and the environment in India, sewage in China and more recently in Brazilian waters. Where these resistant genes have come from is not clear. However, our recent work suggests that we can isolated environmental bacteria that can grow in the presence of meropenem and by qPCR we can get positive reactions for some CRE genes in environmental as well as sewage samples. All together suggests that their may be environmental sources for carbapenemase resistances.
What have we learned?
Data is accumulating to indicate that antibiotic resistant genes from the environment play an important role not only as reservoirs for antibiotic resistance genes found because of human/animal contamination but also independently providing new antibiotic resistant genes which can then be spread to humans and animals and create serious problems as is currently occurring with CRE.
Future Plans
Verify the potential sources of CRE genes within the environment including identification of the bacteria which are current resistant to carbapenems and what their mechanism of resistance is.
Author
Marilyn C. Roberts, Professor, Department of Environmental & Occupational Health Sciences, School of Public Health, University of Washington, Seattle WA 98195-7234 marilynr@uw.edu
Additional information
http://www.cdc.gov/drugresistance/threat-report-2013/pdf/ar-threats-2013- 508.pdf
http://mmbr.asm.org/content/74/3/417.full.pdf+html
http://mmbr.asm.org/content/74/3/417.full.pdf+html
The authors are solely responsible for the content of these proceedings. The technical information does not necessarily reflect the official position of the sponsoring agencies or institutions represented by planning committee members, and inclusion and distribution herein does not constitute an endorsement of views expressed by the same. Printed materials included herein are not refereed publications. Citations should appear as follows. EXAMPLE: Authors. 2015. Title of presentation. Waste to Worth: Spreading Science and Solutions. Seattle, WA. March 31-April 3, 2015. URL of this page. Accessed on: today’s date.
Environmental Footprints of Beef Production in the Kansas, Oklahoma and Texas Region
Why Look at the Environmental Footprint of Livestock?
Both producers and consumers of animal products have concern for the environmental sustainability of production systems. Added to these concerns is the need to increase production to meet the demand of a growing population worldwide with an increasing desire for high quality protein. A procedure has been developed (Rotz et al., 2013) that is now being implemented by the U.S. beef industry in a comprehensive national assessment of the sustainability of beef. The first of seven regions to be analyzed consisted of Kansas, Oklahoma and Texas.
What did we do?
A survey and visits of ranch and feedyard operations throughout the three state region provided data on common production practices. From these data, representative ranch and feedyard operations were defined and simulated for the climate and soil conditions throughout the region using the Integrated Farm System Model (USDA-ARS, 2014). These simulations predicted environmental impacts of each operation including farm-gate carbon, energy, water and reactive nitrogen footprints. Individual ranch and feedyard operations were linked to form 28 representative cattle production systems. A weighted average of the production systems was used to determine the environmental footprints for the region where weighting factors were determined based upon animal numbers obtained from national agricultural statistics and survey data. Along with the traditional beef production systems, Holstein steers and cull animals from the dairy industry in the region were a lso included.
What have we learned?
The carbon footprint of beef produced was 18.4 ± 1.7 kg CO2e/kg carcass weight (CW) with the range in individual production systems being 13.0 to 25.4 kg CO2e/kg CW. Footprints for fossil energy use, non precipitation water use, and reactive nitrogen loss were 51 ± 4.8 MJ/kg CW, 2450 ± 450 liters/kg CW and 138 ± 12 g N/kg CW, respectively. The major portion of the carbon, energy and reactive nitrogen footprints was associated with the cow-calf phase of production (Figure 1).

Beef footprints
Future Plans
Further analyses are planned for the remaining six regions of the U.S. which will be combined to provide a national assessment. Cattle production data will be combined with processing, marketing and consumer data to complete a comprehensive life cycle assessment of beef production and use.
Authors
C. Alan Rotz, Agricultural Engineer, USDA-ARS al.rotz@ars.usda.gov
Senorpe Asem-Hiablie and Kim Stackhouse-Lawson
Additional information
Rotz, C. A., B. J. Isenberg, K. R. Stackhouse-Lawson, and J. Pollak. 2013. A simulation-based approach for evaluating and comparing the environmental footprints of beef production systems. J. Anim. Sci. 91:5427-5437.
USDA-ARS. 2014. Integrated Farm System Model. Pasture Systems and Watershed Mgt. Res. Unit, University Park, PA. Available at: http://www.ars.usda.gov/Main/docs.htm?docid=8519. Accessed 5 January, 2015.
Acknowledgements
This work was partially supported by the Beef Checkoff.
The authors are solely responsible for the content of these proceedings. The technical information does not necessarily reflect the official position of the sponsoring agencies or institutions represented by planning committee members, and inclusion and distribution herein does not constitute an endorsement of views expressed by the same. Printed materials included herein are not refereed publications. Citations should appear as follows. EXAMPLE: Authors. 2015. Title of presentation. Waste to Worth: Spreading Science and Solutions. Seattle, WA. March 31-April 3, 2015. URL of this page. Accessed on: today’s date.
Software For Evaluating the Environmental Impact of Dairy and Beef Production Systems
![]() Waste to Worth home | More proceedings….
Waste to Worth home | More proceedings….
Why Model Environmental Impacts of Livestock?
Quantifying the long term environmental impacts of dairy and beef production is complex due to the many interactions among the physical and biological components of farms that affect the amount and type of emissions that occur. Emissions are influenced by climate and soil characteristics as well as internal management practices. Software models are needed to perform an integrated and comprehensive assessment of all important environmental and economic effects of farm management and mitigation strategies. Related: Manure value & economics
What Did We Do?
|
|

Software tools were created that perform whole-farm analyses of the performance, economics and environmental impact of dairy and beef production systems. The Integrated Farm System Model (IFSM) is a comprehensive research tool that simulates production systems over many years of weather to quantify losses to the environment and the economics of production. From the simulated performance and losses, environmental footprints are determined for carbon, energy use, water use and reactive nitrogen loss. Crop, dairy and beef producing farms can be simulated under different management scenarios to evaluate and compare potential environmental and economic benefits. The Dairy Gas Emissions Model (DairyGEM) provides a simpler educational tool for studying management effects on greenhouse gas, ammonia and hydrogen sulfide emissions and the carbon, energy and water footprints of dairy production systems.
What Have We Learned?
Analyses with either the IFSM or DairyGEM tools illustrate the complexity of farming systems and the resultant effect of management choices. Although IFSM was primarily developed and used as a research tool, it is also used in classroom teaching and other education applications. DairyGEM provides an easier and more graphical tool that is best suited to educational use.
Future Plans
|
|

Development of these software tools continues. Work is currently underway to add the simulation of VOC emissions to both models. Routines are also being implemented to better represent the performance and emissions of beef feed yards.
Authors
C. Alan Rotz, Agricultural Engineer, USDA/ARS; al.rotz@ars.usda.gov
Additional Information
The IFSM and DairyGEM software tools are available through Internet download [https://www.ars.usda.gov/research/software/?modeCode=80-70-05-00] for use in individual, workshop and classroom education. Reference manuals and other detailed information on the models is also available at this website.
Acknowledgements
Many people have contributed to the development of these models and software tools. Although they can not all be listed here, they are acknowledged in each software program.
The authors are solely responsible for the content of these proceedings. The technical information does not necessarily reflect the official position of the sponsoring agencies or institutions represented by planning committee members, and inclusion and distribution herein does not constitute an endorsement of views expressed by the same. Printed materials included herein are not refereed publications. Citations should appear as follows. EXAMPLE: Authors. 2013. Title of presentation. Waste to Worth: Spreading Science and Solutions. Denver, CO. April 1-5, 2013. URL of this page. Accessed on: today’s date.