
Water Quality Initiatives for Small Iowa Beef and Dairy Feedlot Operations (Small Feedlot Project)

Waste to Worth: Spreading science and solutions logoWaste to Worth home | More proceedings….

Abstract

Traditionally, small feedlots and dairies have not been engaged in environmental regulations and awareness in Iowa due to the environmental focus being directed at large feedlots and confinement feeding operations.  Many small feedlot and dairy managers do not even recognize or admit that regulations do apply to their livestock operation. This effort primarily uses traditional extension outreach methods, field days and publications, to raise awareness.  Unique to this outreach effort are the goal to provide a producer network to share information and ideas to learn more about manure runoff control structures and best management practices to reduce impacts on water quality, and the focus on controls beyond minimum rule requirements, but tailored to small operations.

This talk will discuss some of the challenges faced by small feedlot producers, identification of parameters to help producers overcome some of these challenges, and methods and educational materials aimed at helping raise environmental awareness and foster action among these producers.

Purpose

The Small Feedlot Project is a cooperative effort between state and federal regulatory agencies, public research and extension, technical agencies and the private sector in Iowa.  The primary objectives are to 1) educate producers to better understand the pollution potential of open feedlot runoff, 2) train producers to accurately assess the water pollution potential of their own feedlots, 3) assist producers to identify and evaluate appropriate runoff control alternatives, and 4) provide technical assistance to producers to implement solutions that improve the environmental performance of their feedlots.  

What Did We Do?

The first focus in regards to raising awareness about potential impacts of runoff from open feedlots was the development of two producers guides that specifically talk about open lot runoff and impacts on water quality,  applicable regulations,  the importance and how to assess risk, structural solutions, management solutions and a list of appropriate resources.  The guides, PM 3018, Small Open Beef Feedlots in Iowa- a producer guide and PM 3019, Small Open Lot Dairies in Iowa- a producer guide, were both written and printed in 2012.  These publications were peered reviewed by internal and external partners to the Small Feedlot Plan.  Two-thousand copies of each publication were printed and have been widely distributed via field days, workshops and meetings.  The publications have been in such demand that as of February 2013, only 26 copies of the beef publication and 630 copies of the dairy pub remain in stock. 

The second focus to raising awareness was to offer multiple field days that showcased structural or management practices put in place by feedlot owners to address runoff from their farms.  It is well-known that livestock producers respond well to field days where they can observe physical site conditions that impact runoff, see structural (i.e. settling basins, pumping demonstration, clean-water diversions) or management practices (i.e.  pen scraping, manure removal) put in place by other producers; can ask management and cost of implementation questions to other producers; and can discuss regulations and other management decisions with Extension and agency staff. 

Three field days were held in 2012 to provide options to look at different sizes of feedlots, dirt versus concrete lots and structural and management practices on farms.  The first field day was a three-stop tour held on August 7 near Larchwood, IA with 26 people in attendance; the second field day was held on October 29 near Wall Lake, IA, with 22 people in attendance; and the third field day was held on October 31 near Andover, IA with 26 people in attendance.


What Have We Learned?

A post-field day evaluation was offered to attendees at the Wall Lake and Andover Field Days.  A summary of the evaluations completed follows:

  • 29% reported their understanding of impact of feedlot runoff on stream water quality “increased a lot”; while 56% reported their understanding “increased a little”.
  • 38% reported their understanding of lost-cost methods to better control and manage feedlot runoff “increased a lot”; while 52% reported their understanding “increased a little”.
  • 29% reported their understanding of the value of feedlot manure for crop production “increased a lot”; while 60% reported their understanding “increased a little”.
  • 31% reported their understanding of available technical and financial assistance for feedlot runoff control improvement “increased a lot”; while 58% reported their understanding “increased a little”. 
  • 35% reported they are more likely to plan and install additional improvements to feedlot runoff controls on their farms as a result of attending a field day. 

Future Plans

Future plans include the development of fact sheets that address specific practices small open lot dairy and beef operations can use to protect water quality and additional field days throughout 2013.  New materials will be posted to a Web page specifically created to host resources for small open lots. 

Authors

Angela Rieck-Hinz, Extension Program Specialist, Iowa State University, amrieck@iastate.edu

Shawn Shouse, Extension Field Ag Engineer, Iowa State University

Additional Information

Small Feedlots and Dairy Operations Web Page

Acknowledgements

Partners in the Water Quality Initiatives for Small Iowa Beef and Dairy Feedlot Operations

The authors are solely responsible for the content of these proceedings. The technical information does not necessarily reflect the official position of the sponsoring agencies or institutions represented by planning committee members, and inclusion and distribution herein does not constitute an endorsement of views expressed by the same. Printed materials included herein are not refereed publications. Citations should appear as follows. EXAMPLE: Authors. 2013. Title of presentation. Waste to Worth: Spreading Science and Solutions. Denver, CO. April 1-5, 2013. URL of this page. Accessed on: today’s date.

Using Soil Moisture to Predict the Risk of Runoff on Non-Frozen Ground

Waste to Worth: Spreading science and solutions logoWaste to Worth home | More proceedings….

Why Study Risk and Runoff Potential?

Identifying time periods when land application of manure is likely to contribute to surface runoff contamination is important for making proper management decisions and reducing the risk of surface water contamination.  Recently, a great deal of attention has been focused on reducing nutrient and sediment losses from the winter period.  However, sediment and nutrient losses during the late spring period can be significant and it is important to understand landscape and weather conditions that lead to elevated runoff risk during this time period. 

What Did We Do?

Surface runoff and weather data were gathered at multiple edge-of-field Discovery Farm monitoring stations in Wisconsin.  Soil moisture data were also collected.  Data were analyzed by each storm event during the non-frozen ground period to determine the impact of antecedent soil moisture on surface runoff generation.

What Have We Learned?

Data from the Wisconsin Discovery Farms Program has identified two key time periods with an elevated risk of surface runoff from agricultural fields: the late winter period (February – March) and the late spring period (May – June).  Eighty-one percent of the average annual surface runoff was observed during these two time periods with the late winter period accounting for 50% and the late spring period accounting for 31%.  Data collected over the past 12 years of the Wisconsin Discovery Farm Program indicate that the vast majority (86%) of non-frozen ground runoff occurs when soil moisture is in excess of 35%.   High antecedent soil moisture can indicate risk for surface runoff in agricultural watersheds and can also influence the quantity of surface runoff generated during rainfall events. Avoiding manure applications during time periods with a high probability of rainfall and when soil moisture is at or near threshold levels decreases the risk of surface water contamination. Agricultural producers can utilize soil moisture measurement to guide the timing and rate of manure application to further reduce environmental risk.

Future Plans

Producer education and outreach

Authors

Tim Radatz, Research Specialist , Discovery Farms MN & WI, radatz@mawrc.org

Anita Thompson, Associate Professor, University of Wisconsin – Madison

Fred Madison, Professor, University of Wisconsin – Madison

Additional Information

Radatz, T. F., Thompson, A. M. and Madison, F. W. (2012), Soil moisture and rainfall intensity thresholds for runoff generation in southwestern Wisconsin agricultural watersheds. Hydrol. Process.. doi: 10.1002/hyp.9460

Acknowledgements

UW Discovery Farms Program and Staff

UW-Platteville Pioneer Farm Program and Staff


The authors are solely responsible for the content of these proceedings. The technical information does not necessarily reflect the official position of the sponsoring agencies or institutions represented by planning committee members, and inclusion and distribution herein does not constitute an endorsement of views expressed by the same. Printed materials included herein are not refereed publications. Citations should appear as follows. EXAMPLE: Authors. 2013. Title of presentation. Waste to Worth: Spreading Science and Solutions. Denver, CO. April 1-5, 2013. URL of this page. Accessed on: today’s date.
Photometric measurement of ground-level fugitive dust emissions from open-lot animal feeding operations.

Waste to Worth: Spreading science and solutions logoWaste to Worth home | More proceedings….

Abstract

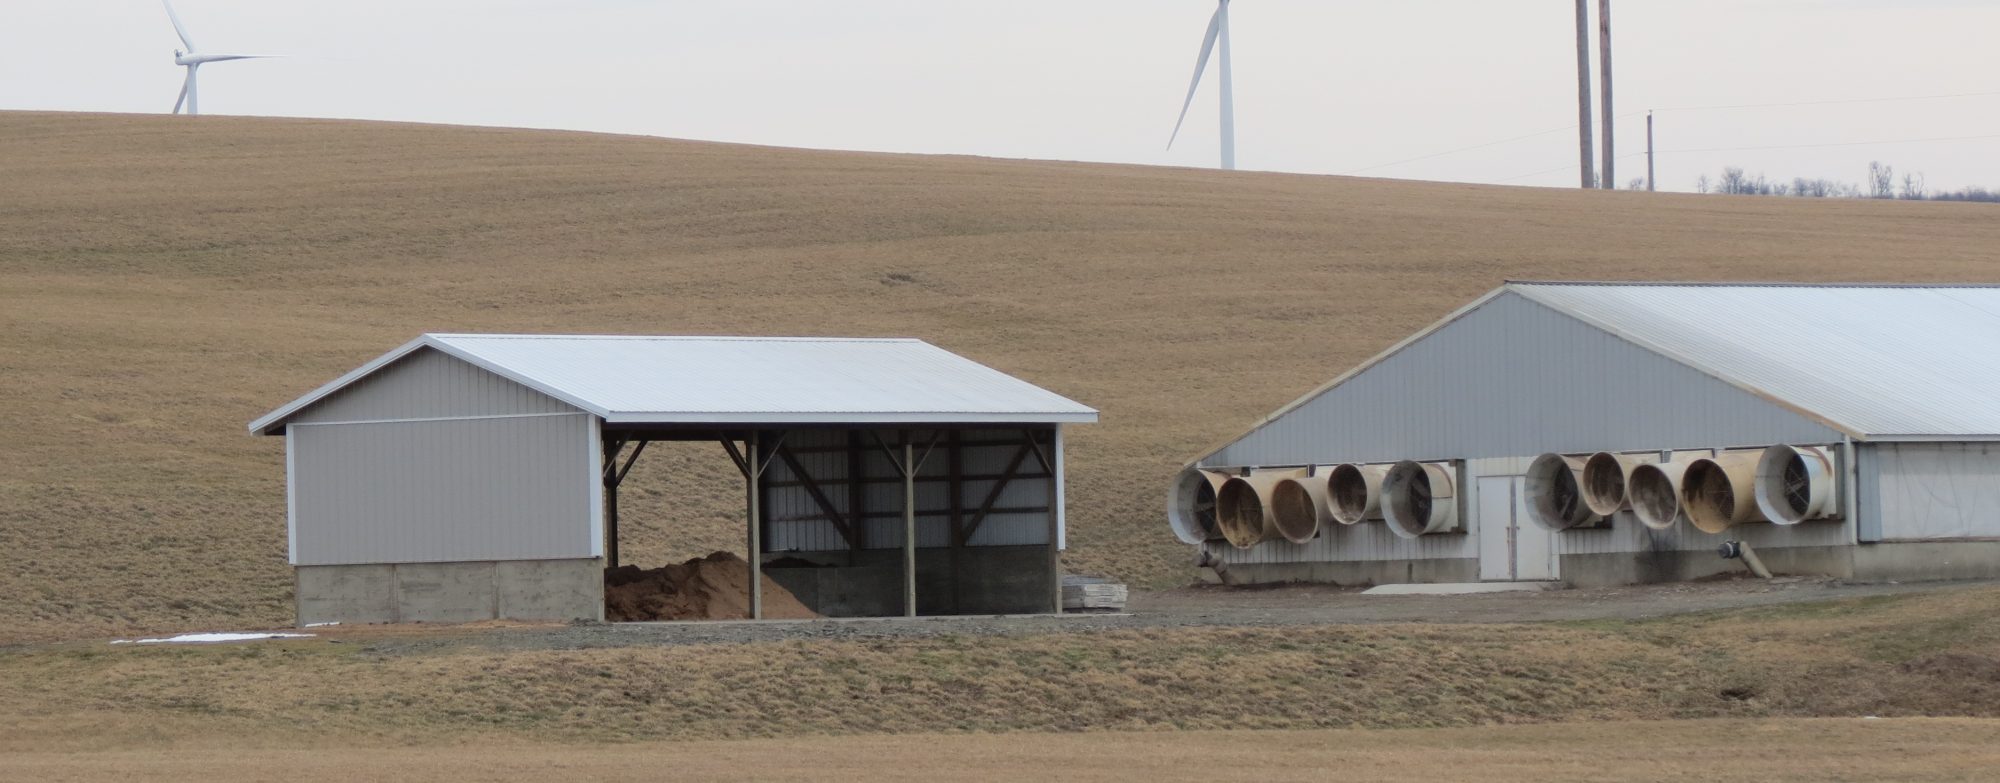
Fugitive dust from confined livestock operations is a primary air quality issue associated with impaired visibility, nuisance odor, and other quality-of-life factors.  Particulate matter has conventionally been measured using costly scientific instruments such as transmissometers, nephelometers, or tapered-element, oscillating microbalances (TEOMs).  The use of digital imaging and automated data-acquisition systems has become a standard practice in some locations to track visibility conditions on roadways; however, the concept of using photometry to measure fugitive dust concentrations near confined livestock operations is relatively new.  We have developed a photometric method to estimate path-averaged particulate matter (PM10) concentrations using digital SLR cameras and high-contrast visibility targets.  Digital imaging, followed by automated image processing and interpretation, would be a plausible, cost-effective alternative for operators of confined livestock facilities to monitor on-site dust concentrations.  We report on the development and ongoing evaluation of such a method for use by cattle feeders and open-lot dairy producers.

Purpose

To develop a low-cost practical alternative for measurement of path-averaged particulate matter (PM10) concentrations downwind of open-lot animal feeding operations.

What Did We Do?

Working downwind of a cattle feedyard under a variety of dust conditions, we photographed an array of high contrast visibility targets with dSLR cameras and compared contrast data extracted from the photographs with path-averaged particulate matter (PM10) concentration data collected from several TEOMs codeployed alonside the visibility targets.

What Have We Learned?

We have developed a photometric method to estimate path-averaged particulate matter (PM10) concentrations using digital SLR cameras and high-contrast visibility targets.  Using contrast data from digital images we expect to predict PM10 concentrations within 20% of TEOM values under the dustiest conditions.  Digital imaging, followed by automated image processing and interpretation, may be a plausible, cost-effective alternative for operators of open-lot livestock facilities to monitor on-site dust concentrations and evaluate the abatement measures and management practices they put in place.

Future Plans

We intend to improve the prediction accuracy of the photometric method and automate it such that it can be easily adapted for use as a cost-effective alternative for measuring path-averaged particulate matter (PM10) concentrations at cattle feedyards and open-lot dairies.

Authors

Brent Auvermann, Professor of Biological and Agricultural Engineering, Texas A&M AgriLife Research.  b-auvermann@tamu.edu

Sharon Preece, Senior Research Associate, Texas A&M AgriLife Research; Brent W. Auvermann, Professor of Biological and Agricultural Engineering, Texas A&M AgriLife Research; Taek M. Kwon, Professor of Electrical and Computer Engineering, University of Minnesota-Duluth; Gary W. Marek, Postdoctoral Research Associate, Texas A&M AgriLife Research; Kevin Heflin, Extension Associate, Texas A&M AgriLife Research; K. Jack Bush, Research Associate, Texas A&M AgriLife Research.

Additional Information

Please contact Brent W. Auvermann, Professor of Biological and Agricultural Engineering, Texas A&M AgriLife Research, 6500 Amarillo Boulevard West, Amarillo TX, 79106, Phone: 806-677-5600, Email: b-auvermann@tamu.edu.

Acknowledgements

This research was underwritten by grants from the USDA National Institute on Food and Agriculture (contract nos. 2010-34466-20739 and 2009-55112-05235).

The authors are solely responsible for the content of these proceedings. The technical information does not necessarily reflect the official position of the sponsoring agencies or institutions represented by planning committee members, and inclusion and distribution herein does not constitute an endorsement of views expressed by the same. Printed materials included herein are not refereed publications. Citations should appear as follows. EXAMPLE: Authors. 2013. Title of presentation. Waste to Worth: Spreading Science and Solutions. Denver, CO. April 1-5, 2013. URL of this page. Accessed on: today’s date.

Case Study: Poultry Lagoon Closure in Texas

Waste to Worth: Spreading science and solutions logoWaste to Worth home | More proceedings….

Abstract

The closure of earthen lagoons associated with a caged egg-laying operation was used as a case study.  This case study presents information on the steps taken to close the lagoons, including topographic survey needs, analysis of sludge and wastewater at different times during the closure process, methods for excavating and removing the sludge, and the costs associated with the closure of earthen lagoons.  The sludge has a high fertilizer value for P2O5 and other micro- and macro-nutrients.  The cost of the closure for this case exceeded the expected cost for the earthwork for the construction of a new facility

Why Present a Case Study on Propoer Lagoon Closure?

Provide the steps taken to close the lagoons, including topographic survey needs, analysis of sludge and wastewater at different times during the closure process, methods for excavating and removing the sludge, and the costs associated with the closure of earthen lagoons.  These steps will hopefully assist others in the future closure of lagoons.

What Did We Do?

Performed closure of earthen lagoons for a caged egg-laying operation that existed for over 35 years in Gonzales County, Texas.  The 100 ft by 400 ft football field sized lagoon area with 5 – 12 ft deep sludge had accumulated approximately 20,000 cubic yards of sludge.  The photo below depicts the three lagoon areas (Infrared photograph of site depicting two lagoons and smaller wastewater storage area (USDA-NAPP, 1983).

Multiple different options for closure of the lagoon were evaluated.  Sampling in-situ materials to determine if the existing system had a realistic potential for seepage.  Detailed analysis of the sludge and wastewater were performed throughout the project.  A detailed survey of the site determined the existing volumes of sludge and wastewater.  Civil 3D and Eagle Point software programs assisted in development of a final grading plan for the site.

Construction drawings and specifications were developed to place the site into pre-existing conditions. The construction project was split into four phases:  Phase 1 – Sludge and Wastewater Removal; Phase 2 – Removal of Sludge to Nearby Agricultural Operation; Phase 3 – Demolition of Concrete Slabs and Final Grading; and Phase 4 – Establishing Vegetation on Site

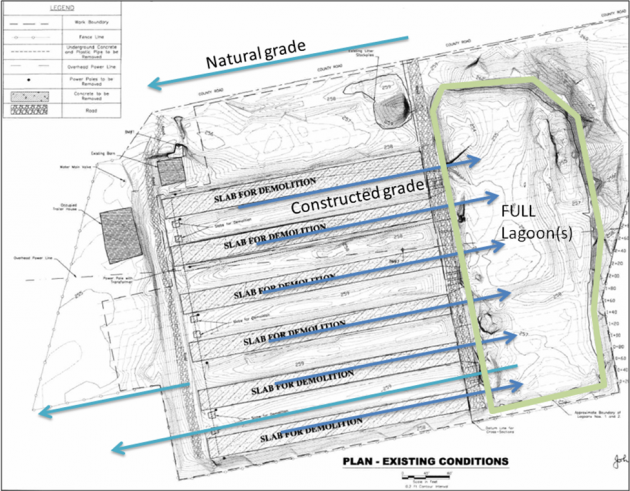
Site plan generated for construction plans depicting the natural grade compared to the constructed grade of the poultry houses. (USDA-NRCS, Poultry Lagoon Closure Construction Drawings, March 2008)

Irrigation pump for the removal of wastewater (TSSWCB, 22 June 2009)

Use of field conveyor belts to stack sludge on-site.  (TSSWCB, 28 June 2009)

What Have We Learned?

Formal contracting potentially increases the cost of the project; however, observance of worker safety laws is more likely .  Initially this project was sent for bid as a turn key project consisting of 18,500 CY of sludge to be removed and land applied, removal of concrete slabs, placement of 27,000 CY of compacted earthfill, final grading and establishment of vegetative cover.  As part of the bid, the contractor was to secure a location for the sludge to be land applied or find another use for the sludge.  The bids received ranged from $1.8M up to $3M.  This level of funding was not available, so the project was split into different phases.  By breaking into phases, the cost of the project was reduced by over 75%.  Costs for application or hauling of sludge can be reduced by having an agreement in place prior to contracting.

The cost of the project was close to $250,000 for construction and sludge hauling without consideration of other costs, such as engineering design work, sample analysis, and staff time.  The earthwork associated with the construction of this site for a new facility with the excavation and placement of 27,200 CY of compacted earthfill would have been completed for approximately $70,000.

With flexible scheduling, it was possible to find a landowner that was willing to pay for the hauling and land application of sludge, which reduced the out-of-pocket expenses for the closure by more than $90,000.

The amount of Phosphorus present in the sludge was compared to the cost of commercial fertilizer.  As of February 2011, Rock Phosphate with 32% P2O5 was selling at $160/metric ton (Index Mundi, 11 June 2012), therefore P2O5  was $500 per metric ton.  Using the hauled weight of 12,100 tons with a moisture content of 25.9% and 5.66% P and a conversion factor of 2.29 for P to P2O5, there was 1,160 tons (1,054 metric tons) of P2O5.  At the rate of $500 /metric ton, the P2O5 in the sludge would have a value of $525,000.  There is additional fertilizer value for the other constituents that are not included.

Future Plans

This case study provides much needed data for the closure of similar operations across the United States.  The data collected will be used for future closures under the NRCS Environmental Quality Incentives Program (EQIP).  The construction specifications that were developed for this project can be adapted into general specifications for future closure projects.  Additional work is needed to compare the value of the sludge to a fertilizer value.  The potential for a portable pelletizing and bagging system for recycling sludge from lagoons warrants further research.

Authors

Catherine Nash, Water Resources Engineer, USDA – Natural Resources Conservation Service Catherine.nash@tx.usda.gov

Additional Information

“Case Study:  Closure of Earthen Lagoon”, An ASABE Meeting Presentation, Paper No. 1336921

Archived webinar  – Poultry Lagoon Closure – Case in Progress

Acknowledgements

Contributions from Texas Poultry Federation, Gonzales Soil and Water Conservation District, Texas State Soil and Water Conservation Board (TSSWCB), USDA – Natural Resources Conservation Service (NRCS), Texas Water Resources Institute, Farm Pilot Project Corporation, Inc. (FPPC) and others made this project possible. A special thanks to:  John Foster, TSSWCB, and James Grimm, Texas Poultry Federation, for initiating the project and keeping it moving forward;  Lee Munz, TSSWCB for assistance with surveying and taking the lead on his first construction project; John Mueller, NRCS for his support and guidance through the process; Ace Fairchild, NRCS, for his enthusiasm and support throughout the project; Wayne Gabriel, NRCS, for assistance with soils identification; Tom Beach, NRCS, for evaluating feasibility of other options for closure; Shawn Higgins for assistance, endurance and encouragement with the development of Engineering Drawings and Specifications.  Thanks to Gonzales County Soil and Water District Employees who helped throughout the project, including:  Jeremiah Ford, Abigail Lindsey, Shari Johnson, Jessi Goodson and Wain Fairchild.  Thanks to TSSWCB staff including: Lawrence Brown, Jeff Cerny, Amy Devereaux, TJ Helton, Dawna Winkler, and Kenny Zajicek.  Thanks to USDA-NRCS staff including:  James Davis, Andria Heiges, Jeff Porter, Doug Sharer, James Smith, and Millie Stevens.  Thanks to AgriLife Extension members:  Saqib Mukhtar, Biological and Agricultural Engineering Department; and Sam Feagley, Department of Soil and Crop Sciences.  Every person that was asked for assistance responded graciously and enthusiastically in a timely manner.

The authors are solely responsible for the content of these proceedings. The technical information does not necessarily reflect the official position of the sponsoring agencies or institutions represented by planning committee members, and inclusion and distribution herein does not constitute an endorsement of views expressed by the same. Printed materials included herein are not refereed publications. Citations should appear as follows. EXAMPLE: Authors. 2013. Title of presentation. Waste to Worth: Spreading Science and Solutions. Denver, CO. April 1-5, 2013. URL of this page. Accessed on: today’s date.

White Meat-Green Farm: Case Study of Brinson Farms

Waste to Worth: Spreading science and solutions logoWaste to Worth home | More proceedings….

Abstract

Comprehensive on-farm resource utilization and renewable energy generation at the farm scale are not new concepts.  However, truly encompassing implementation of these ideals is lacking.  Brinson Farms operates 10 commercial broiler houses.  The farm generates heat for its houses using biomass boilers and litter anaerobic digestion to produce methane.  Solar panels assist in heating process water for the boilers and digester.  Biomass feedstock includes litter as well as municipal yard wastes.  Liquid fertilizer is a product of the digester while residual solids are included in the farm’s composting operation.  The operator has used a futuristic approach to not only attain energy independence for the farm, but also to comprehensively utilize byproducts of production and other local “wastes”, diverting them from local landfills.  Considering the propane cost for a single winter flock has reached $66,000 and the annual electric bill may be $120,000, energy costs very much affect grower profitability.  This approach decreases the uncertainty in energy costs.  Brinson Farms provides a unique look into ensuring long-term farm sustainability in an environmentally friendly way and with a wide-ranging systems approach to management.

Purpose

The purpose of the renewable energy project was to implement an innovative, sustainable solution to manage poultry manure and other organic waste products using anaerobic digestion as well as to demonstrate the ability to effectively and economically reduce dependence on outside utilities.

What Did We Do?

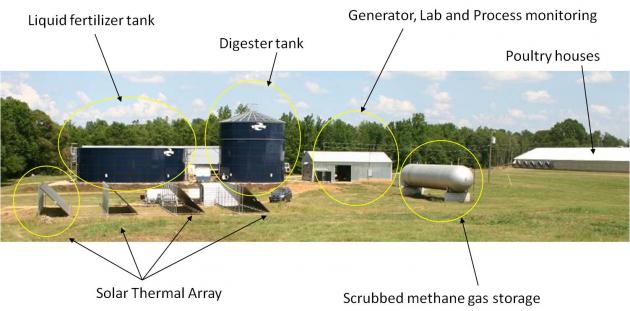
Brinson Farms demonstrates comprehensive utilization of local resources that have historically been viewed as wastes.  These organic materials (broiler litter, yard trimmings, storm damaged trees and waste vegetables) come from both the farm and the community.  Broiler litter and waste vegetables are anaerobically digested to produce methane.  The methane is then used in three ways: 1) to generate electricity for the farm; 2) in boilers to heat water used in the digestion process; and 3) in dual-fuel biomass boilers to heat water for heat exchange in the broiler houses when biomass sources are low. Two other significant products from the digester include liquid fertilizer (approximately 5-2-3) that is sold and residual solids that are incorporated into the farm’s composting facility.  Solar panels assist in heating water for the biomass boilers and the digester. The simple payback period for the on-farm poultry litter digester system is approximately 5 years.

Brinson Farms anaerobic digester complex.

What Have We Learned?

Brinson Farms provides a unique system to ensure long-term farm sustainability in an environmentally beneficial manner. Attributes of the integrated system include: 1) bio-based energy production; 2) reduced utility costs; 3) comprehensive litter utilization; 4) no need to land apply poultry litter; 5) production of high quality, organic liquid fertilizer; 6) production of a marketable soil amendment (compost);  and 7) diverting wastes from landfills.  The farm/community interface is mutually advantageous. The farm uses yard trimmings and trees for energy and as a compost substrate; the community has a free repository to dispose of the biomass, where otherwise it would have to pay landfill fees.

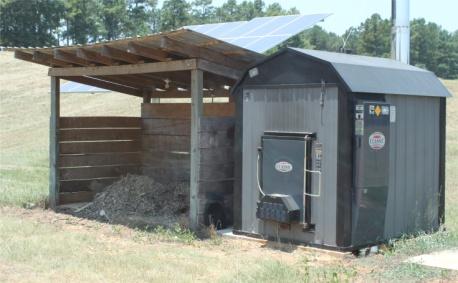
Biomass storage and boiler to heat broiler houses

Future Plans

Future plans include developing economic evaluations for each of the system components so that farmers can choose the renewable energy/value added process(es) that will best fit their local resources as well as short and long term financial plans.

Authors

Dana M. Miles, Chemical Engineer, USDA-ARS Genetics & Precision Agriculture Research Unit, Mississippi State, MS, dana.miles@ars.usda.gov

Additional Information

John Logan: johnlogan1@windstream.net;

Jeff Breeden: jbreeden@egesystems.com;

Eagle Green Energy: http://eaglegreenenergyinc.com/;

Arora, S. 2011. Poultry Manure: The New Frontier for Anaerobic Digestion. http://www.nrcs.usda.gov/Internet/FSE_DOCUMENTS/stelprdb1046769.pdf

Acknowledgements

The assistance of John Logan and Jeff Breeden to effectively describe the Brinson system is greatly appreciated.

The authors are solely responsible for the content of these proceedings. The technical information does not necessarily reflect the official position of the sponsoring agencies or institutions represented by planning committee members, and inclusion and distribution herein does not constitute an endorsement of views expressed by the same. Printed materials included herein are not refereed publications. Citations should appear as follows. EXAMPLE: Authors. 2013. Title of presentation. Waste to Worth: Spreading Science and Solutions. Denver, CO. April 1-5, 2013. URL of this page. Accessed on: today’s date.
The National Air Quality Site-Assessment Tool (NAQSAT)

Waste to Worth: Spreading science and solutions logoWaste to Worth home | More proceedings….

Abstract

The National Air Quality Site Assessment Tool (NAQSAT) has been developed for the voluntary use of livestock producers and their advisors or consultants. It is intended to provide assistance to livestock and poultry producers in determining the areas in their operations where there are opportunities to make changes that result in reduced air emissions. Air emissions research from livestock production systems is increasing every year. NAQSAT is based on the most accurate, credible data currently available regarding mitigation strategies for air emissions of ammonia, methane, volatile organic compounds, hydrogen sulfide, particulates, and odor.

From the NAQSAT home page users may watch a video explaining the tool, read an overview, study the user manual or select a species to start using the program.

Purpose

The National Air Quality Site Assessment Tool (NAQSAT) was developed for livestock producers who are interested in investigating opportunities to reduce air emissions from their livestock operation. The online tool is designed to provide farmers and their advisors air emissions information explicitly for their farm in a confidential setting. The tool may be run from any computer with internet access. All information entered into NAQSAT and the corresponding results remain confidential.

What Did We Do?

NAQSAT considers the air emissions from eight management categories; animal housing, feed and water, manure collection and transfer, manure storage, land application, mortality management, public perception and on-farm roads.

On the NAQSAT Effectiveness Results page the green area indicates the effectiveness of current management practices, the white area indicates the opportunity for improvement. At the end of each session users are encouraged to select “Print My Report” to receive a paper copy of all inputs that had been entered and a copy of the Effectiveness Results page for their records. 

Users of the tool are asked a series of questions under each of the eight management categories. Based on the responses to previously answered questions the program determines what additional questions need to be answered such that only questions pertaining to the operation currently being evaluated are asked. Pop-up pictures assist the user in determining the relative rating to select when questions require a visual evaluation of the existing practices.

NAQSAT addresses seven emissions of concern; odor, particulate matter (dust), ammonia (NH3), hydrogen sulfide (H2S), methane (CH4), volatile organic compounds (VOCs) and nitrous oxide (N2O) under each of the eight management categories. Within the results page the green area in each rectangle indicates the effectiveness of current management practices, the white area indicates the opportunity for improvement.

NAQSAT allows users to save and run different scenarios providing the opportunity to compare the results of implementing new management practices.

It is easy to save NAQSAT sessions and return at a later date to make adjustments or consider additional alternatives. Each “saved” user session of NAQSAT is stored under its own URL available only to the person or persons with access to that URL. Individual URLs remain available for a minimum of 30 days before they are removed from the host computer.

The tool’s results page does not provide emissions data and/or regulatory guidance. It does identify opportunities for reducing air emissions and the ability to evaluate which practices might have the most impact. NAQSAT was developed for voluntary and educational use. The tool is designed to be used by livestock and poultry producers, however, the results may be more valuable when NAQSAT is used in cooperation with agency personnel or private consultants that can provide follow-up with suggestions for mitigation practices.

What Have We Learned?

NAQSAT has been used by members of the tool’s development committee to address odor conflicts in Colorado and in Michigan. In each case the tool confirmed the farm management teams were using acceptable management practices to limit odors from the livestock operation. In both states the local and state agencies involved in the conflict resolution were appreciative of the information provided by the tool.

Authors

Gerald May, Educator, Michigan State University Extension, mayg@msu.edu

Additional Information

The NAQSAT on-line tool is currently available at: http://naqsat.tamu.edu/.  It is available at no cost from its host website (it does not download onto your computer). To assist first time users an overview of the tool, an informative video and a user’s manual are available on the NAQSAT home page.

Archived webinars:

Acknowledgements

Are there any organizations or individuals (besides the authors) that should be acknowledged?

Development of NAQSAT was partially funded by the USDA – NRCS Conservation Innovation Grant program. Over twenty partner organizations and universities contributed to the development of NAQSAT.

Partner universities:  Partner organizations:
Colorado State University C.E. Meadows Endowment
Iowa State University Colorado Livestock Association
Michigan State University Iowa Turkey Federation
Oregon State University Iowa Pork Producers
Penn State University Iowa Pork Industry Center
Purdue University Iowa State Univ. Experiment Station
Texas A&M University Michigan Milk Producers Association
University of California, Davis Michigan Pork Producers Association
University of Georgia Michigan State Univ. Extension
University of Maryland National Pork Board
University of Minnesota Nebraska Environmental Trust
University of Nebraska Western United Dairymen

The authors are solely responsible for the content of these proceedings. The technical information does not necessarily reflect the official position of the sponsoring agencies or institutions represented by planning committee members, and inclusion and distribution herein does not constitute an endorsement of views expressed by the same. Printed materials included herein are not refereed publications. Citations should appear as follows. EXAMPLE: Authors. 2013. Title of presentation. Waste to Worth: Spreading Science and Solutions. Denver, CO. April 1-5, 2013. URL of this page. Accessed on: today’s date.
Developing a Modeling Framework to Characterize Manure Flows in Texas

Waste to Worth: Spreading science and solutions logoWaste to Worth home | More proceedings….

Abstract

In recent years, sharply rising costs of inorganic fertilizers have contributed to an increased demand for manure and compost in crop production acreage, transforming cattle manure from a valueless waste to a viable alternative to commercial fertilizer. If additional demand for manure as a bio-fuel were to arise manure could take on two distinct values, a fertilizer value and a fuel value. This potential “dual” value of manure begs several questions. What would the fertilizer and fuel markets of manure look like? Is there enough manure supply for the markets to operate independently? If not, which market would prevail? In essence, how, if at all, would manure’s potential value as a bio-fuel distort the traditional Panhandle manure market? A modeling framework was developed to assess the potential impacts of a manure-fired ethanol plant on the existing Texas Panhandle manure fertilizer market.  Two manure-allocation runs were performed using a spreadsheet model. Run #1 allocated all available manure from dairies and feedlots to cropland as manure fertilizer; run #2 first allocated fuel manure to the ethanol plant and then allocated the remaining manure to cropland. Both model runs assumed a time horizon of one year and no antecedent nutrients in cropland soils. Other constraints included only irrigated acreages received manure and no supplemental fertilizer was used. The model revealed a 6.4% increase in cost per acre of fertilizing with manure for fields whose nutrient requirements were fully satisfied in both runs. The increase in cost per acre was likely due to an increase in hauling distances attributed to fewer CAFOs available for fertilizer manure. The model is not presented as a dynamic, systems model, but rather a static model with the potential to be incorporated into a more dynamic systems-based modeling environment. Suggestions for further model development and expansion including GAMS integration are presented.

Why Model Manure Transport and Use?

To demonstrate the potential for systems modeling to characterize manure flows in response to fertilizer prices,  biofuel demand, and other externalities in the Texas Panhandle

Conceptual model diagram.

What Did We Do?

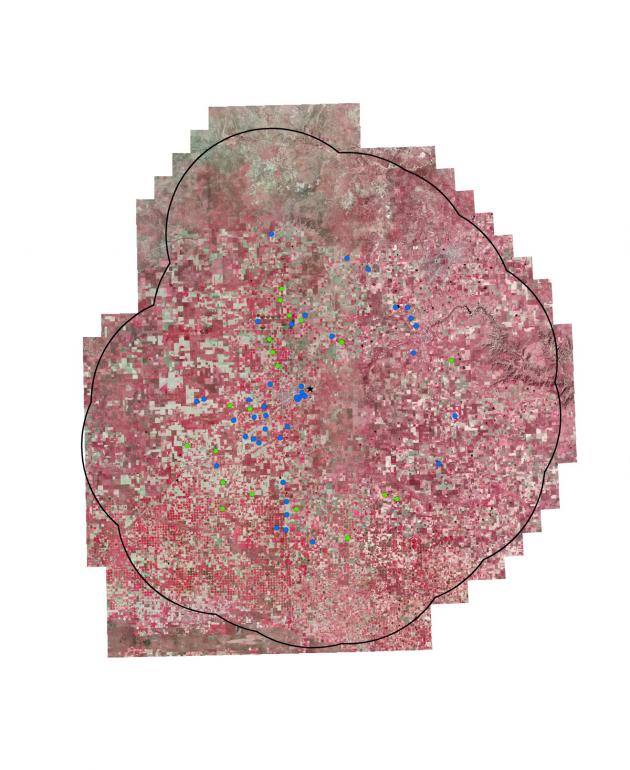
We develeloped a spreadsheet based modeling framework to evaluate how both manure use and transport might be affected by regional changes in fertilizer prices, crop composition, and biofuel demand.  Specifically, we evaluated how traditional fertilizer valued manure flows might be affected by potential biofuel based flows stemming from a proposed manure-fired ethanol plant.  Two model simulations representing manure flows with and without biofuel manure demand from the proposed plant were performed.

Explicit model boundary shown with TNRIS satellite imagery used to locate and identify center pivot irrigated fields.

What Have We Learned?

Although the cattle industry in Texas Panhandle generates a substantial volume of manure, almost all of it is land applied as fertilizer.  However, the introduction of manure-fired facilities such as the proposed ethanol plant would undoubtedly change the dynamics of the existing manure market by introducing at least additional demand, if not a second value-based market.  Assuming only transportation costs of acquiring manure for biofuel, our model simulations suggested a 6.4% increase in cost per acre for lands whose manure requirements were fully satisfied in both simulations.  Assuming that manure for biofuel received an allocation preference for proximity to the plant, we propose that costs associated with having to transport manure over longer distances significantly contributes the the increased cost per acre for fertilized lands.

In terms of what we learned about systems modeling, we have experienced (although anticipated) that translating broad, systems based conceptual modeling ideas into an explicit, user friendly, and robust modeling interface can be extremely challenging. Although systems-based modeling efforts occur largely at a macro level, they often require extensive supplemental datasets.  We have experienced difficulty in identifying software packages that are equipped to adequately handle both aspects of systems modeling.

Future Plans

We plan to continue to develop and expand the current modeling framework by incorporating  a GIS-based water availability aquifer component, expanding the current crop-composition database, and providing logic algorithms for producer-based management decisions using GAMS (General Algebraic Modeling System) optimization modeling.

Manure allocation map for model run #1 (232 LMU cells allocated).

Authors

Brent Auvermann, Professor of Biological and Agricultural Engineering, Texas A&M AgriLife Research, b-auvermann@tamu.edu

Gary Marek, Postdoctoral Research Associate, Texas A&M AgriLife Research; Brent W. Auvermann, Professor of Biological and Agricultural Engineering, Texas A&M AgriLife Research; Kevin Heflin, Extension Associate, Texas A&M AgriLife Extension

Additional Information

Please contact Gary Marek, Postdoctoral Research Associate, Texas A&M AgriLife Research, 6500 Amarillo Boulevard West, Amarillo TX, 79106, Phone: 806-677-5600, Email: gwmarek@ag.tamu.edu or  Brent W. Auvermann, Professor of Biological and Agricultural Engineering, Texas A&M AgriLife Research, 6500 Amarillo Boulevard West, Amarillo TX, 79106, Phone: 806-677-5600, Email: b-auvermann@tamu.edu.

Acknowledgements

Special thanks to Dr. Raghavan Srinivasan and David Shoemate of the Texas A&M University Department of Ecosystem Science and Management Spacial Sciences Laboratory for their help in GIS processing scripts.

The authors are solely responsible for the content of these proceedings. The technical information does not necessarily reflect the official position of the sponsoring agencies or institutions represented by planning committee members, and inclusion and distribution herein does not constitute an endorsement of views expressed by the same. Printed materials included herein are not refereed publications. Citations should appear as follows. EXAMPLE: Authors. 2013. Title of presentation. Waste to Worth: Spreading Science and Solutions. Denver, CO. April 1-5, 2013. URL of this page. Accessed on: today’s date.

Diet, Tillage and Soil Moisture Effects on Odorous Emissions Following Land Application of Beef Manure


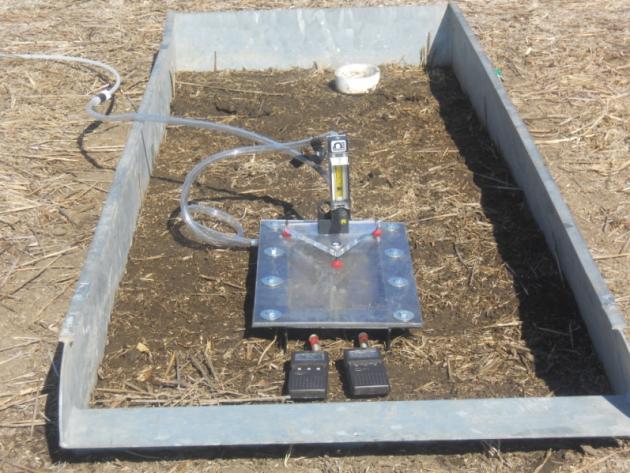
Figure1.  Gas sampling equipment used during the study.

Waste to Worth: Spreading science and solutions logoWaste to Worth home | More proceedings….

Abstract

Little information is currently available concerning odor emissions following land application of beef cattle manure. This study was conducted to measure the effects of diet, tillage, and time following land application of beef cattle manure on the emission of volatile organic compounds (VOC).

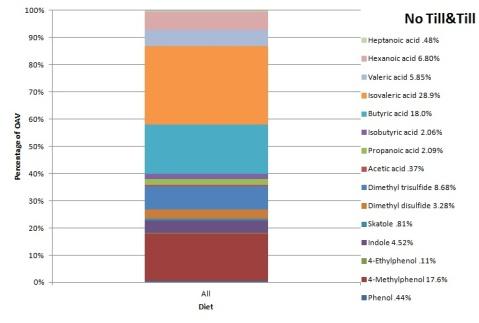
Each of the experimental treatments which included tillage (broadcast or disked) and diet (0, 10, or 30% wet distillers grain (WDGS)) were replicated twice. A 5-m tandem finishing disc was used to incorporate the manure to a depth of approximately 8 cm.  Small plots (0.75 m x 2.0 m) were constructed using 20 cm-wide sheet metal frames. A flux chamber was used to obtain air samples within the small plots at 0, 1, 2, 6, and 23 hours following manure application. The flux of fifteen VOC including fatty acids, aromatic compounds, and sulfur containing compounds were measured. Based on odor threshold, isolavleric acid, butyric acid, and 4-methylphenol provided 28.9%, 18.0%, and 17.7%, respectively, of the total measured odor activity. Heptanic acid, acetic acid, skatole, 4-methyphenol, and phenol each contributed less than 1% of the total odor activity. Dimethy disulfide (DMDS) and dimethyl trisulfide were the only measured constituents that were significantly influenced by diet.

DMDS values were significantly greater for the manure derived from the 30% WDGS diet than the other manure sources. No significant differences in DMDS values were found for manure derived from diets containing 0% and 10% WDGS. Tillage did not significantly affect any of the measured VOC compounds. Each of the VOC was significantly influenced by the length of time that had expired following land application. In general, the smallest VOC measurements were obtained at the 23 hour sampling interval.  Diet, tillage, and time following application should each be considered when estimating VOC emissions following land application of beef cattle manure.

Why Study Factors Affecting Manure Application Odors?

Measure the effects of diet, tillage and soil moisture on odor emissions follow land applied beef manure.

Figure 2.  Relative contribution of odorant to the total odor activity.

What Did We Do?

Twelve plots were established across a hill slope. Treatments were tillage (broadcast or disked) and diet (0%, 10%, or 30% WDGS).  Beef manure was applied at 151 kg N ha-1 yr-1.  Gas samples were collected using small wind tunnels and analyzed using a TD-GC-MS. (Fig. 1).  VOC samples were collected at 0, 1, 2, 6, and 23 hours following manure application.  A single application of water was applied and the gas measurement procedure was repeated. The effects of tillage, diet, test interval, and the sample collection time on VOC measurements were determined using ANOVA (SAS Institute, 2011).

What Have We Learned?

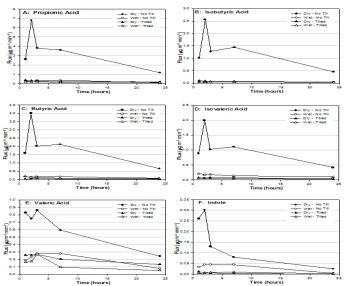
Isovaleric acid, butyric acid, and 4-methylphenol accounted for 28.9%, 18.0%, and 17.7%, respectively of the total odor activity (Fig. 2). Dimethyl disulfide (DMDS) and dimethyl trisulfide (DMTS) emissions were significantly increased by the 30 % WDGS diet. The flux increase for DMDS was over 4 times greater for the 30% WDGS diets. Tillage did not significantly affect any of the measured VOC compounds. The largest propionic, isobutric, butyric, isovaleric, and valeric acid measurements occurred with no-tillage under dry condition (Fig. 3A-E). Generally, measured values for these constituents were significantly greater at the 0, 1, 2, and 6 hour sampling intervals than at the 23 hour interval (Fig. 3A-E). The larger emissions for no-till, dry conditions may be due to the drying effect resulting when the manure was broadcast on the surface.  As the manure begins to dry, the water soluble VOCs are released from solution.  The tilled and wet conditions would reduce its release of VOC due to the increased moisture conditions.

Figure 3. Flux values for propionic, isobutyric, butyric, isovaleric , valeric acid and indole as affected by tillage, soil moisture, and time.

Future Plans

Additional studies are planned to quantify the moisture and temperature effect on odorous emissions.

Authors

Bryan L. Woodbury, Research Agricultural Engineer, USDA-ARS,  bryan.woodbury@ars.usda.gov

John E. Gilley, Research Agricultural Engineer, USDA-ARS;

David B. Parker, Professor and Director, Commercial Core Laboratory, West Texas A&M University;

David B. Marx, Professor Statistics, University of Nebraska-Lincoln;

Roger A. Eigenberg, Research Agricultural Engineer, USDA-ARS

Additional Information

http://www.ars.usda.gov/Main/docs.htm?docid=2538

Acknowledgements

We would like to thank Todd Boman, Sue Wise, Charlie Hinds and Zach Wacker for their invaluable help on making this project a success.

The authors are solely responsible for the content of these proceedings. The technical information does not necessarily reflect the official position of the sponsoring agencies or institutions represented by planning committee members, and inclusion and distribution herein does not constitute an endorsement of views expressed by the same. Printed materials included herein are not refereed publications. Citations should appear as follows. EXAMPLE: Authors. 2013. Title of presentation. Waste to Worth: Spreading Science and Solutions. Denver, CO. April 1-5, 2013. URL of this page. Accessed on: today’s date.

Impacts of the Michigan Agriculture Environmental Assurance Program

Waste to Worth: Spreading science and solutions logoWaste to Worth home | More proceedings….

Abstract

The Michigan Agriculture Environmental Assurance Program (MAEAP) is a holistic approach to environmental protection. It helps farmers evaluate their entire operation, regardless of size or commodity, and make sustainable management decisions balancing society’s needs, the environment, and economics. MAEAP is a partnership effort that aims to protect natural resources and build positive communities by working with farmers on environmentally responsible agricultural production practices.

To become MAEAP verified, farmers must complete three comprehensive steps: educational seminars, an on-farm risk assessment, and development and implementation of an action plan addressing potential environmental risks. The Michigan Department of Agriculture and Rural Development (MDARD) conducts an on-farm inspection to verify program requirements related to applicable state and federal environmental regulations, including the Generally Accepted Agricultural and Management Practices (GAAMPs). MAEAP benefits Michigan by helping to protect the Great Lakes by using proven scientific standards to improve air, water, and soil quality. Annual phosphorus reduction through MAEAP is over 340,451 pounds per year which is enough to grow almost 85,104 tons of algae in lakes and streams.  Farming is an environmentally intense practice and the MAEAP-verification process ensures farmers are making choices that balance production and environmental demands. The measures aimed at protecting air, soil, water, and other environmental factors mean that MAEAP-verified farmers are committed to utilizing farming practices that protect Michigan’s natural resources.

Purpose

The Michigan Agriculture Environmental Assurance Program (MAEAP) is an innovative, proactive program that assists farms of all sizes and all commodities voluntarily prevent or minimize agricultural pollution risks. MAEAP is a collaborative effort of farmers, Michigan Department of Agriculture and Rural Development, Michigan Farm Bureau, commodity organizations, universities, conservation districts, conservation groups and state and federal agencies. MAEAP teaches farmers how to identify and prevent environmental risks and work to comply with state and federal environmental regulations. Farmers who successfully complete the three phases of a MAEAP system (Farmstead, Cropping or Livestock) are rewarded by becoming verified in that system.

What Did We Do?

To become MAEAP-verified, farmers must complete three comprehensive steps: educational seminars, a thorough on-farm risk assessment, and development and implementation of an action plan addressing potential environmental risks. The Michigan Department of Agriculture and Rural Development (MDARD) conducts an on-farm inspection to verify program requirements related to applicable state and federal environmental regulations, including the Generally Accepted Agricultural Management Practices. To retain MAEAP verification, a farm must repeat all three steps including MDARD inspection every three years.

Local MAEAP farm verified in the Cropping System

What Have We Learned?

The MAEAP program is positively influencing Michigan producers and the agriculture industry. Annually, an average of 5,000 Michigan farmers attend an educational session geared toward environmental stewardship and MAEAP verification. To date, over 10,000 farms are participating with over 1,500 MAEAP verifications. On a yearly basis, over $1.2 million is spent for practice implementation by producers working towards MAEAP verification. In 2012; the sediment reduced on MAEAP-verified farms could have filled 28,642 dump trucks (10 yards each), the phosphorus reduced on MAEAP farms could have grown 138,056 tons of algae in surface waters, and the nitrogen reduced on MAEAP farms could have grown 45,515 tons of algae in surface waters.

An example of the partnership between MAEAP and Michigan Farm Bureau

Future Plans

Michigan Governor Rick Snyder has taken a vested interest in the value of the MAEAP program. In March of 2011, Governor Snyder signed Public Acts 1 and 2 which codify MAEAP into law. This provides incentives and structure for the MAEAP program. It is a goal of Governor Snyder’s to have 5,000 farms MAEAP-verified by 2015. Most importantly, through forward thinking MAEAP strives to connect farms and communities, ensure emergency preparedness and protect natural resources.

Authors

Jan Wilford, Program Manager, Michigan Department of Agriculture & Rural Development – Environmental Stewardship Division,    wilfordj9@michigan.gov

Shelby Bollwahn, MAEAP Technician – Hillsdale Conservation District

shelby.bollwahn@mi.nacdnet.net

Additional Information

www.maeap.org – MAEAP Website

http://michigan.gov/mdard/0,4610,7-125-1567_1599_25432—,00.html – MDARD MAEAP Website

http://www.facebook.com/mimaeap – MAEAP Facebook Page

Acknowledgements

MDARD MAEAP Program Office Communications Department

Michigan Farm Bureau

Michigan Association of Conservation Districts

Hillsdale County Farm Bureau

Hillsdale Conservation District

Handout version of the poster (8.5 x 11; pdf format)

The authors are solely responsible for the content of these proceedings. The technical information does not necessarily reflect the official position of the sponsoring agencies or institutions represented by planning committee members, and inclusion and distribution herein does not constitute an endorsement of views expressed by the same. Printed materials included herein are not refereed publications. Citations should appear as follows. EXAMPLE: Authors. 2013. Title of presentation. Waste to Worth: Spreading Science and Solutions. Denver, CO. April 1-5, 2013. URL of this page. Accessed on: today’s date.

Estimation of Ammonia Emissions from Beef Cattle Feedyards in the Southern High Plains with Process-Based Models

Waste to Worth home | More proceedings….

Why Is It Important to Validate Models?

Beef cattle are responsible for around 15% of the total anthropogenic ammonia (NH3) emitted in the U.S., and the cattle feeding industry is highly concentrated spatially, with the majority of commercial feedyards located in Texas, Iowa, Kansas,Colorado, and Nebraska (USEPA, 2005; USDA-NASS, 2009). Valid estimates of ammonia (NH3) emissions from beef cattle feedyards are needed to assess the impact of beef production on the environment, to comply with reporting requirements, and to develop reasonable regulatory policies. The processes involved in production and volatilization of NH3 from livestock housing are strongly influenced by environmental conditions and management practices (Fig. 1), which may not be captured by constant emission factors or mathematically-derived empirical models. Among different modeling approaches, process-based models, which track components of interest through biochemical and geochemical reactions as functions of specific conditions (e.g. temperature, wind speed, pH, precipitation, surface heating, animal diet), offer a better approach for predicting NH3 emissions from open-lot animal production systems than emission factors or empirical models. However, while process-based models have been developed to estimate NH3 emissions from dairy barns and other livestock facilities, little work has been conducted to assess their accuracy for large, commercial feedyards in the semi-arid Texas High Plains: the top beef producing region in the United States.

Figure 1. Processes and factors affecting feedyard ammonia emissions and modeled with IFSM and Manure-DNDC.

What Did We Do?

We evaluated two process-based models, the Integrated Farm Systems Model (IFSM) (Rotz et al., 2012) and the newly developed Manure-DNDC (DeNitrification DeComposition) model (Li et al., 2012), for predicting feedyard NH3 emissions in the Texas High Plains. To meet this objective, we compared model-simulated emissions to measured NH3 flux data collected from two commercial feedyards, Feedyard A and Feedyard E, in Deaf Smith County, Texas. Feedyard NH3 fluxes were measured from February 2007 to January 2009 using open-path lasers and an inverse dispersion model (Todd et al., 2011). The input data for the two models differed slightly; however, both required daily climate data (temperature, precipitation, wind speed, solar radiation), animal population (Feedyard A, 12,684 head; Feedyard E, 19,620 head), and concentration of crude protein (%CP) in cattle diets. Model performance was evaluated by the difference between predicted and observed emissions using both linear regression analysis and summary, univariate, and difference measures (Wilmott et al., 1982).

Figure 2 (above). Comparison of observed and IFSM predicted per capita NH3 emission rates (g head-1 d-1) at (a) Feedyard A, and (b) Feedyard E. Daily predictions were in good agreement (p < 0.001) with observations at both feedyards and responded appropriately to changes in ambient temperature and % CP in feedyard diets.
Figure 3 (below). Comparison of observed and Manure-DNDC predicted NH3 emission rates (kg ha-1 d-1) at (a) Feedyard A, and (b) Feedyard E. The units for Manure-DNDC (kg hectare-1 d-1) differ from IFSM (g head-1 d-1); however, daily Manure-DNDC predictions for 2008 agreed with observations (p < 0.001) in a manner similar to IFSM predictions.

What Have We Learned?

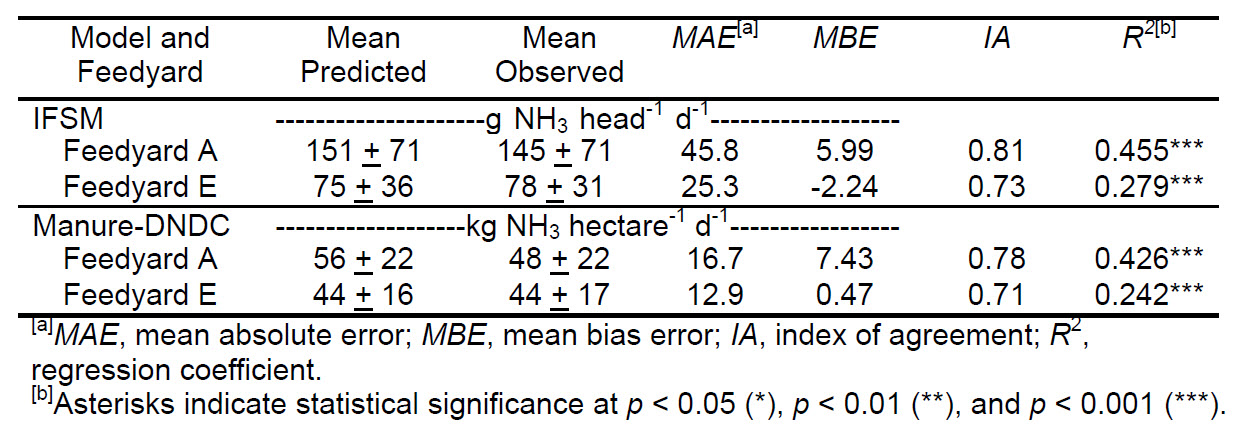
Predictions of daily NH3 emissions made by IFSM and Manure-DNDC were in good agreement (p < 0.001) with observations at both feedyards (Figs. 2 and 3, Table 1). IFSM predicted average NH3 fluxes of 151 and 75 g head-1 d-1 for Feedyards A and E, respectively (Table 1). Manure-DNDC output is on an area basis, and average modeled NH3 fluxes were 56 (Feedyard A) and 44 kg hectare-1 d-1 (Feedyard E). In addition, both models responded appropriately to changes in ambient temperature and %CP in feedyard diets, as shown by higher emissions in summer than winter, and the period of February to October 2008 at Feedyard A, when diets contained as much as 19% CP due to the inclusion of distillers grains (Figs. 2 and 3). The index of agreement (IA) indicates 71% to 81% agreement between model predictions and observed emissions (Table 1). Overall, both IFSM and Manure-DNDC predictions for Feedyard E had lower values for error and bias (MAE and MBE), while there was better agreement between observations and model predictions for NH3 emissions for Feedyard A.

</a>
Figure 4. Comparison of mean predicted and observed per capita NH3 emission rates from (a) Feedyard A and (b) Feedyard E in 2008. For most months, model predictions did not differ from observations, indicating that both models were useful for predicting average feedyard NH3 emissions.

Comparisons of modeled and observed mean daily per capita NH3 emissions for each month in 2008 are shown in Figure 4. For most months, model predictions did not differ significantly from observations, indicating that both models were useful for predicting average emissions. We also wanted to compare model predictions for annual per capita NH3 emissions to the emission factor of 13 kg head-1 y-1 that is currently used by the USEPA (USEPA, 2005). For 2008, IFSM and Manure-DNDC estimates of annual per capita emissions were 61 and 55 kg head-1 y-1 (Feedyard A) and 33 and 25 kg head-1 y-1 (Feedyard E), and model estimates for total feedyard emissions were within 3% to 24% of measured values (Table 2). In contrast, the current EPA emission factor underestimated total feedyard emissions by 61% to 79%: indicating that predictions by IFSM and Manure-DNDC can more accurately predict feedyard NH3 emissions than current constant emission factors.

Table 1. Regression and mean difference comparisons for observed and predicted daily feedyard NH3 emissions from Feb. 2007 to Jan. 2009, where there were 386 and 272 paired comparisons for Feedyard A and Feedyard E, respectively. Regression analysis indicated a highly significant (p < 0.001) relationship between observations and predictions made by both models. The index of agreement (IA) indicates 71% to 81% agreement between model predictions and observed emissions. Overall, both IFSM and Manure-DNDC model predictions for Feedyard E had lower values for error and bias (MAE and MBE), while there was better agreement between observations and model predictions for NH3 emissions for Feedyard A.
Table 2. Comparison of observed annual emissions at Feedyards A and E in 2008 with predictions by Manure-DNDC, IFSM, and the USEPA emission factor (EF) for beef cattle. For 2008, IFSM and Manure-DNDC estimates were within 3% to 24% accuracy. In contrast, the current EPA emission factor underestimated emissions by as much as 79%.

Future Plans

Future plans include using process-based models to predict nitrous oxide (N2O) emissions from feedyard pen surfaces. In addition, we will conduct laboratory and field-scale studies to better characterize the chemical and physical properties of feedyard manure in order to refine input parameters and improve model predictions of feedyard NH3 and N2O emissions.

Authors

Heidi M. Waldrip, Research Soil Scientist, USDA-ARS Conservation and Production Laboratory, Bushland, TX, heidi.waldrip@ars.usda.gov

C. Alan Rotz, Agricultural Engineer, USDA-ARS Pasture Systems and Watershed Management Research Unit, University Park, PA.

Changsheng Li, Research Professor, Institute for the Study of Earth, Oceans, and Space, University of New Hampshire, Durham, NH.

Richard W. Todd, Soil Scientist, USDA-ARS Conservation and Production Laboratory, Bushland, TX.

William Salas, President and Chief Scientist, Applied Geosolutions, LLC, Durham, NH.

N. Andy Cole, Research Leader and Animal Scientist, USDA-ARS Conservation and Production Laboratory, Bushland, TX.

Additional Information

Li, C., W. Salas, R. Zhang, C. Krauter, A. Rotz, and F. Mitloehner. 2012. Manure-DNDC: a biogeochemical process model for quantifying greenhouse gas and ammonia emissions from livestock manure systems. Nutr. Cycl. Agroecosyst. 93:163-200.

Rotz, C.A., M.S. Corson, D.S. Chianese, F. Montes, S.D. Hafner, R. Jarvis, and C.U. Coiner. 2012. Integrated Farm System Model: Reference Manual. University Park, PA: USDA Agricultural Research Service. Available at: http://www.ars.usda.gov/Main/docs.htm?docid=21345. Accessed 5 January 2013.

Todd, R. W., N. A. Cole, M. B. Rhoades, D. B. Parker, and K. D. Casey. 2011. Daily, monthly, seasonal, and annual ammonia emissions from Southern High Plains cattle feedyards. J. Environ. Qual. 40:1090-1095.

USDA-NASS, 2009. Cattle and calves: total number on feed by state and United States, January 1, 2004-2008. Cattle Final Estimates 2004-2008. Statistical Bulletin No. 1019. National Agricultural Statistics Service, Washington DC. Available at: http://usda.mannlib.cornell.edu/MannUsda/viewDocumentInfo.do;jsessionid=E329A9AE615645F1319CC8FB6B111CA8?documentID=1523. Accessed 03/01/2013.

USEPA. 2005. National Emission Inventory – Ammonia Emissions from Animal Agricultural Operations: Revised Draft Report. 2005 Apr. 22. United States Environmental Protection Agency, Washington DC. Available at: http://www.epa.gov/ttnchie1/net/2002inventory.html. Accessed 02/27/2013.

Wilmott, C. J. 1982. Comments on the evaluation of model performance. Bull. Am. Meterol. Soc. 63:1309-1313.

USDA-ARS Conservation and Production Laboratory: https://www.ars.usda.gov/plains-area/bushland-tx/cprl/

USDA-ARS Pasture Systems and Watershed Management Research Unit/IFSM download: http://www.ars.usda.gov/main/site_main.htm?modecode=19-02-00-00

Applied Geosolutions: http://www.appliedgeosolutions.com/

Acknowledgements

This project was partially supported by USDA-NIFA funding to Texas A&M AgriLife Research for the federal special grant project TS2006-06009, “Air Quality: Reducing Emissions from Cattle Feedlots and Dairies (TX & KS)”.

The authors are solely responsible for the content of these proceedings. The technical information does not necessarily reflect the official position of the sponsoring agencies or institutions represented by planning committee members, and inclusion and distribution herein does not constitute an endorsement of views expressed by the same. Printed materials included herein are not refereed publications. Citations should appear as follows. EXAMPLE: Authors. 2013. Title of presentation. Waste to Worth: Spreading Science and Solutions. Denver, CO. April 1-5, 2013. URL of this page. Accessed on: today’s date.