Assessment of Coordinated Anaerobic Digestion of Dairy Manure


Proceedings Home | W2W Home w2w17 logo

Purpose            

Improving the economic feasibility of anaerobic digestion projects for processing dairy manure.

What did we do? 

We completed a study that evaluated the economics of dairy manure granulation as means to export phosphorus from P-sensitive watersheds. To achieve this goal we developed a techno-economic optimization model that considers all dairy farms within the watershed simultaneously to determine the minimum break-even price for the granulated manure.

A second study was developed to assess the economics of anaerobic digestion using a techno-economic optimization model. We incorporated different revenue sources (power sale, methane destruction credits, renewable energy certificates (RECs) and tipping fee (if co-substrate is available). The model evaluated the project feasibility over ranges of values for technical and economic parameters to quantify the project resilience to uncertainty in process conditions.

What have we learned? 

The results from the first study indicated that multi-farm participation can significantly improve feasibility and overall economics of manure granulation. Herd sizes were found to be a critical parameter in deciding whether a farm can economically participate in coordinated management. For manure granulation projects, liquid-solid separation followed by transportation of separated solids was always more economical than transporting raw manure from satellite farm to central processing facility. In the second study, electricity sale price was found to be the key parameter that determines the feasibility of anaerobic digesters. The hub-spoke configuration, where a large central farm hosts the digester and smaller surrounding farms contribute to it was found to be the most favorable arrangement. The size of the hub farm was critical to the feasibility of the project. Similarly, transportation distance was a critical factor that constrained the extent of cooperative digesters.

Future Plans    

The information generated from these studies is being written into peer-review publications and factsheets to share insights of collaborative manure management with a wider audience.We are currently expanding the model by adding the option for manure transportation via pipelines. Furthermore, we are also incorporating additional biogas utilization technologies,i.e., natural gas sale over pipelines and also the utilization of power/heat on-site in manure upgrading and processing.

Corresponding author, title, and affiliation        

Troy M. Runge, Associate Professor, University of Wisconsin-Madison

Corresponding author email    

trunge@wisc.edu

Other authors   

Mahmoud A. Sharara, Rebecca Larson

Additional information

1. http://www.are.wisc.edu/

2. Sharara, Mahmoud, Apoorva Sampat, Laura W. Good, Amanda S. Smith, Pamela Porter, Victor M. Zavala, Rebecca Larson, and Troy Runge. “Spatially explicit methodology for coordinated manure management in shared watersheds.” Journal of Environmental Management 192 (2017): 48-56.

3. Sharara, Mahmoud, Qiang Yang, Thomas L. Cox, and Troy Runge. “Techno-economic assessment of dairy manure granulation.” In 2016 ASABE Annual International Meeting, p. 1. American Society of Agricultural and Biological Engineers, 2016.

Acknowledgements       

This work is based on research supported by the USDA National Institute of Food and Agriculture for its financial support (USDANIFABRDI Grant No. 2012-10006-19423) and funding from Dane County, Wisconsin under Award Number 12486.

A Quantitative Assessment of Beneficial Management Practices to Reduce Carbon and Reactive Nitrogen Footprints of Dairy Farms in the Great Lakes Region

w2w17 LogoProceedings Home | W2W Home 

Purpose 

Assessing and improving the sustainability of dairy production is essential to secure future food production. Implementation of Beneficial Management Practices (BMPs) can reduce carbon and reactive nitrogen footprints of dairy farms. BMPs can and have been developed for different farm components, including feed, manure management and field cultivation practices. It is practically and economically infeasible to empirically test all combinations of BMPs at a whole farm scale. We therefore use whole-farm process-based models to assess the impact of several Beneficial Management Practices (BMPs) on carbon and reactive nitrogen footprints of dairy farms in the Great Lakes region. Specifically the aim of this study is to evaluate the influence of Beneficial Management Practices (BMPs) on carbon, reactive nitrogen and phosphorus footprints of dairy farms in the Great Lakes region.

What did we do? 

1. Baseline farms

We developed two baseline model farms, a small 150 cow herd farm and a large 1500 cow herd farm, that are thought to be representative for current dairy farming practices in the Great Lakes region, particularly Wisconsin and New York State (Table 1). The two baseline dairy farms were developed based on individual team members’ expertise and a consultation with external experts (Dane County Conservationists, Madison, Wisconsin). For the 1500 cow farm, the baseline scenario was partly based on a previously-studied commercial dairy farm in NY state. Since this commercial dairy farm already employs some BMPs (e.g. anaerobic digestion as BMP in manure management), the farm was ‘downgraded’ to derive the baseline.

Table 1. Description of the baseline farms

2. Beneficial Management Practices

Farm-specific BMPs were developed for three farm components, i.e. “Feed”, “Manure Management & Storage” and “Field management”. These BMPS were developed based on expert judgement and are expected or known to reduce whole-farm GWPs.

To ensure a meaningful integration of BMPs and a consistent comparison of whole-farm BMPs to the baseline and to each other, we used the following set of rules (per farm type): i) Total cultivated area was fixed (areas of individual crops can vary per scenario); ii) Herd size was fixed; iii) Milk production was allowed to float, however, only if the production increased (no decreases in milk production); iv) Purchases of crops and protein mixes were minimized as far as possible.

Table 2. Individual BMPs for the 1500 and 150 cow farm

3. Process model simulation

The Integrated Farm System Model (IFSM4.3) was used to simulate the two baseline farms (i.e. 1500 cow farm in NY and 150 cow farm in WI) and all the individual BMPs. IFSM was used as a baseline model. The other process-based models, that is DNDC, APEX and CNCPS, were used to check IFSM predictions.

4.Whole-farm mitigation strategy

The individual BMPs were analyzed in terms of potential reduction in carbon and reactive nitrogen footprint. The best performing individual BMPs were combined into a whole-farm mitigation strategy and this whole-farm mitigation strategy was subsequently modeled in IFSM.

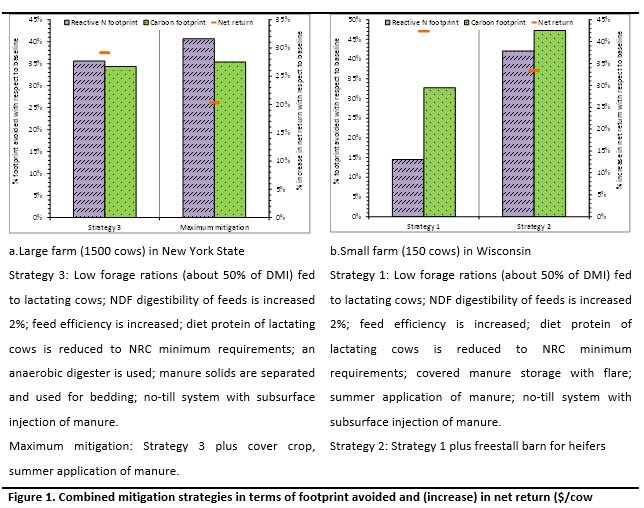
Figure 1. Combined mitigation strategies in terms of footprint avoided and (increase) in net return ($/cow

What have we learned? 

A comparison of model simulations of feed BMPs to the baseline shows that an integrated feed BMP (low forage, corn silage:alfalfa 3:1, ~2% NDF digestibility, reduced protein 14%, added fat, increased feed efficiency) can potentially reduce carbon and reactive nitrogen footprints with ~20% and ~24%, respectively, while remaining cost effective (18% increase in net return in $/cow), for both farm sizes.

For the small farm, replacing the bedded-pack barn with a free stall barn for the heifers, substantially reduces the carbon and the reactive nitrogen footprint with 12% and 11%, respectively. The manure management BMP ‘sealed with flare’ provides the largest potential reduction in carbon footprint for both farms (11% – 20%), primarily through a mitigation of CH4 emissions from manure storage.

Field management BMPs only provide a minimal reduction in carbon footprint (~3%), however, the field BMP ‘no-till with injection’ substantially reduces the reactive N footprint (~16%) for both farm sizes. This reduction is primarily achieved by a reduction in ammonia volatilization.

Based on the results for the individual BMPs, two combined whole-farm mitigation strategies were developed per farm and simulated in IFSM (Figure 1). For both the large farm and the small farm, the integrated whole-farm BMPs show an overall potential to reduce carbon and reactive nitrogen footprints with 33% to 37% and 15% to 42% respectively, simultaneously increasing milk production and the net return per cow with 10% to 12% and 20% to 42%, respectively.

This analysis suggests that BMPs can be applied to reduce greenhouse gas emissions and reactive nitrogen losses without sacrificing productivity or profit to the farmer.

Future Plans    

Future research plans include a further comparison and analysis of IFSM predictions with predictions from other process models, including CNCPS, APEX, and ManureDNDC. In addition, we will assess the impact of climate change on the reactive nitrogen and carbon footprint of the baseline farms and the developed whole-farm mitigation strategies.

Corresponding author, title, and affiliation         

Karin Veltman, PhD, University of Michigan, Ann Arbor

Corresponding author email    

veltmank@umich.edu

Other authors   

Alan Rotz, Joyce Cooper, Larry Chase, Richard Gaillard, Pete Ingraham, R. César Izaurralde, Curtis D. Jones, William Salas, Nick Stoddart, Greg Thoma, Peter Vadas, Olivier Jolliet

Additional information                

Veltman et al. (2017) Comparison of process-based models to quantify nutrient flows and greenhouse gas emissions associated with milk production. Agricultural Ecosystems and Environment, 237, 31–44

DairyCAP project, www.sustainabledairy.org, aims to reduce the life cycle environmental impact of dairy production systems in the US.

Acknowledgements       

This material is based upon work that is supported by the National Institute of Food and Agriculture, U.S. Department of Agriculture, under award number 2013-68002-20525. Any opinions, findings, conclusions, or recommendations expressed in this publication are those of the author(s) and do not necessarily reflect the view of the U.S. Department of Agriculture.

The authors are solely responsible for the content of these proceedings. The technical information does not necessarily reflect the official position of the sponsoring agencies or institutions represented by planning committee members, and inclusion and distribution herein does not constitute an endorsement of views expressed by the same. Printed materials included herein are not refereed publications. Citations should appear as follows. EXAMPLE: Authors. 2017. Title of presentation. Waste to Worth: Spreading Science and Solutions. Cary, NC. April 18-21, 2017. URL of this page. Accessed on: today’s date.

Manure Treatment and Natural Inactivation of Porcine Epidemic Diarrhea Virus in Soils

Proceedings Home | W2W Home w2w17 logo

Purpose

The porcine epidemic diarrhea virus (PEDv) outbreak in North America has substantially impacted swine production, causing nearly 100% mortality in infected newborn piglets. Because manure may remain a source of reinfection, proper manure management practices to limit outbreaks need to be developed and evaluated. Two laboratory studies simulating manure pit treatment with increasing amounts of quicklime were conducted to determine PEDv susceptibility to increasing pH. Additionally, two laboratory soil incubation studies contrasting manure liming, multiple soil types, and two antecedent soil moistures were conducted over several months with incubation conditions mimicking the climates in Minnesota, Missouri, and Oklahoma to determine whether current manure application practices reduce the potential for PEDv reinfection via manure-amended soil. Quantitative PCR and live swine bioassays were used to enumerate PED virus and to determine whether manure and soil samples contained infectious PEDv.

What did we do?

Quicklime-Manure Slurry Incubations: An initial short-term manure slurry study was conducted on fresh PEDv-positive manure slurry collected in 2015 from the shallow pit of a commercial swine facility in southeast Nebraska. Manure was sampled prior to treatment (0 h) and then distributed among glass beakers (250 mL) to accommodate triplicates of three treatments: liming to pH 10, liming to pH 12, and unlimed manure. Following pH adjustment, aliquots of each sample were collected at 1 and 10 h, immediately neutralized with 10 mM HCl and stored at -80°C for subsequent analysis. In a second manure slurry incubation, triplicate PEDv-positive manure samples collected from a commercial swine operation in south central Nebraska site in December 2016 were mixed in equal portion (w:v) with distilled water to mimic manure slurry consistency observed in swine production pit storages. Quicklime was added stepwise (0.25 g addition) to each manure slurr! y sample with continuous stirring to gradually increase manure slurry pH. After each addition of quicklime, pH was measured and an aliquot of manure slurry was collected for subsequent quantitative PCR PEDv enumeration and infectivity in a pig bioassay.

Long-term manure and soil incubation. Initial tests determined appropriate initial soil moisture contents (representing a ‘dry’ and ‘moist’ soil condition) and manure:soil ratios (1 g slurry:3 g soil) to best represent the manure:soil within an injection furrow when slurry is injected into soil, and appropriate liming source (ag lime vs. quicklime). PEDv-positive manure slurry collected from a commercial swine operation in southeast Nebraska was divided between two 3-L containers, one for limed treatment (LIME) and the other for the control, or no-lime, treatment (CNL). Quicklime (30 g) was added to one 3 L portion (equivalent to an application of 80 lbs. quicklime per 1000 gallons of slurry) to achieve a final pH of 12. Both treated and untreated slurry stocks were incubated at room temperature for 24 hours. Distilled water was added to two soils, a silty clay loam (pH 7.0) and a loamy fine sand (pH 6.9), to attain 10% and 30% water holding capacity! (dry and moist soil condition). Thirty grams (dry weight) of soil was apportioned to multiple 50 mL screw top conical tubes and a cavity was made in the center of the soil by pressing a 10 mL pipet tip into the soil. Ten mL of slurry (LIME or CNL) were then added to each soil tube via pipet. Four replicate tubes were immediately frozen at -80°C for each combination of soil, moisture, and manure treatment to represent initial soil application (day 0). The tubes were loosely capped and placed into one of three incubators operated independently throughout the trial to simulate soil temperatures between November 1 and May 1 at one of three geographic locations: southern Minnesota, northern Missouri, and central Oklahoma (Figure 1). Twenty replicate tubes were created for each combination of soil, moisture, incubation, and manure treatment, and a set of four tubes were collected for each treatment combination on days 30, 60, 90, 120 and 150 of the incubation and immediately transfer! red to a -80°C freezer for storage.

Molecular detection and quantification of PEDv. Prior to analysis, soil and manure samples were removed from -80°C storage and allowed to thaw at room temperature. The RNA in each sample was extracted using the RNA PowerSoil Total RNA Isolation kit (Mo Bio, Carlsbad, CA). PEDv was detected in samples by reverse transcription and quantitative polymerase chain reaction (RT-qPCR).

Swine bioassay. To confirm that conditions yielding a PCR negative result actually inactivated the PED virus and rendered the manure non-infectious, a live pig bioassay was conducted with the limed and non-limed manure slurry samples from the initial short-term manure slurry incubation (quicklime addition). Fifteen pigs, approximately 21 days old, were sourced from a high-health facility whose dams tested negative for PEDv antibodies and virus by PCR. Piglets were tested for PEDv upon arrival and confirmed negative. Piglets were randomly assigned to individual housing in BSL-2 rooms at the University of Nebraska-Lincoln Life Sciences Annex as follows: control (3 piglets), pH 10 (6 piglets), and pH 12 (6 piglets), and allowed to acclimate for three days. Each pig was then administered a 10-mL oral gavage of manure slurry: three piglets in the control room received one of the three un-limed slurry samples; six piglets in the pH 10 room received one of the six limed (pH 10) sl! urry samp les (three limed for 1 h and three limed for 10 h); and six pigs in the pH 12 room received one of the six limed (pH 12) slurry samples (three limed for 1 h and three limed for 10 h). Piglets were monitored for fecal shedding of PEDv for four days until control animals began to demonstrate clinical signs of PEDv infection, at which time all piglets were humanely euthanized. Fecal swabs, and duodenum, ileum, jejunum, and cecum samples were collected from each animal and fixed in formalin. All fecal and tissue samples were analyzed for the presence of detectable PED virus by immunohistochemistry and PCR.

PEDv, log # g soil

What have we learned?

Manure Slurry Incubation: Manure limed to pH 10 and pH 12 for 1 and 10 h yielded no detectable PEDv RNA. Live swine bioassay results confirmed that these samples were not infective while control samples resulted in PEDv infection of piglets. These results indicate that a final manure slurry pH of 10 (equivalent to 50 lbs. of quicklime added to 1000 gallons manure slurry) is sufficient to reduce PEDv RNA to an undetectable concentration after 1 hour of contact time. All pigs receiving limed manure (pH 10 or 12 maintained for 1 or 10 h) during the live swine bioassay tested negative for PEDv infection while control pigs (un-limed treatment) all tested positive for PEDv infection (Figure 1). The pig bioassay results confirmed that the PCR assay is a reliable predictor for the presence of infectious PEDv in these matrices and that lime addition to achieve pH 10 for just one hour is sufficient to deactivate the virus in stored manure.

Soil Incubations: At the completion of the long-term (150-day) soil incubation, a subset of the frozen samples (LIME and CON soil samples collected on day 0 and 30) was selected for RNA extraction and qPCR analysis. The qPCR results from days 0 and 30 yielded no detectable PEDv RNA in either the limed or un-limed manure-amended soils (Figure 1). Furthermore, manure-amended soils did not differ from soil-only controls even though PEDv RNA was still detectable in the original manure slurry at high concentrations. No differences in PEDv abundance were detected on either day when initial soil moisture (10% vs 30% water holding capacity), incubation condition (MN vs. MO vs. OK), or soil type (silty clay loam and loamy fine sand) were varied. For these soils, the concentration of PEDv in limed or un-limed manure decreased immediately to a non-detectable level. These results indicate that manure-amended soil with pH 6.9 or greater is not a vector for transmission of the PED virus.

A consistent finding from all of the studies is that pH of media (slurry or soil) strongly influences PED virus survival.

Future Plans

Additional studies are underway to identify the lowest pH at which the PED virus is rendered non-infectious in slurry manure.

Corresponding author, title, and affiliation

Amy Millmier Schmidt, Assistant Professor, Departments of Biological Systems Engineering and Animal Science, University of Nebraska – Lincoln

Corresponding author email

aschmidt@unl.edu

Other authors

Stevens, E., A. Schmidt, D. Miller, J.D. Loy and V. Jin

Additional information

Dr. Amy Millmier Schmidt, corresponding author, can also be reach at (402) 472-0877.

Acknowledgements

Funding for this research was provided by the National Pork Board. Gratitude is extended to Ashley Schmit for assistance with laboratory activities and animal care. Special thanks to the Nebraska pork producers who granted access to their farms for collection of PEDv-positive manure.

Results of Nutrient Recovery System Installed on Large Scale Dairy Operation After 2-years of Operation


Proceedings Home | W2W Home w2w17 logo

*Do not make slides downloadable

Purpose 

For centuries, farmers have disposed of manure by simply spreading it on the land. It is a natural fertilizer. Today, that practice is no longer considered the best solution. Field spreading is now understood to contribute to a growing global problem of the pollution of water, soil, and air. Consequently, U.S. dairy farmers face increased fiscal and operational pressure from the progression of ever tightening environmental regulations. Conventional handling of manure also imposes a number of operational challenges (limitations for storage, land application and irrigation, settlement in lagoons, high manure hauling costs, etc.) and typically requires a relatively large land base to allow adequate nutrient management.

In Indiana, a dairy that was daily producing thousands of tons of livestock waste was investigating how technology could capture the valuable nutrients remaining in their cow manure after it had gone through the farm’s anaerobic digestion process. Their goal was to convert the manure/digestate into a nutrient rich cake that could be easier managed and made into fertilizer, and the liquid clean enough to be used unrestricted for land application.

The farm’s key operational deliverables were 1) to reduce the manure’s handling and transportation costs, 2) allow for precision applications of the processed manure as carbon-based fertilizer and 3) allow for re-use of nutrient reduced liquid for field irrigation.

What did we do? 

The dairy farm chose to implement a nutrient recovery technology from Trident Processes LLC. The technology separates the manure/digestate into three fractions: 1) cellulosic fiber, 2) a concentrated cake of nutrient enriched solids, and 3) water with about 1% remaining solids.

Trident’s turn-key system, consisting of different mechanical and chemical components, processes the manure and diverts each separated fraction into their separate spaces. Sensors and programmable controls (PLC) allow for smooth operation, requiring minimal operator attendance. The entire system can be monitored, controlled and diagnosed remotely.

The manure is fed into the system following the digestion process. The initial step is the extraction of the large fiber, which is done via a rotary screen conditioner. The wetted material separates, with the effluent water and fine solids sifting down through the screen while the larger fiber is retained. This step is critical as it ensures the fine particles, which contain the nutrients, are sent down stream for further treatment.

FIBER: The extracted fiber is sent to a screw press for further dewatering. This renders it as a 30% dry cellulosic fiber biomass that is ideal for recycling as cow bedding or other biomass use. Any liquid squeezed from the fiber is diverted to join the fine solids stream.

SOLIDS: The effluent water and solids are sent to a dissolved air flotation (DAF) tank. Polymerization ensures effective flocculation of the feedstock, resulting in a concentration of the nutrient rich particles that float to the surface. The sludge formed on the surface is skimmed off the top and gravity fed into a multi-disc press for second-stage dewatering. The press gently dewaters and thickens the recovered solid/nutrient sludge into a 25% solids, nutrient rich cake.

WATER: The final effluent water, now nutrient reduced, contains less than 1.2% solids and is sent to the lagoon for storage. The water is then reused for irrigation through efficient pivot systems or as operational water on the farm.

What have we learned? 

By implementing Trident’s Nutrient Recovery System, the farms’ objectives have been met and/or exceeded. After running for nearly two years the system is producing the following statistics:

• Fully automated operation requiring about 1 hr/shift for operator attendance (visual checks)

• 98% system uptime

• Polymer costs: $0.06 – $0.08/day/cow

• Reduction of handling and irrigation costs: $ 0.01/gal (conventional) vs $0.003/gal (center pivot)

• $250,000/yr electrical power savings with MD Press vs. centrifuge

• 73,000+ ton/yr nutrient cake produced

• 81% P, 70% organic N (54% TKN), and 20% K is the average nutrient capture rate

• 1% (max.) solids in the effluent water sent to lagoons

• 99% Suspended solids captured

Future Plans 

Dairy farm: A fertilizer plant will go live in the near future, allowing the farm to sell their concentrated nutrients to the plant as feedstock for custom fertilizer production.

Technology provider: 2nd Phase effluent treatment to capture and retain the solid and nutrient fraction of the existing process, allowing to meet stream discharge standards and comply with BOD / COD levels. Bench scale testing is completed. Farm scale pilot testing is scheduled to run from March 2017-December 2017.

Corresponding author, title, and affiliation       

Richard Shatto (Senior Partner at Point Nexus Consulting), Frank Engel (Director Marketing at KPD Consulting Ltd.)

Corresponding author email 

frank.engel@kpdconsulting.ca

Additional information 

https://youtu.be/PvaTGmyws-w (Carl Ramsey’s presentation at Indiana Dairy Forum)

http://www.progressivedairy.com/topics/manure/prairie-s-edge-dairy-on-pa… (Progressive Dairyman article)

http://tridentprocesses.com/documents/case-study-trident-nutrient-recove… (Newtrient case study)

https://are.wisc.edu/manure-processing/ (manure management project with University of Wisconsin)

http://www.foodqualityandsafety.com/article/nutrient-recovery-improves-s… (Nutrient Recovery Improves Sustainability article in Food Quality & Safety Magazine)

Acknowledgements       

Carl Ramsey, Environmental Manager at Prairie’s Edge Dairy Farm

Soil Net LLC, Dr. Aicardo Roa (strategic partner for chemical separation process)

Leap Tech, R.C. Ludke (strategic partner for automation)

Developing a Comprehensive Nutrient Management Plan (CNMP)

Proceedings Home | W2W Home w2w17 logo

Purpose

Livestock producers are presented with a number of challenges and opportunities. Developing a quality Comprehensive Nutrient Management Plan (CNMP) can effectively help landowners address natural resource concerns related to soil erosion, water quality, and air quality from manure management. As livestock operations continue to expand and concentrate in certain parts of the country, utilizing a CNMP becomes even more important. Following the NRCS 9-step planning process is critical in developing a good plan. Effective communication is a key element between all parties involved in the planning process. A CNMP documents the decisions made by the landowner for the farmstead area, crop and pasture area, and nutrient management. Information will cover the elements essential for developing a quality CNMP.

What did we do?

Since the CNMP documents the records of decisions by the landowner, it has to be organized in such a fashion that it is understandable to and usable by the landowner. The CNMP is the landowner’s plan. Therefore, the role of the planner is to help landowners do the things that will most benefit them and the resources in the long run. This will take both time and effort. To provide consistency with other conservation planning efforts within NRCS, CNMPs following the same process outlined in the National Planning Procedures Handbook. There are several items that are essential for a quality CNMP to be developed:

• Have a good understanding of potential resource concerns especially soil erosion, water quality and air quality.

• Make the appropriate number of site visits. Trying to do this from the office will likely lead to a poor quality CNMP that may not be implemented.

• Address resource concerns for the Farmstead and Crop and Pasture areas.

• Ensure that all nutrient sources are addressed.

• Follow the 9 steps of planning.

• Decisions are agreed upon by the landowner. The CNMP reflects the landowner’s record of decisions.

• Follow-up to address any questions or concerns.

• Update as necessary. A CNMP is not a static document.

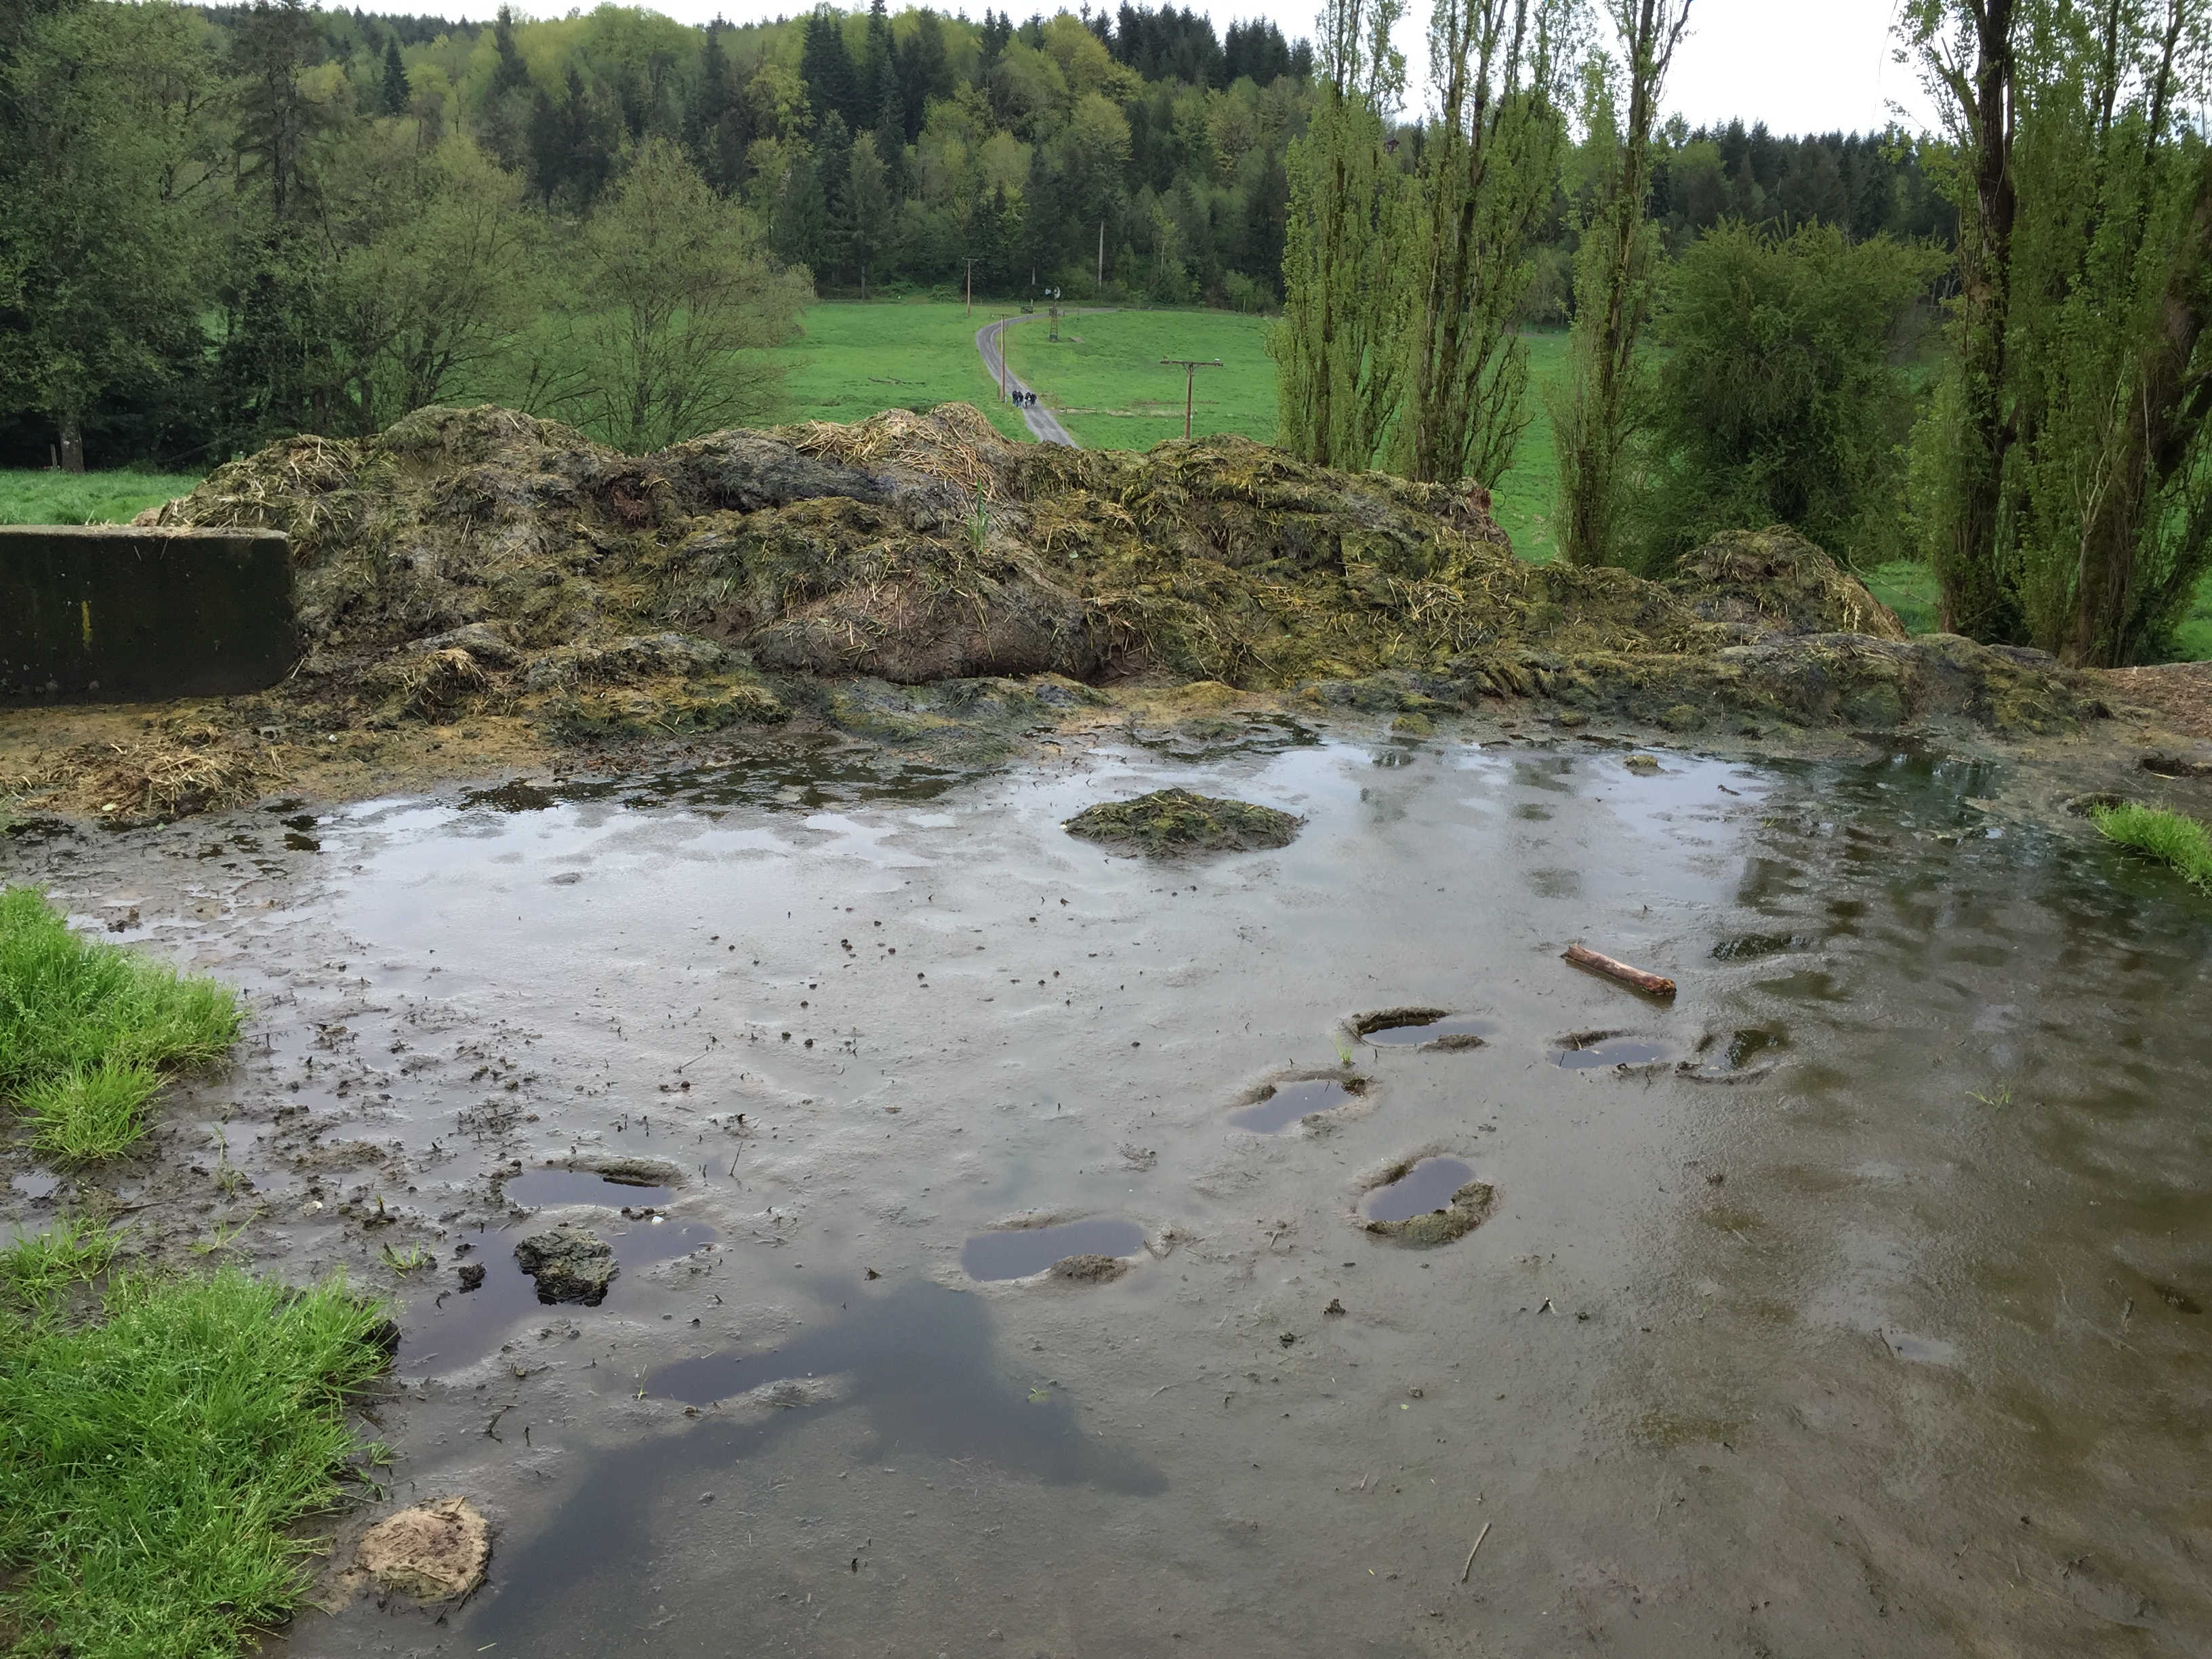
Field

Land application of animal manure without proper land treatment practices

Muddy field with standing water

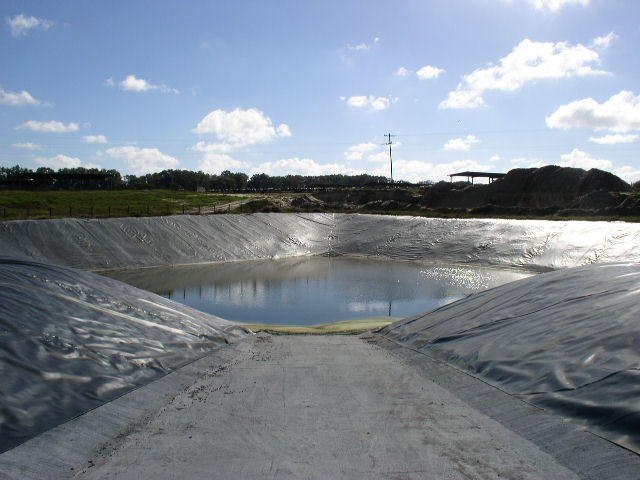
Proper animal manure storage required to address water quality issues

Picture of lined water bed

Evaluation of storage area to adequately address surface and subsurface
water quality issues

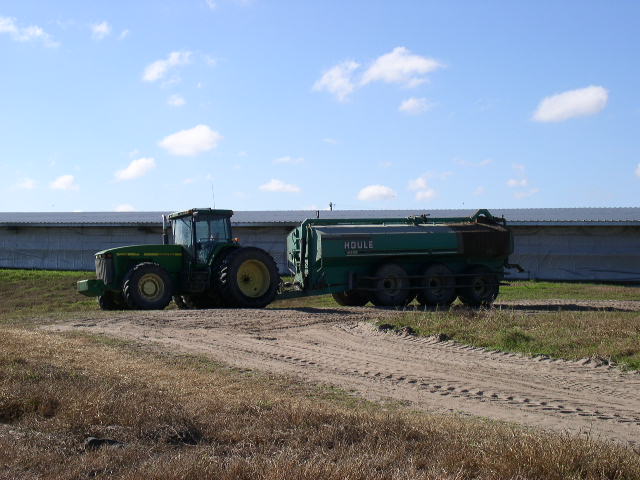
Picture of tractor and tanker spreader

Land application and nutrient management are critical elements for a
properly prepared CNMP

What have we learned?

The quality of CNMPs varies greatly across the country. Some were becoming so large that landowners were having difficulty finding the activities that needed to be completed. The revised CNMP format and process following the NRCS Conservation Planning approach should improve both the quality and usability of the plans developed. Due to statutes in the Farm Bill, all conservation practices recorded in the record of decision of the CNMP, whether receiving financial assistance or not, must be implemented by the end of the established contract period between the landowner and NRCS. Therefore it is important to only include the practices that are going to be implemented. CNMPs should be periodically updated to account for operational changes such as animal numbers, cropping systems, or land application methods.

Future Plans

The CNMP planning process will be evaluated to determine whether landowner objectives are being met and resource concerns properly addressed. Additional evaluations will look at the consistency of the plans generated across the country and the usability by landowners.

Corresponding author, title, and affiliation

Jeffrey P. Porter, P.E.; National Animal Manure and Nutrient Management Team Leader, USDA-Natural Resources Conservation Service

Corresponding author email

jeffrey.porter@gnb.usda.gov

Additional information

References

USDA-NRCS General Manual – Title 190, Part 405 – Comprehensive Nutrient Management Plans

USDA-NRCS Handbooks – Title 180, Part 600 – National Planning Procedures Handbook

Code of Federal Register (CFR) Title 7, Part 1466 – Environmental Quality Incentives Program (1466.7 EQIP Plan of Operations and 1466.21 Contract Requirements)

Webinar

Comprehensive Nutrient Management Plans and the Planning Process – http://www.conservationwebinars.net/webinars/comprehensive-nutrient-management-plans-and-the-planning-process/?searchterm=cnmp

The authors are solely responsible for the content of these proceedings. The technical information does not necessarily reflect the official position of the sponsoring agencies or institutions represented by planning committee members, and inclusion and distribution herein does not constitute an endorsement of views expressed by the same. Printed materials included herein are not refereed publications. Citations should appear as follows. EXAMPLE: Authors. 2017. Title of presentation. Waste to Worth: Spreading Science and Solutions. Cary, NC. April 18-21, 2017. URL of this page. Accessed on: today’s date.

What’s New with Comprehensive Nutrient Management Plans (CNMPs)?

Proceedings Home | W2W Home w2w17 logo

Purpose

A Comprehensive Nutrient Management Plan (CNMP) is a management plan to utilize nutrients and to manage the collection, handling, storage, application, & utilization of animal waste. The purpose of the plan is to address soil erosion, water quality, and air quality concerns. Even though a CNMP is not a regulatory document, portions can potentially be used in the permitting process. It is meant to be a dynamic plan to help the producer’s operation to be sustainable. Landowner of animal feeding operations (AFO’s) that receive technical and/or financial assistance from NRCS are required to have a CNMP. This includes dairies, beef feedlots, poultry, and swine operations. Land application of manure is not a requirement. There are no animal numbers thresholds for a CNMP.

What did we do?

In 1999 the Unified National Strategy for Animal Feeding Operations directed USDA and EPA to work together to address environmental issues with AFO’s. The CNMP was developed as a voluntary way for a landowner to take action. The original document had a ten part format and was truly comprehensive. Any planner or engineer associated with the plan had to sign it. Developing a CNMP in this format was difficult and time consuming and in some cases the document became so large in size that no one updated them.

What have we learned?

In October 2015 the format changed back to a plan that is more consistent with a conservation plan, recording the decisions of the landowner/cooperator with regard to managing waste and utilizing the nutrients.

The plan now has a four part format. The first part is the signature page where the NRCS representative and the landowner sign confirming the decisions. Section one follows the signature page and documents decisions with regard to the Production Area (Farmstead). It includes maps, animal inventory, and records of decisions for the production area only. Section two documents the decisions with regard to the Land Treatment Area (Crop and Pasture). It contains maps, resource assessments, implementation requirements and records of decision for the land treatment areas. The third section documents decisions with regard to Nutrient Management. This includes risk analyses, setbacks, nutrient applications, and field balances.

For livestock operations with greater than 300 animal units a printout of the National Air Quality Site Assessment tool (NAQSAT) is now required as supporting documentation in the CNMP. It is to increase awareness of air quality issues that may be addressed on farm.

Several parts of the original format are not included in the current format. This includes the Operation and Maintenance plan and the Emergency Response plan. Both would now be found in the case file and not in the CNMP itself.

Picture of a field

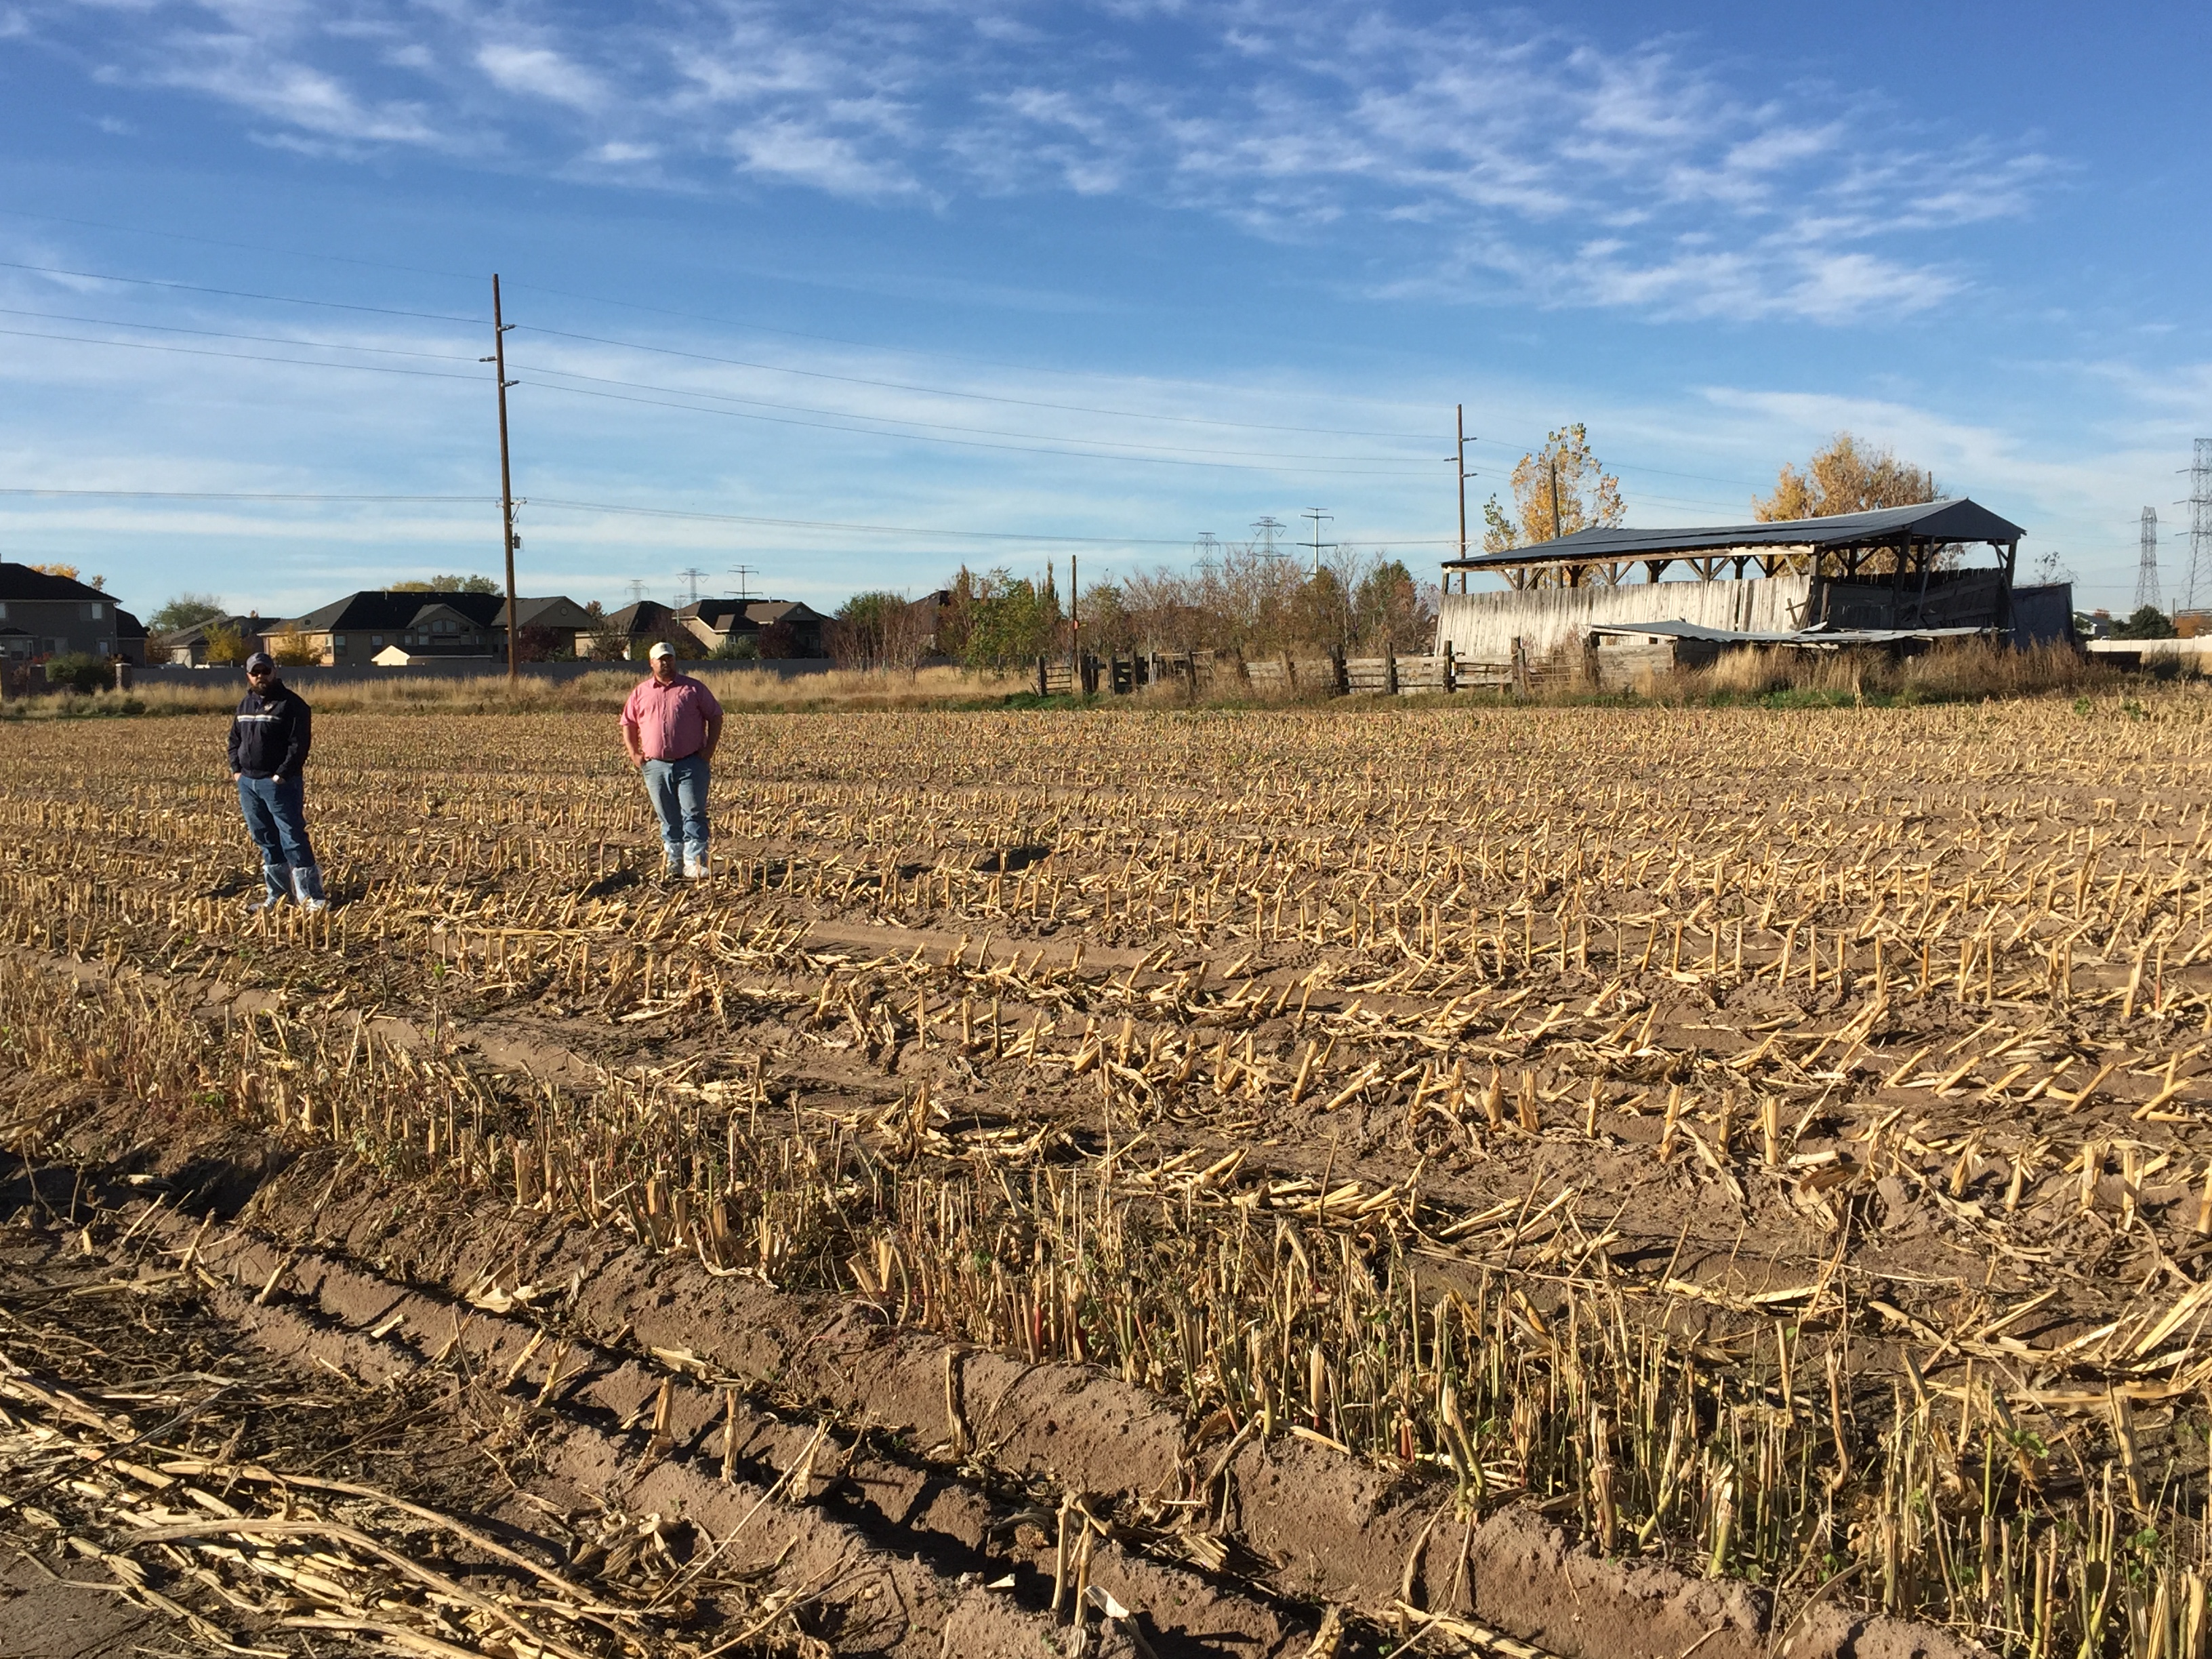
Looking at crop residue.

Slurry containment

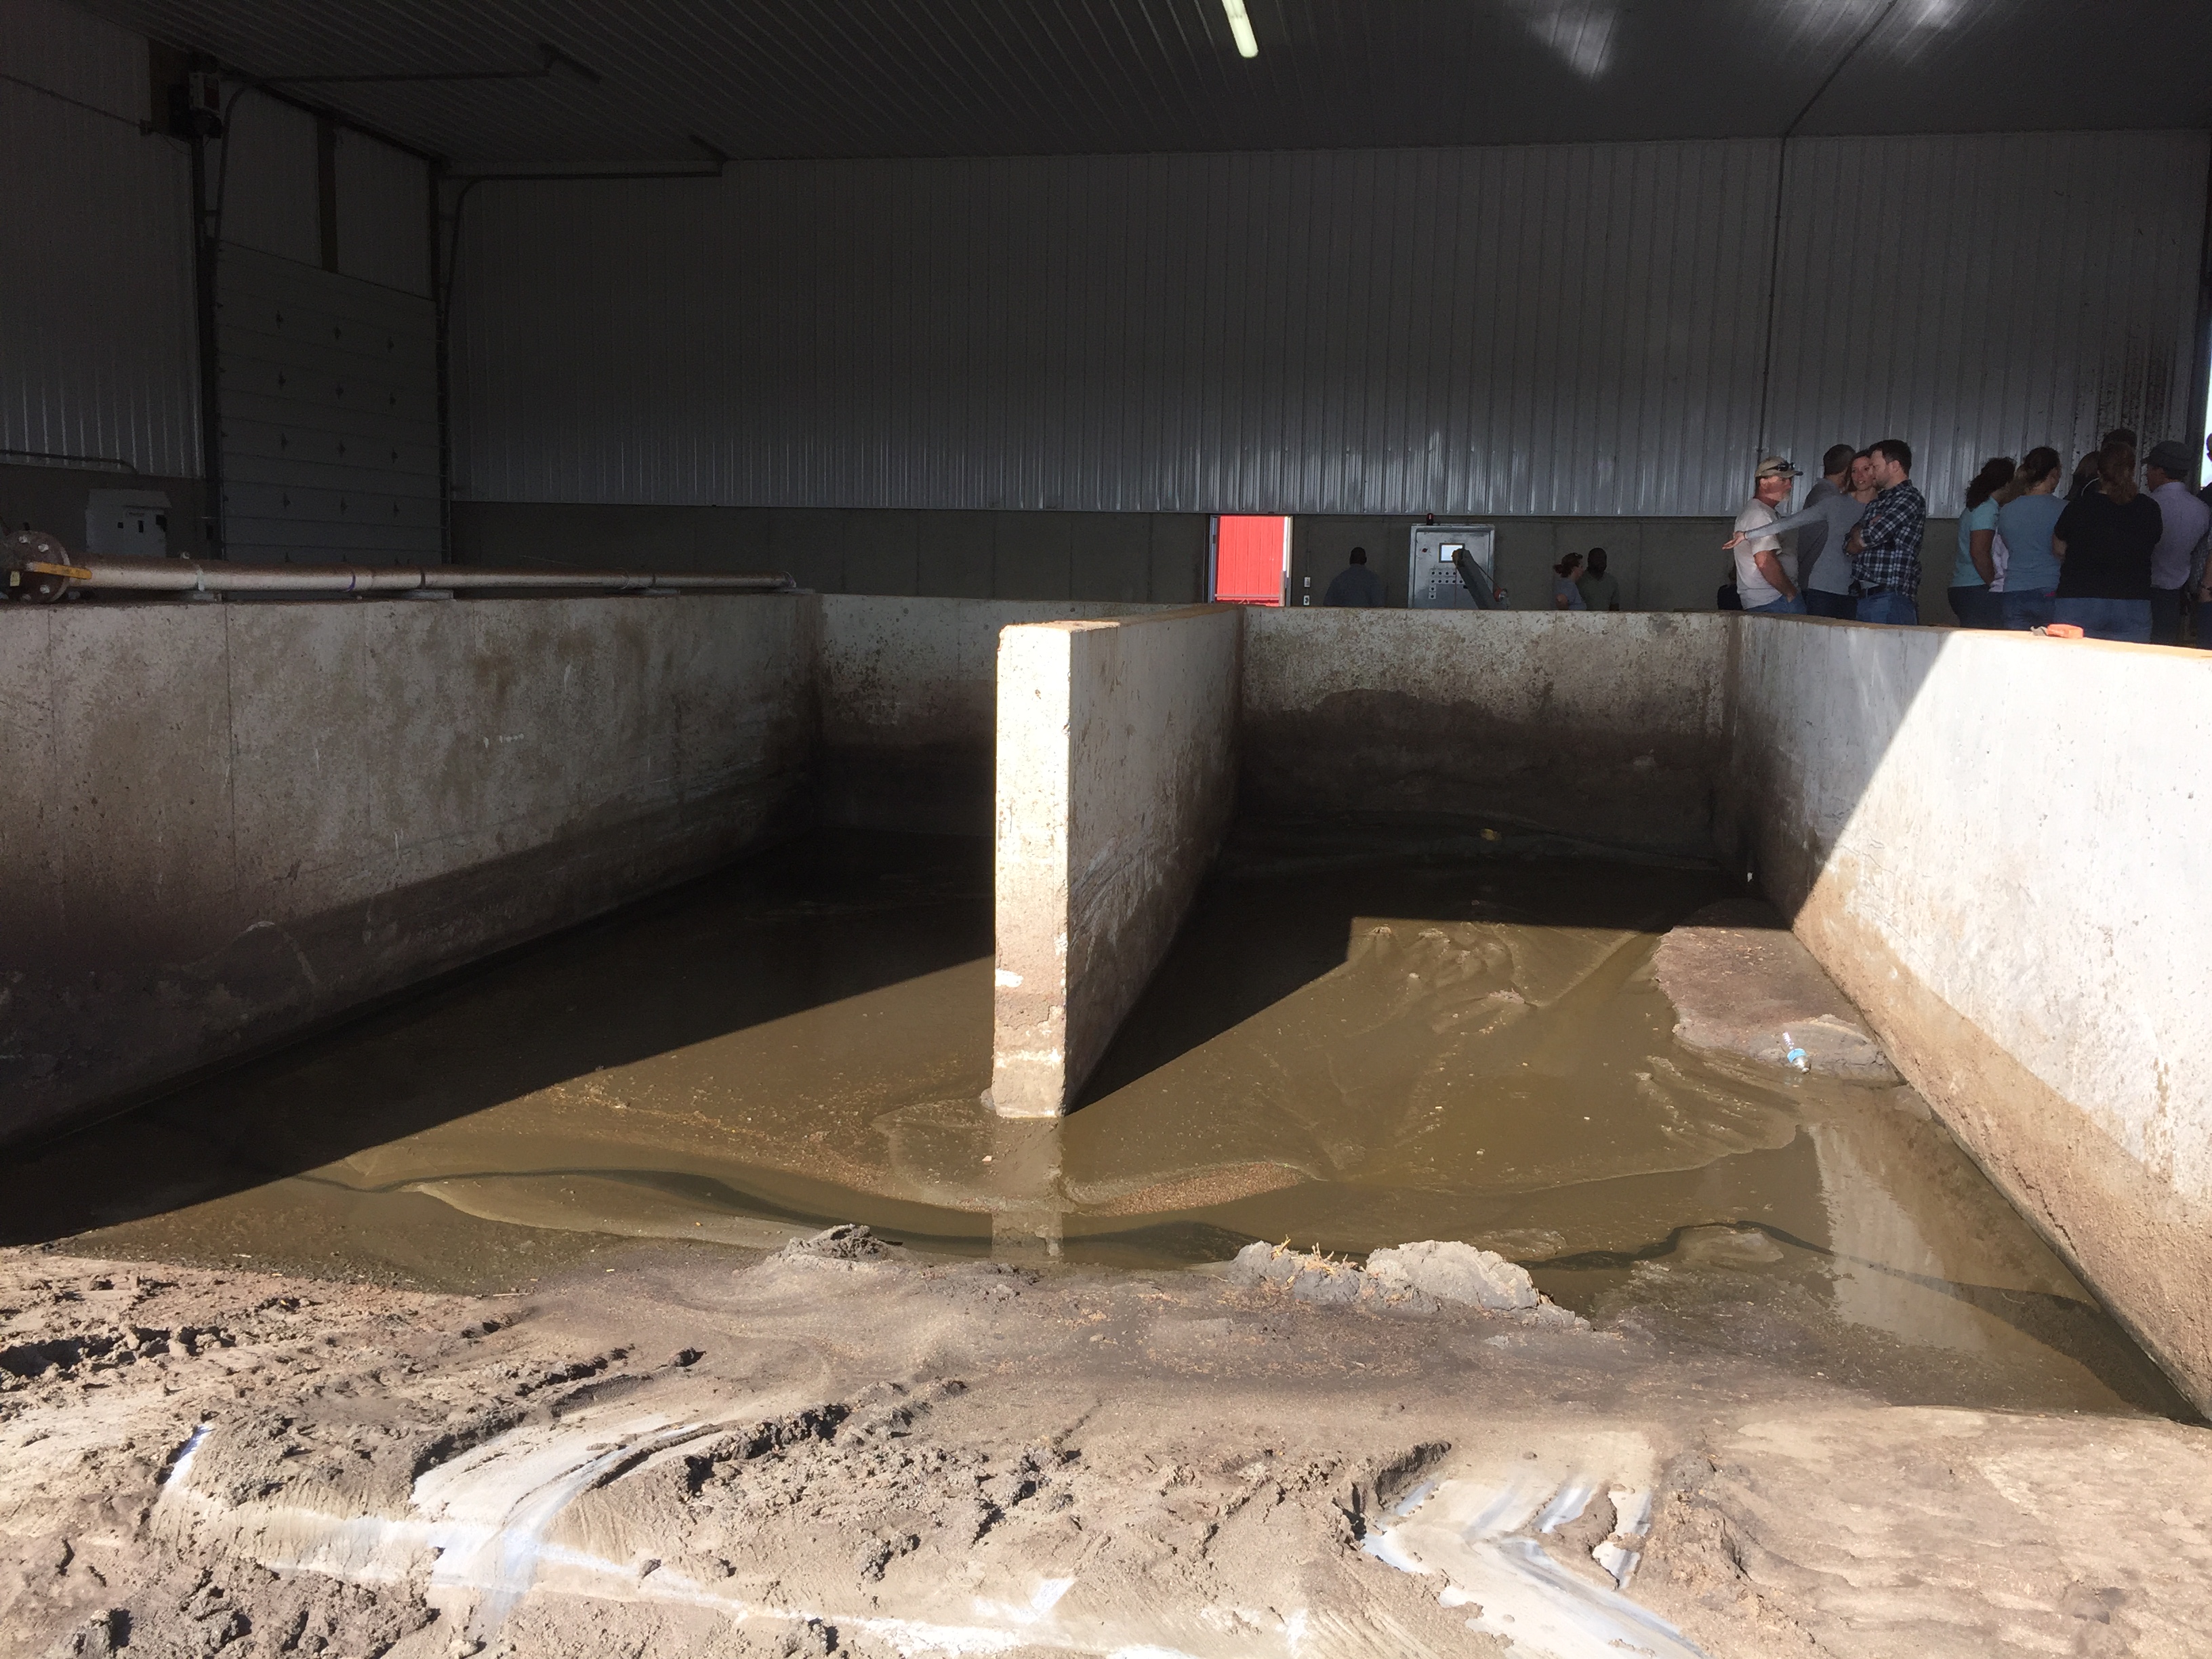
Evaluating solid separation on the farmstead.

Picture of people in field at demo

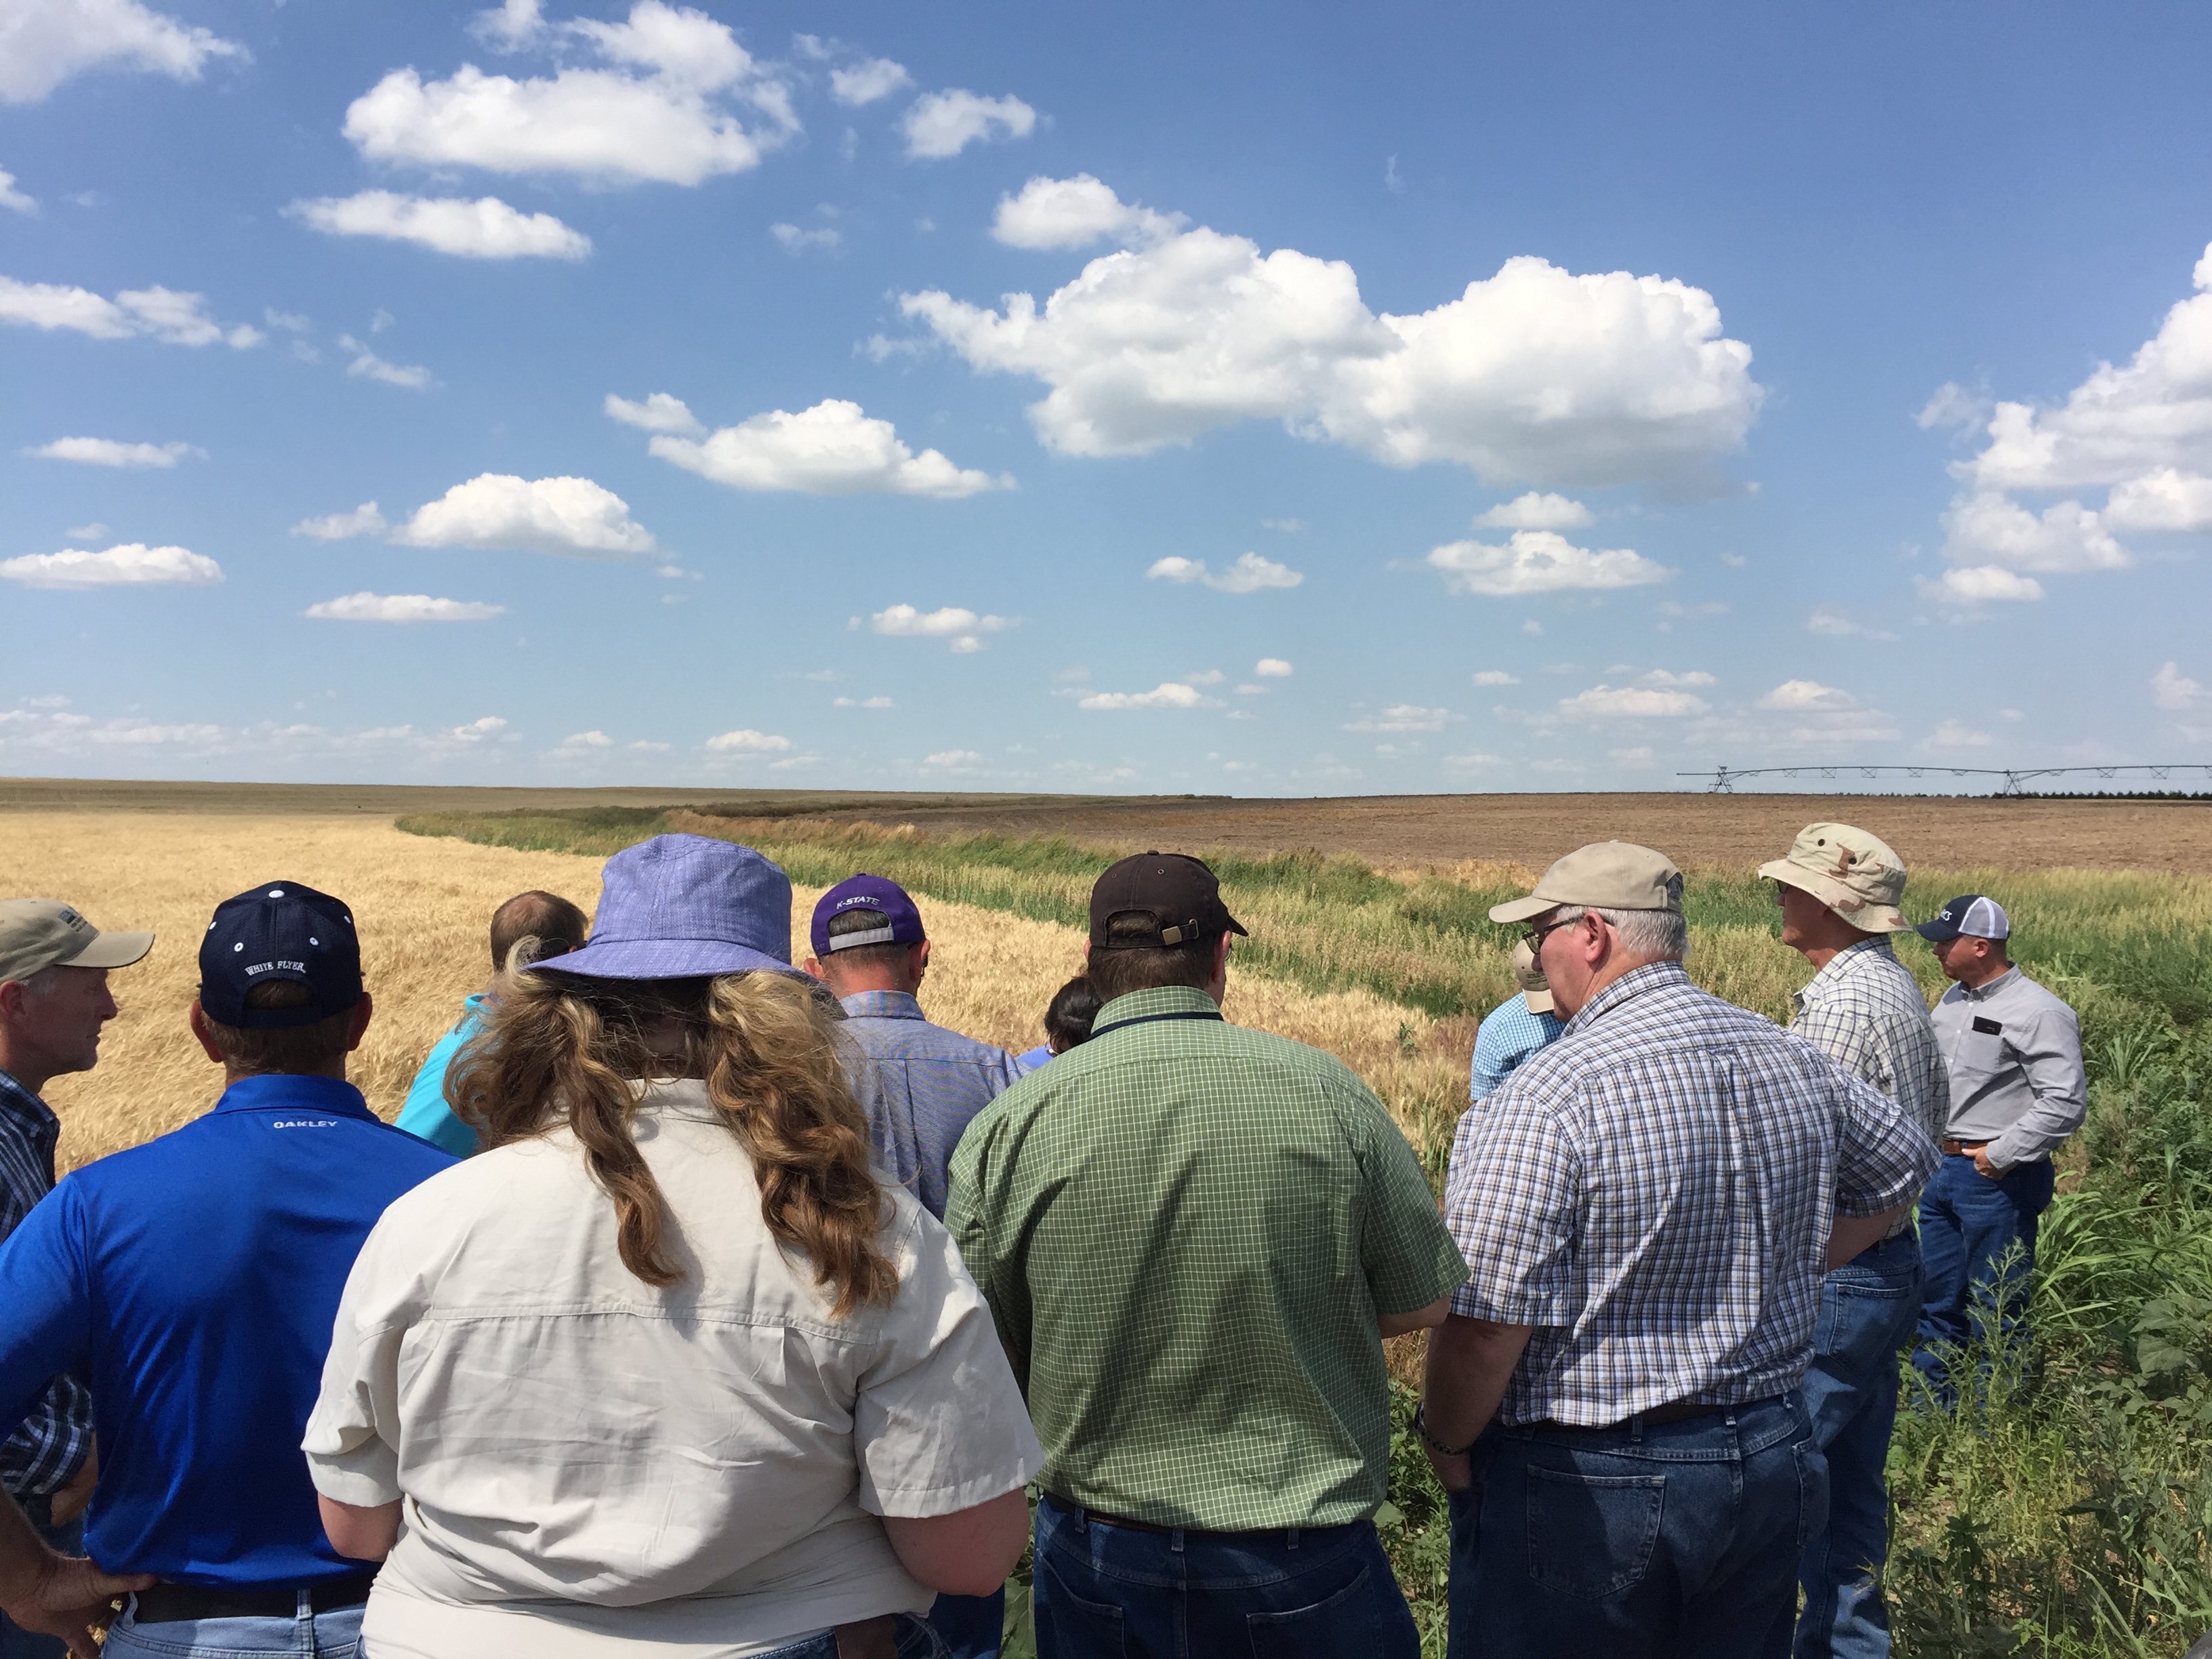
Discussing crop rotation and setbacks.

Future Plans

States are currently integrating the new national format. The CNMP format will be reviewed periodically to make sure that the document stays on track as a usable management tool for the landowner.

Corresponding author, title, and affiliation

Sandy Means, Environmental Engineer, USDA Natural Resources Conservation Service, East National Technical Center, Greensboro, NC

Corresponding author email

Sandy.Means@gnb.usda.gov

Additional information

Resources:

NRCS General Manual, Title 190, Part 405 Comprehensive Nutrient Management Plans

The authors are solely responsible for the content of these proceedings. The technical information does not necessarily reflect the official position of the sponsoring agencies or institutions represented by planning committee members, and inclusion and distribution herein does not constitute an endorsement of views expressed by the same. Printed materials included herein are not refereed publications. Citations should appear as follows. EXAMPLE: Authors. 2017. Title of presentation. Waste to Worth: Spreading Science and Solutions. Cary, NC. April 18-21, 2017. URL of this page. Accessed on: today’s date.

Effectiveness of Livestock Exclusion in a Pasture of Central North Carolina


Proceedings Home | W2W Home w2w17 logo

*Do not make slides downloadable

Purpose 

Jordan Lake (Reservoir), located in central North Carolina, is a 5,650-ha impoundment with a 436,860-ha watershed of which 18% was urban, 20% agricultural, and 56% forested. Like many lakes in the eastern U.S., the use of this water resource is being threatened by excessive nutrient inputs. A proposed nutrient reduction strategy set overall nitrogen (N) and phosphorus (P) load reduction goals for the watershed at 8-35% for N and 5% for P. Because much of the agricultural land in the watershed was used for pasture, the initial focus of reduction efforts was on pastures with livestock exclusion fencing identified as having the most potential. The objective of this project was to document the effectiveness of a combination of livestock exclusion fencing and nutrient management implemented on a beef cattle pasture typical of pastures in the Jordan Lake watershed and of the Piedmont region of NC.

What did we do? 

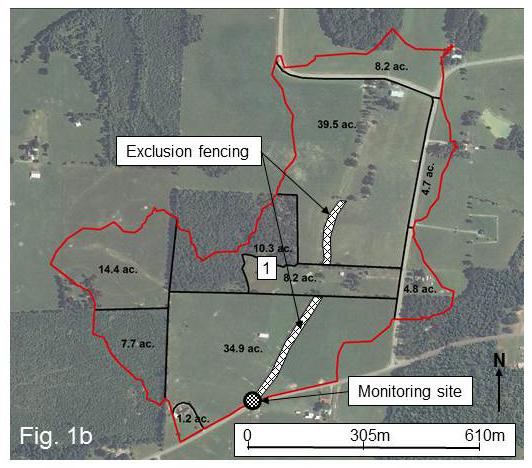
figure 1aThe paired watershed experimental approach used in this project, required simultaneous monitoring of two watersheds (treatment and control), during a calibration and a treatment period. The calibration period was from 12/30/07 to 10/5/11 and the treatment period was from 10/6/11 to 12/18/15. During both periods, the rainfall and quantity and quality of discharge were monitored continuously. Land use information (number of cattle, fertilization, soil test results) was collected at least annually. The treatment watershed (Past-treat) encompassed 54.5 ha all but 7.3 ha of which was used for beef cow pasture. The control watershed (Past-cont) encompassed 78.1 ha 39.5 ha of which was pasture, while most of the remainder (27.5 ha) was wooded.

In the treatment watershed the exclusion fenceline was constructed in October, 2011 about 3 m from the top of the streambank on either side and was limited to the main stream channel only (fig. 1b). Nutrient management was also implemented which eliminated P application as soil tests showed that there was adequate P in the soil to support the growth of pasture grasses such as fescue. In the control watershed, beef cattle had unlimited access to the stream channel during the entire project (fig. 1a). Monitoring included collecting flow-proportional samples during storm events and analyzing them for total Kjeldahl (TKN), ammonia (NH3-N), and inorganic (NOx-N) nitrogen as well as total phosphorus (TP) and total suspended solids (TSS).

What have we learned?           

figure 1bStatistical analyses of storm event load data documented that during the post-fencing period, mass loading of TKN (34%), NH3-N (54%), TN (33%), TP (47%), and TSS (60%) was reduced significantly in the treatment relative to the control watershed, while storm discharge and NOx-N loads were not significantly different. These data showed that even a relatively narrow exclusion corridor implemented on only the main stream channel can significantly reduce the export of nitrogen, phosphorus, and sediment from a beef cattle pasture.

Future Plans   

Evaluate livestock exclusion fencing at another Piedmont site with a wider exclusion corridor.

Corresponding author, title, and affiliation       

Daniel Line, Extension Specialist at NC State University

Corresponding author email    

dan_line@ncsu.edu

Other authors  

Deanna Osmond, Professor, NC State University

Additional information              

Published in J. Environmental Quality 45:1926-1932

Acknowledgements      

This project received support from the National Institute of Food and Agriculture, U.S. Department of Agriculture, Integrated Water Quality Grant award 2011-0515 as well as funding from NCDEQ-DWR as pass-through funds from U.S. EPA 319.

A Model Comparison of Daily N2O Flux with DayCent, DNDC, and EPIC


Proceedings Home | W2W Home w2w17 logo

Purpose 

Process-based models are increasingly used as tools for studying complex agroecosystem interactions and N2O emissions from agricultural fields. The widespread use of these models to conduct research and inform policy benefits from periodic model comparisons that assess the state of agroecosystem modeling and indicate areas for model improvement. The increasingly broad application of models requires an assessment of model performance using datasets that span multiple biogeophysical contexts. While limited in the capacity to identify specific areas for model improvement, general evaluations provide a critical perspective on the use of model estimates to inform policy and also identify necessary model improvements that require further evaluation.

What did we do? 

The objectives of this model comparison were to i) calibrate and validate three process-based models using a large dataset; ii) evaluate the performance of a multi-model ensemble to estimate observed data; and iii) construct a linear model to identify and quantify possible model bias in the estimation of soil N2O flux from agricultural fields. We selected three models that have been used to evaluate N2O emissions from agricultural fields: DayCent, DNDC, and EPIC. Using data from two field experiments over five years, we calibrated and validated each model using observations of soil temperature (n = 887), volumetric soil water content (VSWC) (n = 880), crop yield (n = 67), and soil N2O flux (n = 896). Our model validations and comparisons consisted of commonly conducted statistical evaluations of root mean squared error, correlation, and model efficiency. Additionally, the large sample sizes used here allowed for more robust linear regression models that offered additional insight into relationships between model estimations and observations of N2O flux. We hypothesized that such a linear model would indicate if there was model bias in estimations of soil N2O flux. Ensemble modeling can reduce the error associated with climate projections and has recently been applied to the estimation of N2O flux from agroecosystems. Thus, we also constructed a multi-model ensemble to evaluate the use of multiple models to improve estimates of soil N2O flux.

What have we learned? 

In a comparison of three process-based models, calibration to a large dataset produced favorable estimations of soil temperature, VSWC, average yield, and N2O flux when the models were evaluated using RMSE, R2, and the Nash-Sutcliffe E-statistic. However, an evaluation of linear regression models revealed a consistent bias towards underestimating high-magnitude daily N2O flux and cumulative N2O flux. Observations of soil temperature and VSWC were unable to significantly explain model bias. Calibration to available data did not result in consistent model estimation of additional system properties that contribute to N2O flux, which suggests a need for additional model comparisons that make use of a wide variety of data types. The major contribution of this work has been to identify a potential model bias and future steps required to evaluate its source and improve the simulation of nitrogen cycling in agroecosystems. Process-based models are powerful tools, and it is not our objective to undermine their past and future application. However, more work is left to be done in understanding the biogeophysical system that produces soil N2O and in harmonizing the process-based models that simulate that system and which are used to evaluate management and generate policy.

Future Plans 

Future work should test our findings in additional agroecological contexts to determine the extent to which a bias towards underestimating peak N2O flux persists. A meta-analysis of published data may be the most direct method for doing so. New datasets will need to be collected that represent simultaneous observations of multiple system properties (e.g. soil NO3-, soil NH4+, and heterotrophic respiration) from different soil layers and at increased temporal frequencies. Model developers should use these rich datasets to identify the source of N2O estimation bias and improve the structure and function of process-based models.

Corresponding author, title, and affiliation      

Richard K. Gaillard, Graduate Student, University of Wisconsin-Madison

Corresponding author email    

rgaillard@wisc.edu

Other authors  

Curtis D. Jones, Assistant Research Professor, University of Maryland; Pete Ingraham, Research Scientist, Applied Geosolutions;

Additional information               

sustainabledairy.org

Acknowledgements     

This material is based upon work that is supported by the National Institute of Food and Agriculture, U.S. Department of Agriculture, under award number 2013-68002-20525. Any opinions, findings, conclusions or recommendations expressed in this publication are those of the author(s) and do not necessarily reflect the view of the U.S. Department of Agriculture.

Additional Authors:

Sarah Collier, Research Associate, University of Wisconsin-Madison;

Roberto Cesar Izaurralde, Research Professor, University of Maryland;

William Jokela, Research Scientist (retired), USDA-ARS;

William Osterholz, Research Associate, University of Wisconsin-Madison;

William Salas, President and Chief Scientist, Applied Geosolutions;

Peter Vadas, Research Scientist, USDA-ARS;

Matthew Ruark; Associate Professor; University of Wisconsin-Madison

The authors are solely responsible for the content of these proceedings. The technical information does not necessarily reflect the official position of the sponsoring agencies or institutions represented by planning committee members, and inclusion and distribution herein does not constitute an endorsement of views expressed by the same. Printed materials included herein are not refereed publications. Citations should appear as follows. EXAMPLE: Authors. 2017. Title of presentation. Waste to Worth: Spreading Science and Solutions. Cary, NC. April 18-21, 2017. URL of this page. Accessed on: today’s date.

Pathways for Effective Manure Nutriment Management Information Sharing and Education Between Agriculture Professionals: A South Dakota Pilot Test


Why Look at Barriers in Nutrient Management Information Flow?


The issue of manure nutrient management has been the subject of controversy and new policies in recent years as the non-point source discharge of nutrients and bacteria is substantial if manure is not managed properly. Unfortunately, there are barriers between organizations and individuals that prevent the flow of important, timely information between audience types and limits the impact and usefulness of research results. These barriers may be in the form of institutional language differences, job descriptions, or a mismatch between information outputs and inputs.

What did we do?

A national team of researchers, Extension specialists, consultants and government staff developed a survey to quantify the role, programming, and barriers to information flow between organizations and individuals regarding manure nutrient management. The electronic survey was disseminated via cooperating agencies, organizations and personal contacts to technical service providers, producers, university personnel, regulatory personnel, private sales or service enterprises and other professionals who contribute to manure nutrient management in South Dakota. Respondents were asked to indicate the relevance of information sources (inputs), information products (outputs) and collaborators (links), as well as barriers to their use. The relevance selections were transformed into scalar data and an analysis of variance was performed on the average relevance scores to test for differences based on input/output/link type and organization type.

What have we learned?

There were 139 surveys started, and 80 surveys completed. Data from partially completed surveys were, however, included in the analysis. The main categories of self-identified respondents were NRCS (n=36), Producers (n=29), University personnel (n=15) and Regulatory personnel (n=9). The remaining categories respondents were grouped into an Other category (n=22). The average relevance score for each of the information sources, information products and collaborations listed in the survey were consistent (no significant difference between organization types). As sources of information, consultation, eXtension and field days were ranked most relevant, with classroom and social media being least relevant. Similarly, consultation, field days and eXtension were ranked the most relevant means of sharing information; social media was ranked least relevant. Barriers to information sources and products were specific to the activity or product. The select ion “No barriers to use” was not an indicator of relevance. All organization types deemed producers the most relevant collaborator, followed by state, university and federal agencies.

Future Plans

The South Dakota-based survey was a pilot test for a nationwide survey being conducted in 2015. From feedback and data review, the survey has been refined and shortened to elicit the key input, output and collaborator data. With the national data in hand later in 2015, the project team looks forward to linking information producers and users in effective pathways for manure nutrient management information transmission, and ultimately, adoption.

Authors

Erin Cortus, Assistant Professor and Environmental Quality Engineer at South Dakota State University erin.cortus@sdstate.edu

Nichole Embertson, Nutrient Management Specialist, Sustainable Livestock Production Program, Whatcom Conservation District; Jeffrey Jacquet, Assistant Professor, Sociology and Rural Studies, South Dakota State University

Additional information

Anyone interested in participating on the Pathways Project team are invited to contact Erin Cortus (erin.cortus@sdstate.edu) or Nichole Embertson (NEmbertson@whatcomcd.org).

Acknowledgements

The nationwide team who contribute to and guide the Pathways project are gratefully acknowledged. Funding provided through the South Dakota SARE Mini-Grant Program supported data collection and analysis for the survey pilot test.

The authors are solely responsible for the content of these proceedings. The technical information does not necessarily reflect the official position of the sponsoring agencies or institutions represented by planning committee members, and inclusion and distribution herein does not constitute an endorsement of views expressed by the same. Printed materials included herein are not refereed publications. Citations should appear as follows. EXAMPLE: Authors. 2015. Title of presentation. Waste to Worth: Spreading Science and Solutions. Seattle, WA. March 31-April 3, 2015. URL of this page. Accessed on: today’s date.

 

Existing Equine Pasture Best Management Survey Findings from NE-1441 States


Purpose

Pasture is a good source of nutrition and 94% of U.S. equine operations allow horses to access pastures [8]. Proper management of equine operations requires the adoption of Best Management Practices (BMPs) to balance nutrient production and prevent erosion. Government agencies are concerned about non-point sources of water pollution and have focused on agriculture, including equine operations, as a major contributor to water quality issues. Many states’ laws have regulated equine farms, requiring farm managers to incorporate BMPs. Best Management Practice utilization on horse farms needs to be quantified before regulations are adopted. The objectives of these various states’ surveys were to quantify and assess the use of the equine industry’s BMPs in pasture management and erosion control and to examine potential environmental impacts. The object of this abstract is to compare and look for some similarities in the ways horse farms are managed to mitigate negative environmental impacts. Few studies have investigated horse BMPs in the regions. More research is needed to assess the effect of horse farm management on the nation’s water quality.

What did we do?

Over the past five years, state university extension equine specialist participating on the NE-1441: Environmental Impacts of Equine Operations, multi-state project, have conducted surveys of their state equine industry. Many of the state surveys were conducted to quantify and assess the use of the equine industry’s BMPs in pasture management and erosion control and to examine potential environmental impacts.

In all cases a written survey instrument was developed and the questions were reviewed by experts in the field for content and face validity. Some of the surveys used the multiple waves, (postage) mailing techniques, while some used online survey mailings, and others used an SRS clicker feedback style quiz during a program or event [1,3,7,10]. Several states developed a large list of names and email addresses consisting of horse owners/farm managers from within their state. All used follow-up reminders sent to non-responding addresses to increase return rates. All of the state’s surveys analyzed the data for descriptive statistics. Frequencies and percentages were determined for all surveys. Cross tabulations were used to determine the relationship between management practices and farm management demographics. There is difficulty in comparing the different surveys because they are all different in methodology and in the way they were conducted and analyzed.

What have we learned?

Size and scope of the equine industry-

The New Jersey equine industry consists of 7,200 horse farms with 29% having 8 or more horses. In NJ more than 50% of the farms had 5 or fewer horses and 56% of the farms had 4.05 hectors (10 ac) or less and 18.6% had more than 8.09 ha. [10] The Maryland Equine Industry consists of 87,000 horses located on 20,200 operations, averaging 11.6 ha of pasture [3].  The Pennsylvania study averaged housing 13.4 horses on 21 ha (52.7 ac) of pasture and has 32,000 operations [7].  The Tennessee study reported the average herd size of 5, with 25.6 ac designated for pasture [6]. Forty-two percent of Vermont’s horse operation house over 9 horses on 25 ac of land.

Methods horse farms used to manage pasture quality-

Results of a Pennsylvania horse farm survey showed, that during the growing season, as many as 65% reported using a rotational pasture system and 25% continuously grazing horses [7].  A Maryland survey found that only 30% of horse farm operators used rotational grazing on their farms [3].  In a Tennessee survey, continuous grazing was practiced by 51.5% of respondents. Only 23.8% of TN respondents allowed pasture to recover to a recommended grazing height and 45.3% reported sometimes resting pastures [6].  The New Jersey survey reported 54% practicing some form of rotational grazing [9].  A study conducted on farms in Minnesota and Wisconsin revealed farms had an average stocking density of 1.75 acres per horse [1].  Designated sacrifice lots were present on 84% of farms, while the average ground cover was 88% in NJ [10]. The PA study, reported 23.8% allowed pasture to recover to a recommended grazing height and 45.3% reported sometimes resting pastures. Most respondents, 75.4% assessed their pasture vegetative cover at 80% or better, and 5% reported poor vegetative cover [7].

Methods horse farms used to manage soil and weeds-

Pasture weed problems were reported to be a major issue by 78.1% of TN owners. Half of TN farm operators (49.8%) indicated they have never performed soil fertility tests [6]. While in NJ, 31% of horse farms indicated they soil test [10]. PA horse farm operators (49.8%) indicated they have never performed soil fertility tests on their pastures, with only 25.4% testing soil every 1-3 yrs [7].  In the NJ survey 89% reported mowing pastures [10].

Methods horse farms used to manage manure-

The PA survey reported that farms composting and using compost on the farm (34.1%), hauled off the farm fresh (10.9%), spread fresh on crop/pasture fields daily (10.6%), composted and hauled off farm (7.7%), horses pastured 24 hr/d with manure harrowed or removed (16.4%), horses pastured 24 hr/d with manure never managed (7.1%) [7]. New Jersey farms, 54% indicated they spread manure on their farmland, and 74% indicated that they have a designated area for storing manure. NJ farm with greater pasture acreage were positively correlated with having manure storage [10].  The TN survey, reported, that stall waste was stored on bare ground in uncovered piles (89.8%) and either stored indefinitely or spread regularly on pastures [6].

How do farm managers receive/obtain information-

Several studies showed, horse managers are receiving most of their educational information from publications, magazine articles and the internet [7].  Therefore, Extension needs to reach horse farm managers with what we do best, factsheets, popular press articles and meetings. In the PA survey, resources participants used for information included books, magazines, publications (79.4%), internet resources (79.1%), acquaintances (65%), agencies (60.5%), multi-media (27.8%), private businesses (15.7%), and 2% reported using none. Participants indicated that the primary limitation to them altering current management practices was finances (75%), knowledge (37.5%), regulations (13.7), and an inability to obtain services (11.7%) [7].

In a South Dakota study, 29% of participants indicated that their primary need for information was regarding horse pasture management and 12% wanted to figure out how to increase grazing for horses as a primary goal. Many new SD landowners were present at an Extension event with 38% having owned their acreage for less than 3 years, and only 19% had owned their acreages for more than 10 years [5].

Future Plans

Knowledge of the current scope and nature of equine industry management practices are important when developing regulations and laws that will govern land management on equine operations. Recently, several state environmental regulations are having a direct impact on equine operations. However, horse farms frequently manage horses on fewer acres per animal unit and have the potential to pose a significant environmental risk. A NJ study reported that the rate of spreading manure decreased on farms with over 20 horses [10].

Most states surveys data shows that many horse farms are utilizing BMPs to help reduce environmental impact. However, many of these studies determined that landowners of small acreages have little knowledge of natural resources management [2,5,7].  There are several areas, such as soil testing and the use of sacrifice loafing areas in pasture management, where educational programming and cost share funding are needed to target specific BMPs underutilized by the equine industry. Nearly all survey respondents reported having some pasture and nutrient management questions [2,5,7,10].

In order to help stable managers understand the principles of sustainable best management practices, Cooperative Extension can conduct state-wide “Environmental Stewardship Short Courses.” These educational programs need to be a comprehensive series of educational programs (face-to-face meeting or webinars) to promote adoption of best management practices on equine operations. In addition, what is really needed is a comparative surveys instrument that can be used nation-wide to quantify and assess the use of the equine industry’s BMPs on horse farms.

Authors

Ann Swinker, Extension Horse Specialist, Pennsylvania State University aswinker@psu.edu

Betsy Greene, Extension Equine Specialist, University of Vermont

Amy Burk, Extension Horse Specialist, University of Maryland

Rebecca Bott, Extension Equine Specialist, South Dakota State University

Bridget McIntosh, Extension Equine Specialist, Virginia

Additional information

  1. Earing J, Allen E, Shaeffer CC, Lamb JA, Martinson KL. Best Management Practices on Horse Farms in Minnesota and Wisconsin. J Anim. Sci. 2012; 90:52.
  2. Fiorellino, N., McGrath , J., Momen, B., Kariuki, S., Calkins, M., Burk, A., 2014. Use of Best Management Practices and Pasture and Soil Quality on Maryland Horse Farms, J. Eq. Vet. Sci. 34:2, 257-264.
  3. Fiorellino, N.M., K.M. Wilson, and A.O. Burk. 2013. Characterizing the use of environmentally friendly pasture management practices by horse farm operators in Maryland. J. Soil Water Conserv. 68:34-40.
  4. Henning J, Lacefield G, Rasnake M, Burris R, Johns J, et al. Rotational grazing. University of Kentucky, Cooperative Extension Service 2000; (IS-143).
  5. Hubert, M., Bott, R.C., Gates, R.N., Nester, P.L., May 2013. Development and Branding of Educational Programs to Meet the Needs of Small Acreage Owners in South Dakota, J. of NACAA. 6:1, 2158-9429.
  6. McIntosh, B. and S. Hawkins, Trends in Equine Farm Management and Conservation Practices ASAS, Phoenix, AZ. 2/13/12.
  7. Swinker, A., S. Worobey, H. McKernan, R. Meinen, D. Kniffen, D. Foulk, M. Hall, J. Weld, F. Schneider, A. Burk, M. Brubaker, 2013, Profile of the Equine Industry’s Environmental, Best Management Practices and Variations in Pennsylvania, J. of NACAA. 6:1, 2158-9429.
  8. USDA: Aphis” VS, (1998). National Animal Health System, Highlights of Equine: part III, p. 4.
  9. Westendorf, M. L., T. Joshua, S. J. Komar, C. Williams, and R. Govindasamy. 2010. Manure Management Practices on New Jersey Equine Farms. Prof. Anim. Sci. 26:123-129.
  10. Westendorf, M. L., P. Venkata, C. Williams, J. Trpu and R. Govindasamy. 2012. Dietary and Manure Management Practices on Equine Farms in Two New Jersey Watersheds, Eq. Vet. Sci. 33:8,601-606.

Acknowledgements

The State University Extension Equine Specialist that make up the NE-1441: Environmental Impacts of Equine Operations, Multi-State Program. USDA, NRCS-CIG grant for funding the Pennsylvania project.

The authors are solely responsible for the content of these proceedings. The technical information does not necessarily reflect the official position of the sponsoring agencies or institutions represented by planning committee members, and inclusion and distribution herein does not constitute an endorsement of views expressed by the same. Printed materials included herein are not refereed publications. Citations should appear as follows. EXAMPLE: Authors. 2015. Title of presentation. Waste to Worth: Spreading Science and Solutions. Seattle, WA. March 31-April 3, 2015. URL of this page. Accessed on: today’s date.