
Recommendations for Manure Injection and Incorporation Technologies for Phase 6 Chesapeake Bay Watershed Model


Proceedings Home W2W Home w2w17 logo

Purpose

A Best Management Practice (BMP) Expert Panel was convened under guidance of the Chesapeake Bay Program’s (CBP) Water Quality Goal Implementation Team to assess and quantify Nitrogen and Phosphorus load reductions for use in the Phase 6 Chesapeake Bay Watershed Model when manure is injected or incorporated into agricultural lands within the watershed. (Further description of Expert Panels and processes can be found in the 2017 Waste to Worth Proceedings and Presentation by Jeremy Hanson and Mark Dubin).

What Did We Do?

The Expert Panel first created definitions of injection and incorporation practices, which allowed technologies utilized in research to be categorized within each definition. Categorization considered the manner in which manure was placed beneath the soil surface as well as the level of surface disturbance. Manure injection was defined as a specialized category of placement in which organic nutrient sources (including manures, biosolids, and composted materials) are mechanically applied into the root zone with surface soil closure at the time of application with soil surface disturbance of 30% or less. Manure incorporation was defined as the mixing of dry, semi-dry, or liquid organic nutrient sources (including manures, biosolids, and compost) into the soil profile within a specified time period from application by a range of field operations (≤24hr for full ammonia loss reduction credit and 3 days for P reduction credit(s)). Incorporation was divided into categories of high disturbance (<30% residue retention) and low disturbance (>30% residue retention). Both liquid and solid manures were considered.

The panel conducted an extensive literature review of research that allowed comparison of nutrient loss after manure injection and incorporation with a baseline of surface manure application without incorporation. These comparisons were assembled in a large categorical table in percentage form, that reflected loss reduction efficiency. Many manuscripts offered a percentage comparison of application treatments to the surface application baseline. For research reports that did not provide a percentage comparison, the panel interpreted results into a percentage comparison when possible.

Consideration to soil variability and location in the Chesapeake Bay Watershed was considered on a very broad basis and in a manner consistent with work of other panels and modeling team recommendations. Loss reduction efficiencies were provided for soils or locations listed as either Coastal or Upland regions. Nitrogen efficiencies did not vary between the regions, but Phosphorus efficiencies did.

What Have We Learned?

Nitrogen and Phosphorus loss reduction efficiency reported or derived from literature varied within categories. For some categories, the volume of literature was small. Research providing these efficiencies is often conducted on small plots with simulated rainfall. Literary reduction results were often provided as a range and not as a single value. Professional scrutiny and judgment was applied to each value provided from literature and to all values within injection and incorporation categories to determine loss reduction efficiencies to be used in the broad categories of the model. The final loss reduction efficiencies of the Expert Panel’s final report are provided in Tables 1 (Upland Region) and 2 (Coastal Region).

Table 1. Loss reduction efficiency values for Upland regions of the Chesapeake Bay Watershed.


Category

Nitrogen

Phosphorus

Time to Incorporation

Ammonia Emission Reduction

Reduction in N Loading1

Time to Incorporation

Reduction in P Loading2

Injection

0

85%

12%

0

36%

Low Disturbance Incorporation

≤24 hr

24-72 hr

50%

34%


8%

8%

≤72 hr


24%

High Disturbance Incorporation

≤24 hr

24-72 hr

75%

50%


8%

8%

≤72 hr


0%3

1 Reduction in N loading water achieved only for losses with surface runoff. The portion of total N loss through leaching is not impacted by the practices.  25% of total N losses to water are assumed to be lost with runoff (both dissolved N and sediment-associated organic matter N).

2 Reduction in P loading water achieved only for losses with surface runoff. The portion of total N loss through leaching is not impacted by the practices.  80% of total P losses to water are assumed to be lost with runoff (both dissolved  and sediment-bound P) in upland regions of the watershed.

3 Reduction in dissolved P losses typically offset by greater sediment-bound P losses due to greater soil erosion with tillage incorporation in upland landscapes.


Table 2. Loss reduction efficiency values for Coastal Plain region of the Chesapeake Bay Watershed.


Category

Nitrogen

Phosphorus

Time to Incorporation

Ammonia Emission Reduction

Reduction in N Loading1

Time to Incorporation

Reduction in P Loading2

Injection

0

85%

12%

12%

0

22%

Low Disturbance Incorporation

≤24 hr

24-72 hr

50%

34%


8%

8%

≤72 hr


14%

High Disturbance Incorporation

≤24 hr

24-72 hr

75%

50%


8%

8%

≤72 hr


14%

1 Reduction in N loading water achieved only for losses with surface runoff. The portion of total N loss through leaching is not impacted by the practices.  25% of total N losses to water are assumed to be lost with runoff (both dissolved N and sediment-associated organic matter N).

2 Reduction in P loading water achieved only for losses with surface runoff. The portion of total N loss through leaching is not impacted by the practices.  48% of total P losses to water are assumed to be lost with runoff (both dissolved and sediment-bound P) in Coastal Plain.

Future Plans

The report of the Manure Injection and Incorporation Panel were accepted by the Chesapeake Bay Program’s Agricultural Workgroup in December 2016. The values will be utilized in Phase 6 of the Chesapeake Bay Watershed Model. Future panels may revisit the efficiencies as future model improvements are made.

Corresponding author (name, title, affiliation) 

Robert Meinen, Senior Extension Associate, Penn State University

Corresponding author email address  

rjm134@psu.edu

Other Authors 

Curt Dell (Panel Chair), Soil Scientist, USDA-Agricultural Research Service

Art Allen, Associate Professor and Associate Research Director, University of Maryland – Eastern Shore

Dan Dostie, Pennsylvania State Resources Conservationist, USDA-Natural Resources Conservation Service

Mark Dubin, Agricultural Technical Coordinator, Chesapeake Bay Program Office, University of Maryland

Lindsey Gordon, Water Quality Goal Implementation Team Staffer, Chesapeake Research Consortium

Rory Maguire, Professor and Extension Specialist, Virginia Tech

Don Meals, Environmental Consultant, Tetra Tech

Chris Brosch, Delaware Department of Agriculture

Jeff Sweeney, Integrated Analysis Coordinator, US EPA

For More Information

Two related presentations given at the same session at Waste to Worth 2017

Acknowledgements

Funding for this panel was provided by the US EPA Chesapeake Bay Program and Virginia Tech University through an EPA Grant.

The authors are solely responsible for the content of these proceedings. The technical information does not necessarily reflect the official position of the sponsoring agencies or institutions represented by planning committee members, and inclusion and distribution herein does not constitute an endorsement of views expressed by the same. Printed materials included herein are not refereed publications. Citations should appear as follows. EXAMPLE: Authors. 2017. Title of presentation. Waste to Worth: Spreading Science and Solutions. Cary, NC. April 18-21, 2017. URL of this page. Accessed on: today’s date.

Livestock Methane Emissions Estimated and Mapped at a County-level Scale for the Contiguous United States


Proceedings Home W2W Home w2w17 logo

Purpose         

This analysis of methane emissions used a “bottom-up” approach based on animal inventories, feed dry matter intake, and emission factors to estimate county-level enteric (cattle) and manure (cattle, swine, and poultry) methane emissions for the contiguous United States.

What did we do? 

Methane emissions from enteric and manure sources were estimated on a county-level and placed on a map for the lower 48 states of the US. Enteric emissions were estimated as the product of animal population, feed dry matter intake (DMI), and emissions per unit of DMI. Manure emission estimates were calculated using published US EPA protocols and factors. National Agricultural Statistic Services (NASS) data was utilized to provide animal populations. Cattle values were estimated for every county in the 48 contiguous states of the United States. Swine and poultry estimates were conducted on a county basis for states with the highest populations of each species and on a state-level for less populated states. Estimates were placed on county-level maps to help visual identification of methane emission ‘hot spots’. Estimates from this project were compared with those published by the EPA, and to the European Environmental Agency’s Emission Database for Global Atmospheric Research (EDGAR).

What have we learned? 

Overall, the bottom-up approach used in this analysis yielded total livestock methane emissions (8,888 Gg/yr) that are comparable to current USEPA estimates (9,117 Gg/yr) and to estimates from the global gridded
EDGAR inventory (8,657 Gg/yr), used previously in a number of top-down studies. However, the
spatial distribution of emissions developed in this analysis differed significantly from that of
EDGAR.

Methane emissions from manure sources vary widely and research on this subject is needed. US EPA maximum methane generation potential estimation values are based on research published from 1976 to 1984, and may not accurately reflect modern rations and management standards. While some current research provides methane emission data, a literature review was unable to provide emission generation estimators that could replace EPA values across species, animal categories within species, and variations in manure handling practices.

Future Plans    

This work provides tabular data as well as a visual distribution map of methane emission estimates from enteric (cattle) and manure (cattle, swine, poultry) sources. Future improvement of products from this project is possible with improved manure methane emission data and refinements of factors used within the calculations of the project.

Corresponding author, title, and affiliation        

Robert Meinen, Senior Extension Associate, Penn State University Department of Animal Science

Corresponding author email    

rjm134@psu.edu

Other authors   

Alexander Hristov (Principal Investigator), Professor of Dairy Nutrition, Penn State University Department of Animal Science Michael Harper, Graduate Assistant, Penn State University Department of Animal Science Richard Day, Associate Professor of Soil

Additional information                

None.

Acknowledgements       

Funding for this project was provided by ExxonMobil Research and Engineering.

The authors are solely responsible for the content of these proceedings. The technical information does not necessarily reflect the official position of the sponsoring agencies or institutions represented by planning committee members, and inclusion and distribution herein does not constitute an endorsement of views expressed by the same. Printed materials included herein are not refereed publications. Citations should appear as follows. EXAMPLE: Authors. 2017. Title of presentation. Waste to Worth: Spreading Science and Solutions. Cary, NC. April 18-21, 2017. URL of this page. Accessed on: today’s date.

Biofuels and Bioproducts from Wet and Gaseous Waste Streams: Challenges and Opportunities

Proceedings Home W2W Home w2w17 logo

Purpose

To provide an initial characterization of the wet and gaseous organic feedstocks available in the continental U.S., and to explore technological possibilities for converting these streams into biofuels and bioproducts.

What did we do?

The Bioenergy Technologies Office (BETO) of the U.S. Department of Energy commissioned an in depth resource assessment by teams at the the National Renewable Energy Lab (NREL) and the Pacific Northwest National Lab (PNNL). Concurrently, BETO conducted a series of workshops, informed by an extended literature review and several rounds of peer review to ascertain the states of technologies for making biofuels and bioproducts from these resources. These efforts resulted in a January 2017 report that is available here:

https://energy.gov/eere/bioenergy/articles/beto-publishes-analysis-biofu…

What have we learned?

Terrestrial feedstocks are currently the largest resource generated for the bioeconomy, estimated at 572 million dry tons for 2017 (Billion Ton 2016), and have traditionally constituted the primary focus of the Bioenergy Technologies Office (BETO). However, the resource assessment conducted by the National Renewable Energy Lab and Pacific Northwest National Lab indicates that wet waste feedstocks (Summarized in Table ES-1) could also make significant contributions to the bioeconomy and domestic energy security goals.

Summary of Annual Wet and Gaseous Feedstock Availability

Table 1. Annual Resource Generation

1 116,090 Btu/gal. This does not account for conversion efficiency.

2 The moisture content of food waste varies seasonally, ranging from 76% in the summer to 72% in the winter.

3 Methane potential. This does not include currently operational landfill digesters (>1,000 billion cubic feet [Bcf] annually) and may double count potential from wastewater residuals, food waste, and animal waste.

4 DDGS = Dried Distillers Grains with Solubles

BCF- Billion cubic feet

When combining the primary waste streams of interest: sludge/biosolids, animal manure, food waste, and fats, oils, and greases, a supplemental 77 million dry tons per year are generated. Of this total, 27 million dry tons is currently being beneficially used (e.g. fertilizer, biodiesel, compost), leaving 50 million dry tons available for conversion to biofuels, bioproducts or biopower. Gaseous waste streams (biogas and associated natural gas) contribute an additional 734 trillion Btu (TBtu), bringing the total energy potential of these feedstocks to over 2.3 quadrillion Btu. Additionally, these streams contain methane, the second most prevalent greenhouse gas, which constituted 12% of net U.S. emissions in 2014 according to the U.S. Environmental Protection Agency’s (EPA) greenhouse gas inventory. Thus, there is significant potential to valorize these energy dense streams while simultaneously reducing harmful emissions.

As illustrated by example in Figure ES-1, wet and gaseous waste streams are widely geographically distributed, frequently in areas of high population density, affording them unique current and emerging market opportunities. The size of publicly owned treatment works, landfills, rendering operations, and grease collectors overlay with the largest population centers nationwide. Therefore, when compared to terrestrial feedstocks, these waste streams are largely aggregated and any derivative biofuels, bioproducts, or biopower are close to end markets.

Figure ES-1. Spatial distribution and influent range of 14,581 US EPA 2012 Clean Water Needs Survey (CWNS) catalogued treatment plants

At the same time, however, this close proximity to populations markets often correlates with more stringent regulatory landscapes for disposal. Therefore, the value proposition presented by these waste streams commonly includes avoiding disposal costs as opposed to an independent biorefinery that requires stand-alone profitability. Aided by these and related factors, public and private entities are actively exploring and deploying novel solutions for waste stream valorization. Potential competition between biofuels, bioproducts, and other beneficial uses will likely be a key element of future markets, and clearly merits further analytical and modeling investigation.

Future Plans

This report concludes that wet and gaseous organic waste streams represent a significant and underutilized set of feedstocks for biofuels and bioproducts. They are available now, in many cases represent a disposal problem that constitutes an avoided cost opportunity, and are unlikely to diminish in volume in the near future. As a result, at least in the short and medium term, they may represent a low-cost set of feedstocks that could help jump start the Bioeconomy of the Future via niche markets. While much modeling, analysis, and technological de-risking remains to be done in order to bring these feedstocks to market at significant scales, the possible contributions to the overall mission of the Bioenergy Technologies Office merit further attention.

Corresponding author, title, and affiliation

Mark Philbrick, Waste-to-Energy Coordinator, Bioenergy Technologies Office, U.S. Department of Energy

Corresponding author email

mark.philbrick@hq.doe.gov

Other authors

see report

Additional information

Future activities are contingent upon Congressional appropriations.

Acknowledgements

see report

The authors are solely responsible for the content of these proceedings. The technical information does not necessarily reflect the official position of the sponsoring agencies or institutions represented by planning committee members, and inclusion and distribution herein does not constitute an endorsement of views expressed by the same. Printed materials included herein are not refereed publications. Citations should appear as follows. EXAMPLE: Authors. 2017. Title of presentation. Waste to Worth: Spreading Science and Solutions. Cary, NC. April 18-21, 2017. URL of this page. Accessed on: today’s date.

An Economical Method to Install Industrial Wastewater Storage Pond Liners


Proceedings Home W2W Home w2w17 logo

Purpose 

Over the past four decades, the number of custom slaughterhouses in Michigan has steadily decreased as the number of livestock producers declined. Those who remain are growing larger as they capitalize on the buy local food craze by providing fresh USDA-approved boxed meats at a meat counter or by adding value to the meats by further processing (i.e., sausages, hams, etc.). All slaughterhouses in the State are regulated by the Michigan Department of Environmental Quality (MDEQ) who issues permits for the proper disposal of the process wastewater for those operations that are not connected to a municipal sewer.

Typical disposal of the process wastewater involves removal of the solids through septic tank filtration and screens followed by storage of the process wastewater in ponds for eventual disposal on crop ground at agronomic rates. Facilities operating in this manner are issued a Groundwater Discharge Permit from MDEQ. However, because the state classifies slaughterhouses as an industry, the storage ponds require double liners and must meet a hydraulic conductivity of 1 x 10⁻⁷ centimeters/second.

A process wastewater storage pond is being designed for a slaughterhouse located in Coopersville, Michigan. The existing process wastewater holding pond is not sufficient to hold process water generated at the facility due to the recent expansions in slaughterhouse operations. Therefore, modifications to the existing holding pond and construction of a new holding pond to accommodate the process water generated is underway. The construction of the ponds is scheduled for spring 2017.

This paper evaluates the applicability, economic feasibility compared to geomembrane liners and constructability of pond liners using AquaBlok.

AquaBlok is a man-made clay pellet material that handles like gravel and is placed in varying thicknesses depending on the desired hydraulic conductivity and then hydrated to create a low permeable liner. Advertised as a “composite particle system” each AquaBlok particle contains an individual piece of limestone as its core. When a continuous layer of individual particles is applied, the clay (i.e., a high-quality sodium bentonite coating) surrounding each stone hydrates, swells, and binds together to produce a low-permeable earthen liner when introduced to a water environment.

What did we do? 

Based on the current operations and future growth forecast, the slaughterhouse requires a pond(s) with total holding capacity of approximately 1.6 million gallons of process wastewater. This accounts for process wastewater generated in total of eight (8) months period. Soil borings were taken at the site and soil samples were collected to determine geotechnical parameters including hydraulic conductivity. Total of eight (8) soil borings were advanced to an approximate depth of fifty (50) feet below ground surface. Based on the laboratory testing results, the hydraulic conductivity of the native clay did not meet the MDEQ’s minimum 1 x 10⁻⁷ cm/s requirement. These results indicate a need for a composite liner for the existing pond as well as the new pond. Two candidate liner materials are being evaluated. They are 1) clay liner that is constructed of AquaBlok and 2) geomembrane liner. Geomembrane are commonly being used for wastewater! holding ponds. AquaBlok is not being frequently used as liners for holding ponds. However, once constructed appropriately, this material would provide a liner with hydraulic conductivity of less than 1 x 10⁻⁸ cm/s and appropriate shear and compressive strength. Currently, the economic feasibility of the two methods is being evaluated. Also, the constructability of the AqaBlok liners is being investigated. The ponds are scheduled to be constructed in Spring 2017.

What have we learned? 

The evaluation of AquaBlok as a liner material for process wastewater holding ponds is being evaluated. The construction of the ponds is scheduled for Spring 2017. This material has promising geotechnical parameters and can provide a liner with a very low permeability once constructed appropriately. A detailed discussion of the material evaluation, liner construction methodology, economic analysis, and regulatory compliance will be presented during the oral presentation.

Use of a geotextile liner is an approved method to construct industrial wastewater storage ponds in Michigan but cost and liner installer availability is typically a detriment to fast installations.

Future Plans    

Due to a plant expansion, the design drawings and application to expand the process wastewater pond capacity and to meet the state requirements for minimum liner permeability are currently in review by the state MDEQ. Construction of the new storage pond is planned for spring 2017 pending MDEQ review and approval.

Corresponding author, title, and affiliation        

Matthew J. Germane, PE, Senior Project Engineer at Environmental Resources Group, LLC

Corresponding author email    

Matt.Germane@ERGrp.net

Other authors   

Mala Hettiarachchi, Ph.D, PE, Senior Engineer at Environmental Resources Group, LLC

Additional information                

Additional information on Michigan’s rules for liner construction of industrial wastewater is available at:

http://www.michigan.gov/documents/deq/wb-groundwater-P22GuidshtIV_248171_7.pdf

Acknowledgements       

The authors wish to acknowledge DeVries Meats, Inc., in Coopersville, MI and their owner, Ken DeVries, whose site the design work and cost evaluations were completed for.

Developing Science-Based Estimates of Best Management Practice Effectiveness for the Phase 6 Chesapeake Bay Watershed Model

Proceedings Home W2W Home w2w17 logo

Purpose

The Chesapeake Bay Program (CBP) is a regional partnership that leads and directs Chesapeake Bay restoration and protection. The CBP uses a suite of modeling and planning tools to estimate nutrient (nitrogen and phosphorus) and sediment loads contributed to the Bay from its watershed, and guide restoration efforts. Non-point source (NPS) pollutant sources (e.g., agricultural and urban runoff) are largely related to diverse land uses stretching across six states and the District of Columbia. On-the-ground pollutant reductions are achieved by implementing both management and structural best management practices (BMPs) on those diverse land uses. Short and long-term reductions in NPS pollutant loads that result from BMP implementation are estimated using the CBP modeling suite of tools. The CBP recognizes (i.e., represents pollutant reduction credits for) over 150 BMPs across 66 land uses total for all sectors in its Phase 6 suite of modeling tools. The estimated pollutant reduction performance (i.e., effectiveness) of each BMP is parameterized in the CBP modeling suite. Within the CBP, BMP effectiveness is determined by groups of qualified scientific and technical experts (BMP Expert Panels) that review the relevant literature and make an independent determination regarding BMP performance which are reviewed and approved by the CBP partnership before being integrated in to the modeling tools by the CBP modeling team.

BMP Expert Panels are primarily convened under the auspices of the CBP’s Water Quality Goal Implementation Team and tasked to specific sector workgroups for oversight and management. Panels are tasked with addressing a specific BMP, or a suite of related BMPs. Panel members, in coordination with the CBP partnership, are selected based on their scientific expertise, practical experience with the BMP, and expertise in fate and transport of nutrients and sediment. Panels review the relevant literature and through a deliberative process and form recommendations on BMP pollutant production performance, and how the BMP(s) should be accounted for/incorporated into the CBP modeling tools and data reporting systems. Convening BMP Expert Panels is an ongoing focus and priority of the CBP partnership, given the integral role BMP implementation plays in achieving the pollution reduction goals required by the 2010 Chesapeake Bay Total Maximum Daily Load (TMDL).

What Did We Do?

Expert panels follow the process and adhere to expectations outlined in the Chesapeake Bay Program Partnership’s Protocol for the Development, Review, and Approval of Loading and Effectiveness Estimates for Nutrient and Sediment Controls in the Chesapeake Bay Watershed Model (aka the “BMP Protocol”). The expert panel process functions as an independent peer review, similar to that of the National Academy of Sciences.

Each panel reviews and discusses all current published literature and available unpublished literature and data related to the BMP(s), and formulates recommendations using the guidance provided in the BMP Protocol to help weigh the applicability of each data source.  Consensus panel recommendations are recorded in a final report, which is presented to relevant CBP partnership groups, including the CBP partnership’s Agriculture Workgroup for feedback and approval.

Panel recommendations are built into the modeling tools following CBP partnership approval of the panel’s report.

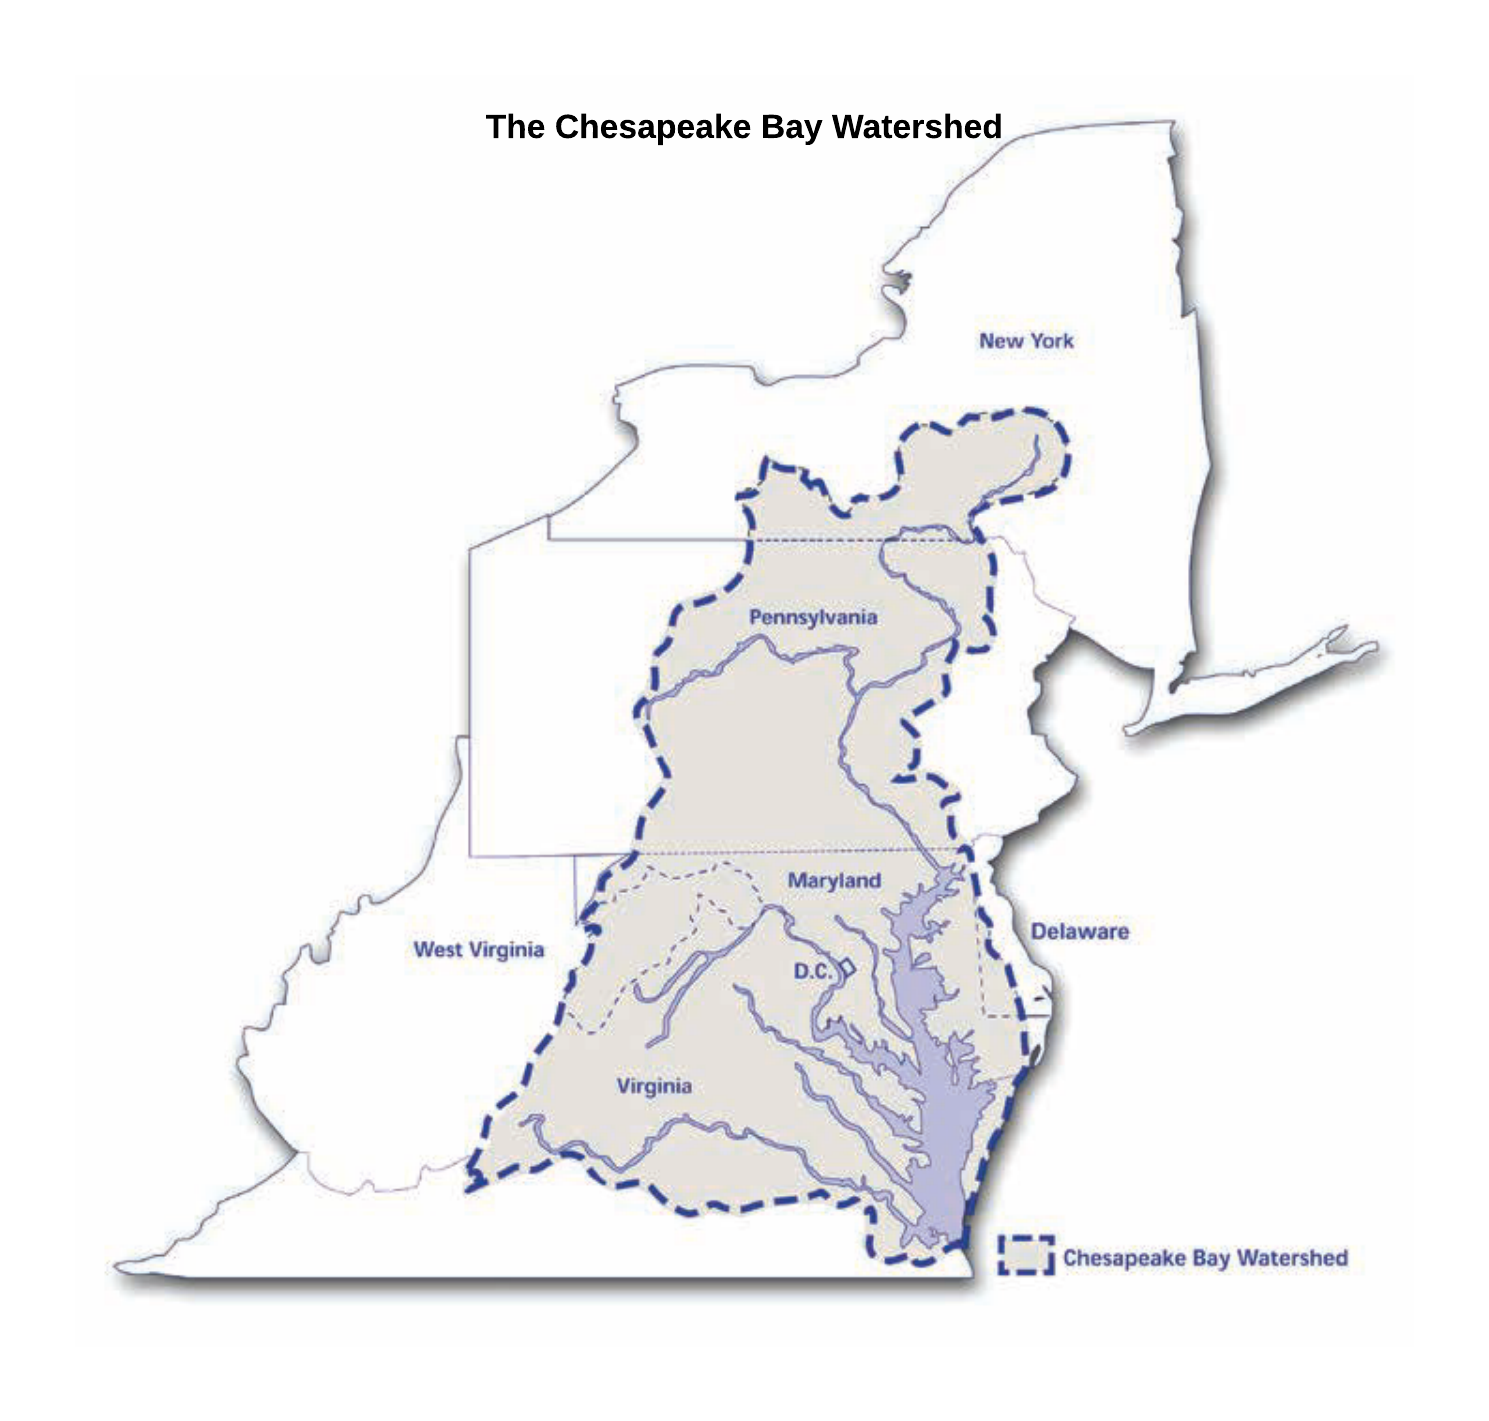
Chesapeake Bay Watershed Map

Basic Diagram of the Chesapeake Bay Program Expert Panel BMP Review Process

What Have We Learned?

The availability of published, peer-reviewed data varies greatly based on the scope of the panel. Some panels have dozens of articles to analyze while others may have a limited number of published studies to supplement gray literature, unpublished data and their best professional judgment. Even panels with a large amount of relevant literature at their disposal identify important gaps and future research needs. Given the wide range of stakeholders in the CBP partnership, regular updates and communication with interested parties as the panel formulates its recommendations is extremely important to improve understanding and acceptance of final panel recommendations.

Future Plans

The Chesapeake Bay Program evaluates BMP effectiveness estimates as new research or new conservation and production practices become available. Thus, expert panels sometimes revisit BMPs that were previously reviewed, but new and innovative BMPs are also considered. The availability of resources and new research limit the frequency of these reviews in conjunction with the priorities of the CBP partnership. Given the CBP partnership’s interest in adaptive management and continually improving its scientific estimates of BMP effectiveness, there will continue to be BMP expert panels for the foreseeable future.

Corresponding author (name, title, affiliation)

Jeremy Hanson, Project Coordinator – Expert Panel BMP Assessment, Virginia Tech

Corresponding author email address

jchanson@vt.edu

Other Authors

Mark Dubin, Agricultural Technical Coordinator, University of Maryland Extension

Brian Benham, Professor and Extension Specialist, Virginia Tech

Each expert panel has at least several other authors and contributors, which is not practical for listing here. Each individual report identifies the panel members and other contributors for that specific panel.

Additional Information

The BMP Review Protocol is available online at http://www.chesapeakebay.net/publications/title/bmp_review_protocol

All final expert panel reports are posted on the Chesapeake Bay Program website under “publications”: http://www.chesapeakebay.net/groups/group/bmp_expert_panels

Acknowledgements

These BMP expert panels would not be possible without the generosity of expert panel members who volunteer their valuable time and perspectives. Staff support, coordination and funding for these panels is provided by the EPA Chesapeake Bay Program, specifically through Cooperative Agreements with Virginia Tech and University of Maryland, with additional contract support from Tetra Tech as needed. The work of these expert panels is strengthened through the participation, review and comments of the CBP partnership.

The authors are solely responsible for the content of these proceedings. The technical information does not necessarily reflect the official position of the sponsoring agencies or institutions represented by planning committee members, and inclusion and distribution herein does not constitute an endorsement of views expressed by the same. Printed materials included herein are not refereed publications. Citations should appear as follows. EXAMPLE: Authors. 2017. Title of presentation. Waste to Worth: Spreading Science and Solutions. Cary, NC. April 18-21, 2017. URL of this page. Accessed on: today’s date.

Recommendations of the Chesapeake Bay Program Expert Panel on Manure Treatment Technologies

Proceedings Home W2W Home w2w17 logo

Purpose

The US EPA Chesapeake Bay Program assesses nutrient loading to the Chesapeake Bay. There is a need to determine the impact of manure treatment technologies on reducing the nitrogen and phosphorus loading from agriculture. Furthermore, many states within the Chesapeake Bay Watershed control nutrient discharges through watershed nutrient trading programs. Tables of standard nutrient removal efficiencies of various technologies will allow states to implement these programs.

What did we do?

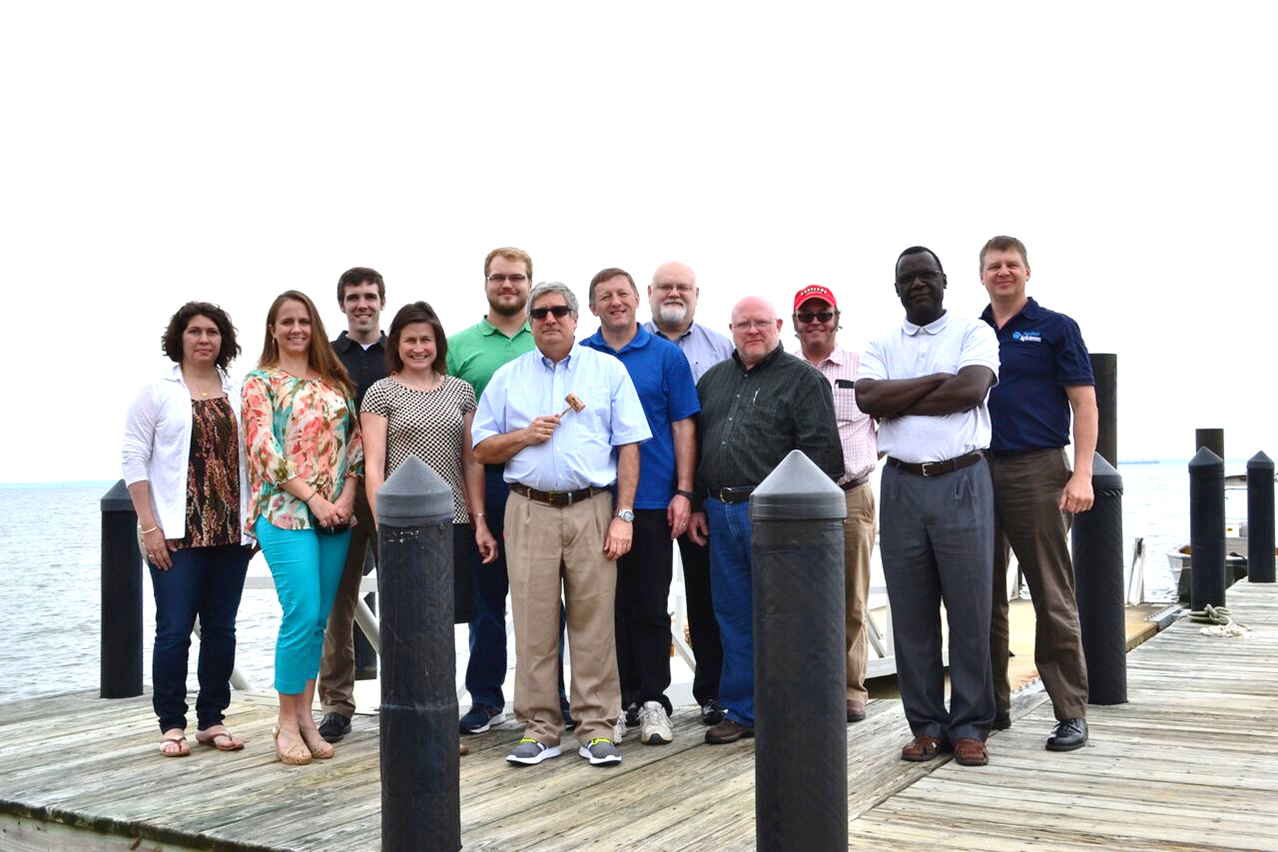
The panel standing on the dock of the Chesapeake Bay

An expert panel was convened by the EPA Chesapeake Bay Program to determine nutrient removal potential of manure treatment technologies. The following seven technology categories were reviewed: thermochemical processing, anaerobic digestion, composting, settling, mechanical solid-liquid separation, and wet chemical treatment. Within these categories, the panel defined 24 named technologies for detailed review. The scientific literature was reviewed to determine the ability of each technology to transfer volatile nitrogen to the atmosphere and transfer nutrients to a waste stream more likely to be used off-farm (or transported out of the Chesapeake Bay Watershed).

What have we learned?

Manure treatment technologies are used reduce to odors, solids, and organic matter from the manure stream, with only minor reductions in nutrient loading. The panel determined that Thermo-Chemical Processing and Composting have the potential to volatilize nitrogen, and all of the technologies have the ability to transfer nutrients into a more useful waste stream. The greatest effect of treatment technologies is the transformation of nutrients to more stable forms – such as precipitation of insoluble phosphorus from dissolved phosphorus.

Future Plans

The panel’s report is undergoing final authorization from the Chesapeake Bay Program for release to the public. Future panels may choose to revisit the issue of nutrient reduction from manure treatment technologies. The current panel recommends future panels expand the categories of technologies to include liquid aerobic treatment, and examine more named technologies as they become available within the Chesapeake Bay Watershed.

Corresponding author, title, and affiliation

Douglas W. Hamilton, Associate Professor Oklahoma State University

Corresponding author email

dhamilt@okstate.edu

Other authors

Keri Cantrell, KBC Consulting;John Chastain, Clemson University; Andrea Ludwig, University of Tennessee; Robert Meinen, Penn State University; Jactone Ogejo, Virginia Tech; Jeff Porter, USDA Natural Resource Conservation Service, Eastern Technology Suppor

Additional information

https://www.chesapeakebay.net/

http://osuwastemanage.bae.okstate.edu/

Two related presentations given at the same session at Waste to Worth 2017

Acknowledgements

Funding for this panel was provided by the US EPA Chesapeake Bay Program and Virginia Tech University through EPA Grant No. CB96326201

The authors are solely responsible for the content of these proceedings. The technical information does not necessarily reflect the official position of the sponsoring agencies or institutions represented by planning committee members, and inclusion and distribution herein does not constitute an endorsement of views expressed by the same. Printed materials included herein are not refereed publications. Citations should appear as follows. EXAMPLE: Authors. 2017. Title of presentation. Waste to Worth: Spreading Science and Solutions. Cary, NC. April 18-21, 2017. URL of this page. Accessed on: today’s date.

Poultry Mortality Freezer Units: Better BMP, Better Biosecurity, Better Bottom Line.

Proceedings Home | W2W Home w2w17 logo

Purpose

Why Tackle Mortality Management?  It’s Ripe for Revolution.

The poultry industry has enjoyed a long run of technological and scientific advancements that have led to improvements in quality and efficiency.  To ensure its hard-won prosperity continues into the future, the industry has rightly shifted its focus to sustainability.  For example, much money and effort has been expended on developing better management methods and alternative uses/destinations for poultry litter.

In contrast, little effort or money has been expended to improve routine mortality management – arguably one of the most critical aspects of every poultry operation.  In many poultry producing areas of the country, mortality management methods have not changed in decades – not since the industry was forced to shift from the longstanding practice of pit burial.  Often that shift was to composting (with mixed results at best).  For several reasons – improved biosecurity being the most important/immediate – it’s time that the industry shift again.

The shift, however, doesn’t require reinventing the wheel, i.e., mortality management can be revolutionized without developing anything revolutionary.  In fact, the mortality management practice of the future owes its existence in part to a technology that was patented exactly 20 years ago by Tyson Foods – large freezer containers designed for storing routine/daily mortality on each individual farm until the containers are later emptied and the material is hauled off the farm for disposal.

Despite having been around for two decades, the practice of using on-farm freezer units has received almost no attention.  Little has been done to promote the practice or to study or improve on the original concept, which is a shame given the increasing focus on two of its biggest advantages – biosecurity and nutrient management.

Dusting off this old BMP for a closer look has been the focus of our work – and with promising results.  The benefits of hitting the reset button on this practice couldn’t be more clear:

  1. Greatly improved biosecurity for the individual grower when compared to traditional composting;
  2. Improved biosecurity for the entire industry as more individual farms switch from composting to freezing, reducing the likelihood of wider outbreaks;
  3. Reduced operational costs for the individual poultry farm as compared to more labor-intensive practices, such as composting;
  4. Greatly reduced environmental impact as compared to other BMPs that require land application as a second step, including composting, bio-digestion and incineration; and
  5. Improved quality of life for the grower, the grower’s family and the grower’s neighbors when compared to other BMPs, such as composting and incineration.

What Did We Do?

We basically took a fresh look at all aspects of this “old” BMP, and shared our findings with various audiences.

That work included:

  1. Direct testing with our own equipment on our own poultry farm regarding
    1. Farm visitation by animals and other disease vectors,
    2. Freezer unit capacity,
    3. Power consumption, and
    4. Operational/maintenance aspects;
  2. Field trials on two pilot project farms over two years regarding
    1. Freezer unit capacity
    2. Quality of life issues for growers and neighbors,
    3. Farm visitation by animals and other disease vectors,
    4. Operational and collection/hauling aspects;
  3. Performing literature reviews and interviews regarding
    1. Farm visitation by animals and other disease vectors
    2. Pathogen/disease transmission,
    3. Biosecurity measures
    4. Nutrient management comparisons
    5. Quality of life issues for growers and neighbors
  4. Ensuring the results of the above topics/tests were communicated to
    1. Growers
    2. Integrators
    3. Legislators
    4. Environmental groups
    5. Funding agencies (state and federal)
    6. Veterinary agencies (state and federal)

What Have We Learned?

The breadth of the work at times limited the depth of any one topic’s exploration, but here is an overview of our findings:

  1. Direct testing with our own equipment on our own poultry farm regarding
    1. Farm visitation by animals and other disease vectors
      1. Farm visitation by scavenger animals, including buzzards/vultures, raccoons, foxes and feral cats, that previously dined in the composting shed daily slowly decreased and then stopped entirely about three weeks after the farm converted to freezer units.
      2. The fly population was dramatically reduced after the farm converted from composting to freezer units.  [Reduction was estimated at 80%-90%.]
    2. Freezer unit capacity
      1. The test units were carefully filled on a daily basis to replicate the size and amount of deadstock generated over the course of a full farm’s grow-out cycle.
      2. The capacity tests were repeated over several flocks to ensure we had accurate numbers for creating a capacity calculator/matrix, which has since been adopted by the USDA’s Natural Resources Conservation Service to determine the correct number of units per farm based on flock size and finish bird weight (or number of grow-out days) in connection with the agency’s cost-share program.
    3. Power consumption
      1. Power consumption was recorded daily over several flocks and under several conditions, e.g., during all four seasons and under cover versus outside and unprotected from the elements.
      2. Energy costs were higher for uncovered units and obviously varied depending on the season, but the average cost to power one unit is only 90 cents a day.  The total cost of power for the average farm (all four units) is only $92 per flock.  (See additional information for supporting documentation and charts.)
    4. Operational/maintenance aspects;
      1. It was determined that the benefits of installing the units under cover (e.g., inside a small shed or retrofitted bin composter) with a winch system to assist with emptying the units greatly outweighed the additional infrastructure costs.
      2. This greatly reduced wear and tear on the freezer component of the system during emptying, eliminated clogging of the removable filter component, as well as provided enhanced access to the unit for periodic cleaning/maintenance by a refrigeration professional.
  2. Field trials on two pilot project farms over two years regarding
    1. Freezer unit capacity
      1. After tracking two years of full farm collection/hauling data, we were able to increase the per unit capacity number in the calculator/matrix from 1,500 lbs. to 1,800 lbs., thereby reducing the number of units required per farm to satisfy that farm’s capacity needs.
    2. Quality of life issues for growers and neighbors
      1. Both farms reported improved quality of life, largely thanks to the elimination or reduction of animals, insects and smells associated with composting.
    3. Farm visitation by animals and other disease vectors
      1. Both farms reported elimination or reduction of the scavenging animals and disease-carrying insects commonly associated with composting.
    4. Operational and collection/hauling aspects
      1. With the benefit of two years of actual use in the field, we entirely re-designed the sheds used for housing the freezer units.
      2. The biggest improvements were created by turning the units so they faced each other rather than all lined up side-by-side facing outward.  (See additional information for supporting documentation and diagrams.)  This change then meant that the grower went inside the shed (and out of the elements) to load the units.  This change also provided direct access to the fork pockets, allowing for quicker emptying and replacement with a forklift.
  3. Performing literature reviews and interviews regarding
    1. Farm visitation by animals and other disease vectors
      1. More research confirming the connection between farm visitation by scavenger animals and the use of composting was recently published by the USDA National Wildlife Research Center:
        1. “Certain wildlife species may become habituated to anthropogenically modified habitats, especially those associated with abundant food resources.  Such behavior, at least in the context of multiple farms, could facilitate the movement of IAV from farm to farm if a mammal were to become infected at one farm and then travel to a second location.  …  As such, the potential intrusion of select peridomestic mammals into poultry facilities should be accounted for in biosecurity plans.”
        2. Root, J. J. et al. When fur and feather occur together: interclass transmission of avian influenza A virus from mammals to birds through common resources. Sci. Rep. 5, 14354; doi:10.1038/ srep14354 (2015) at page 6 (internal citations omitted; emphasis added).
    2. Pathogen/disease transmission,
      1. Animals and insects have long been known to be carriers of dozens of pathogens harmful to poultry – and to people.  Recently, however, the USDA National Wildlife Research Center demonstrated conclusively that mammals are not only carriers – they also can transmit avian influenza virus to birds.
        1. The study’s conclusion is particularly troubling given the number and variety of mammals and other animals that routinely visit composting sheds as demonstrated by our research using a game camera.  These same animals also routinely visit nearby waterways and other poultry farms increasing the likelihood of cross-contamination, as explained in this the video titled Farm Freezer Biosecurity Benefits.
        2. “When wildlife and poultry interact and both can carry and spread a potentially damaging agricultural pathogen, it’s cause for concern,” said research wildlife biologist Dr. Jeff Root, one of several researchers from the National Wildlife Research Center, part of the USDA-APHIS Wildlife Services program, studying the role wild mammals may play in the spread of avian influenza viruses.
    3. Biosecurity measures
      1. Every day the grower collects routine mortality and stores it inside large freezer units. After the broiler flock is caught and processed, but before the next flock is started – i.e. when no live birds are present,  a customized truck and forklift empty the freezer units and hauls away the deadstock.  During this 10- to 20- day window between flocks biosecurity is relaxed and dozens of visitors (feed trucks, litter brokers, mortality collection) are on site in preparation for the next flock.
        1. “Access will change after a production cycle,” according to a biosecurity best practices document (enclosed) from Iowa State University. “Empty buildings are temporarily considered outside of the [protected area and even] the Line of Separation is temporarily removed because there are no birds in the barn.”
    4. Nutrient management comparisons
      1. Research provided by retired extension agent Bud Malone (enclosed) provided us with the opportunity to calculate nitrogen and phosphorous numbers for on-farm mortality, and therefore, the amount of those nutrients that can be diverted from land application through the use of freezer units instead of composting.
      2. The research (contained in an enclosed presentation) also provided a comparison of the cost-effectiveness of various nutrient management BMPs – and a finding that freezing and recycling is about 90% more efficient than the average of all other ag BMPs in reducing phosphorous.
    5. Quality of life issues for growers and neighbors
      1. Local and county governments in several states have been compiling a lot of research on the various approaches for ensuring farmers and their residential neighbors can coexist peacefully.
      2. Many of the complaints have focused on the unwanted scavenger animals, including buzzards/vultures, raccoons, foxes and feral cats, as well as the smells associated with composting.
      3. The concept of utilizing sealed freezer collection units to eliminate the smells and animals associated with composting is being considered by some government agencies as an alternative to instituting deeper and deeper setbacks from property lines, which make farming operations more difficult and costly.

Future Plans

We see more work on three fronts:

  • First, we’ll continue to do monitoring and testing locally so that we may add another year or two of data to the time frames utilized initially.
  • Second, we are actively working to develop new more profitable uses for the deadstock (alternatives to rendering) that could one day further reduce the cost of mortality management for the grower.
  • Lastly, as two of the biggest advantages of this practice – biosecurity and nutrient management – garner more attention nationwide, our hope would be to see more thorough university-level research into each of the otherwise disparate topics that we were forced to cobble together to develop a broad, initial understanding of this BMP.

Corresponding author (name, title, affiliation)

Victor Clark, Co-Founder & Vice President, Legal and Government Affairs, Farm Freezers LLC and Greener Solutions LLC

Corresponding author email address

victor@farmfreezers.com

Other Authors

Terry Baker, Co-Founder & President, Farm Freezers LLC and Greener Solutions LLC

Additional Information

https://rendermagazine.com/wp-content/uploads/2019/07/Render_Oct16.pdf

Farm Freezer Biosecurity Benefits

One Night in a Composting Shed

www.farmfreezers.com

Transmission Pathways

Avian flu conditions still evolving (editorial)

USDA NRCS Conservation fact sheet Poultry Freezers

Nature.com When fur and feather occur together: interclass transmission of avian influenza A virus from mammals to birds through common resources

How Does It Work? (on-farm freezing)

Influenza infections in wild raccoons (CDC)

Collection Shed Unit specifications

Collection Unit specifications

Freezing vs Composting for Biosecurity (Render magazine)

Manure and spent litter management: HPAI biosecurity (Iowa State University)

Acknowledgements

Bud Malone, retired University of Delaware Extension poultry specialist and owner of Malone Poultry Consulting

Bill Brown, University of Delaware Extension poultry specialist, poultry grower and Delmarva Poultry Industry board member

Delaware Department of Agriculture

Delaware Nutrient Management Commission

Delaware Office of the Natural Resources Conservation Service

Maryland Office of the Natural Resources Conservation Service

The authors are solely responsible for the content of these proceedings. The technical information does not necessarily reflect the official position of the sponsoring agencies or institutions represented by planning committee members, and inclusion and distribution herein does not constitute an endorsement of views expressed by the same. Printed materials included herein are not refereed publications. Citations should appear as follows. EXAMPLE: Authors. 2017. Title of presentation. Waste to Worth: Spreading Science and Solutions. Cary, NC. April 18-21, 2017. URL of this page. Accessed on: today’s date.

Organizing demonstrations and tours for Government officials and Extension on Animal Mortality Management

Proceedings Home W2W Home w2w17 logo

Purpose

Provide some discussion on putting together Tour and Demonstration educational events. To Provide real life demonstrations and educational opportunities dealing with Mortality management.

What did we do?

The agent participated on a multi-state and multi country steering committee to organize and host an international symposium on Animal Mortality and Disposal Management. This was the 5th symposium and had 179 registered attendees from 11 different countries: Australia, Canada, China, Georgia, Korea, New Zealand, Nigeria, the UK, the US, Tunisia, and Vietnam.

The agent served as the host state coordinator (Penn), the 3 bus tour coordinator and the demonstration’s chairperson. Demonstrations included high density foaming, compost pile building and turning, environmental grinder processors, Clean Harbor Industries,  truck wash stations, and proper euthanasia with cap and bolt guns. The agent will list the success and challenges of these types of demonstrations and educational events. Results are from the 5th International Symposium on Managing Animal Mortality, Products, and By-products, and Associated Health Risk: Connecting Research, Regulations and Response at the Southeast Agricultural Research and Extension Center on Wednesday, September 30, 2015.

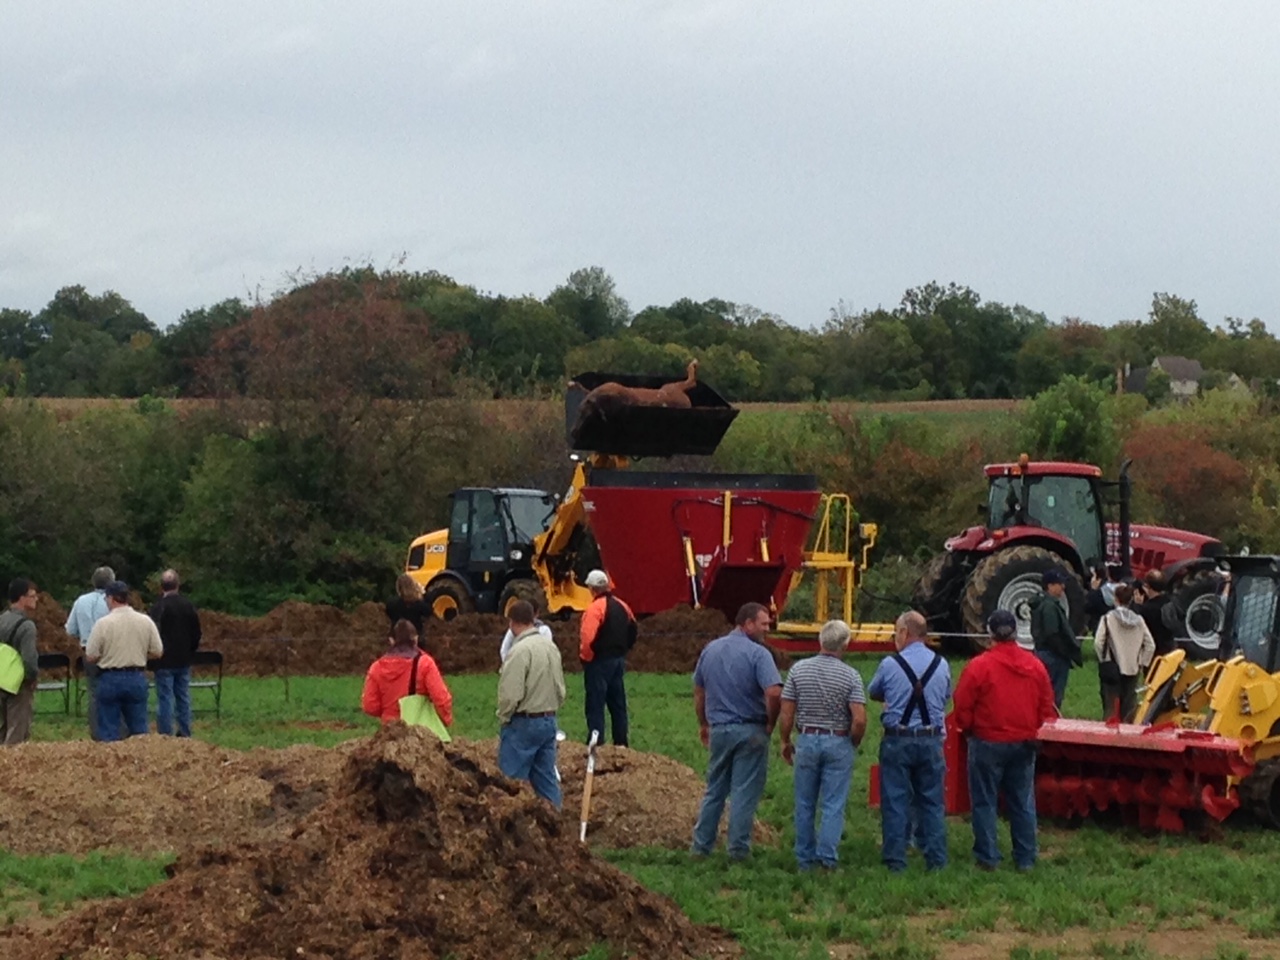
Moving horse for mortality composting
Examples of demonstrations during the field day

What have we learned?

Excellent industry tours and Farm tours and Demonstrations are an excellent learning opportunity. All Parties including Extension, Farmers, Industry and government personnel can benefit from hands on education.  Those in attendance gained skills and knowledge to be able to host their own training sessions and to be better prepared to handle animal mortality outbreaks and events in their own state.  They gained a first hand experience on pile building and related technologies for this type of event.

Demo with tractor covering mortality composting pile
Turning of a 60 day compost pile

Future Plans

The International Committee on Animal Mortality and Waste Products is a collection of University researchers and educators, State Department of Agriculture, Federal Homeland Security and Environmental Protection Agency personnel. The committee plans to meet for future International Symposiums as needed.

http://animalmortmgmt.org/symposium/contributors/

Corresponding author, title, and affiliation

J Craig Williams, County Agent, Penn State Extension

Corresponding author email

jcw17@psu.edu

Additional information

Conference website

http://animalmortmgmt.org/

The authors are solely responsible for the content of these proceedings. The technical information does not necessarily reflect the official position of the sponsoring agencies or institutions represented by planning committee members, and inclusion and distribution herein does not constitute an endorsement of views expressed by the same. Printed materials included herein are not refereed publications. Citations should appear as follows. EXAMPLE: Authors. 2017. Title of presentation. Waste to Worth: Spreading Science and Solutions. Cary, NC. April 18-21, 2017. URL of this page. Accessed on: today’s date.
Nutrient Cycling in Horse Pastures


Proceedings Home W2W Home w2w17 logo

Purpose 

This presentation will review the existing multi-species literature on nutrient cycling and how it is affected by the horse’s diet and rotational grazing.

Grazed pastures, particularly rotationally grazed pastures, recycle nutrients faster than ungrazed pastures. Nutrients on pasture land enter through animal waste, and waste feed or fertilizer; they leave through removal of forage, leaching/runoff, or animal product/waste removal. Taking away the animal component removes about half of the inputs needed to recycle the nutrients. Dietary nitrogen (N), phosphorus (P) and potassium (K) are required for basic maintenance of horses; however, not all of what is consumed is used by the animal, therefore the dietary concentrations of these nutrients will impact the nutrient cycling. Digestibility of N, P and K in horses is approximately 80, 25 and 75 %, respectively. What does not get digested will end up excreted back into the soil.

What did we do? 

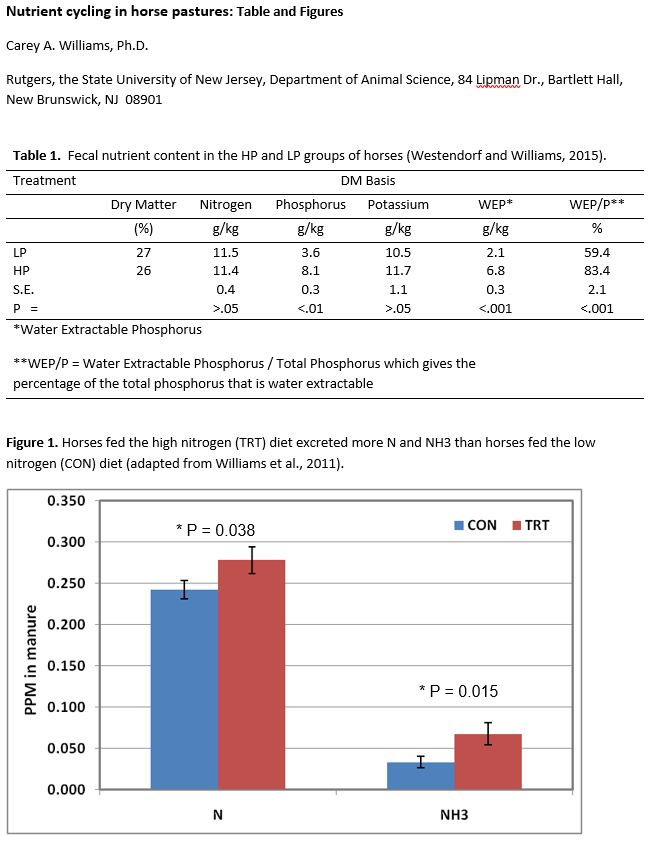
For example, in one study eight Standardbred mares were divided into two groups and received diets of grass hay and grain. The high P (HP) group received 142 g/d of NaH2PO4, formulated to provide 4.5-times the dietary P requirement, or 65 g phosphorus/d. The low P (LP) group received 28 g of phosphorus/d in the basal diet. Data showed that horses receiving the HP diet excreted higher P and water extractable P in the manure than those fed the LP diet (Table 1; Westendorf and Williams, 2015). The same goes for N, where one study used a treatment group that was supplemented with 700 g/d of soybean meal top dressed on 500 g of sweet feed per day (TRT; 1042 g protein/d DM total), while the control group received the sweet feed meals without the soybean meal (CON; 703 g protein/d total). Both groups were also fed 8 kg/d of a grass hay mix (562 g protein /d DM), water and salt ad libitum. Horses fed the TRT diet excreted more N and NH3 than horses fed the CON diet (Figure 1; Williams et al., 2011).

Nutrient Cycling in horse pastures: Tables and Figures

What have we learned? 

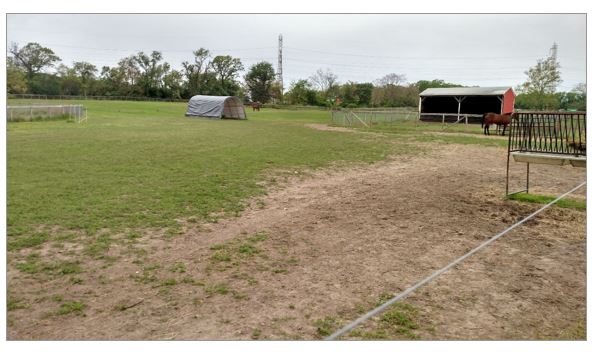
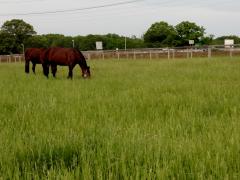
More intensive grazing also creates an increased rate of nutrient cycling due to the added animal inputs on the land. Even though no horse related studies have been performed on this topic studies in cattle have found that plant-available N levels doubled when cattle were rotationally grazed with five grazings per season instead of three (Baron et al., 2002). Kenny (2016) looked at horses grazed under either a continuous or rotational grazing system (see Pictures 1 and 2, Left to Right, respectively) and found no differences in system after one year of grazing, however, the author concludes that more time on the system could have generated differences.

Other factors that affect the rate of nutrient cycling include amount of legumes in the pasture, distribution of manure on pastures (i.e. relation to water, shelters and fencing), and use or rates of fertilizer.


Horse in pastureRotational grazing horse

Future Plans    

More equine specific studies need to be performed looking at how grazing systems and equine diets affect nutrient cycling and how horse farm owners can utilize this to best manage their farm for optimal nutrient utilization.

Corresponding author, title, and affiliation        

Carey A. Williams, Equine Extension Specialist, Rutgers, the State University of New Jersey, Department of Animal Science

Corresponding author email    

carey.williams@rutgers.edu

Additional information 

References:

Baron, V. S., E. Mapfumo, A. C. Dick, M. A. Naeth, E. K. Okine, and D. S. Chanasyk. 2002. Grazing intensity impacts on pasture carbon and nitrogen flow. J. Range Manage. 55:525-541.

Kenny, L. B. 2016. The Effects of Rotational and Continuous Grazing on Horses, Pasture Condition, and Soil Properties. Master thesis, Rutgers, the State University of New Jersey, New Brunswick, NJ.

Westendorf, M. L., and C. A. Williams. 2015. Effects of excess dietary phosphorus on fecal phosphorus excretion and water extractable phosphorus in horses. J. Equine Vet. Sci. 35:495-498. doi:10.1016/j.jevs.2015.01.020

Williams, C. A., C. Urban, and M. L. Westendorf. 2011. Dietary protein affects nitrogen and ammonia excretion in horses. J. Equine Vet. Sci. 31:305-306.


The authors are solely responsible for the content of these proceedings. The technical information does not necessarily reflect the official position of the sponsoring agencies or institutions represented by planning committee members, and inclusion and distribution herein does not constitute an endorsement of views expressed by the same. Printed materials included herein are not refereed publications. Citations should appear as follows. EXAMPLE: Authors. 2017. Title of presentation. Waste to Worth: Spreading Science and Solutions. Cary, NC. April 18-21, 2017. URL of this page. Accessed on: today’s date.

Closing Abandoned Livestock Lagoons Effectively to Utilize Nutrients and Avoid Environmental Problems

Proceedings Home W2W Home w2w17 logo

Purpose

In Nebraska alone, nearly 400 earthen manure storage structures are in operation; approximately four dozen requests to cease operation of permitted lagoons were received by the Nebraska Department of Environmental Quality in the prior decade with many more non-permitted storage structures being in need of proper closure. Abandoned livestock lagoons, earthen manure storage basins, and other manure storages (e.g. concrete pits) need to be decommissioned in a manner that controls potential environmental risk and makes economical use of accumulated nutrients. Currently, limited guidance is available to support lagoon closure planning and implementation and few professionals who support livestock producers have experience planning or participating in the manure storage closure process. The main focus of this project was to produce two videos that document the processes for planning and executing a lagoon closure.

What did we do?

The University of Nebraska Haskell Ag Laboratory, located near Concord, NE, had an anaerobic lagoon that was operated for over 20 years, but has not received swine manure additions since 2009 when the swine unit was depopulated. The decommissioning of this storage structure was proposed in 2014 and provided our team an opportunity to plan, implement and document the procedures necessary to properly close this structure. When we went to find material on how to accomplish this properly, we did not find suitable material. Two grants were secured in 2016 from the U.S. Pork Center of Excellence (USPCE) to fund our team efforts to document the closure process – from planning to completion – with two separate videos. The first video is focused on the planning activities necessary to prepare for removal and utilization of stored liquid and sludge. The second is focused on the liquid and sludge removal and utilization activities, decommissioning of conveyance structures, and deconstruction of the lagoon berm to return the site to a natural grade.

Activities conducted to execute the lagoon closure have included:

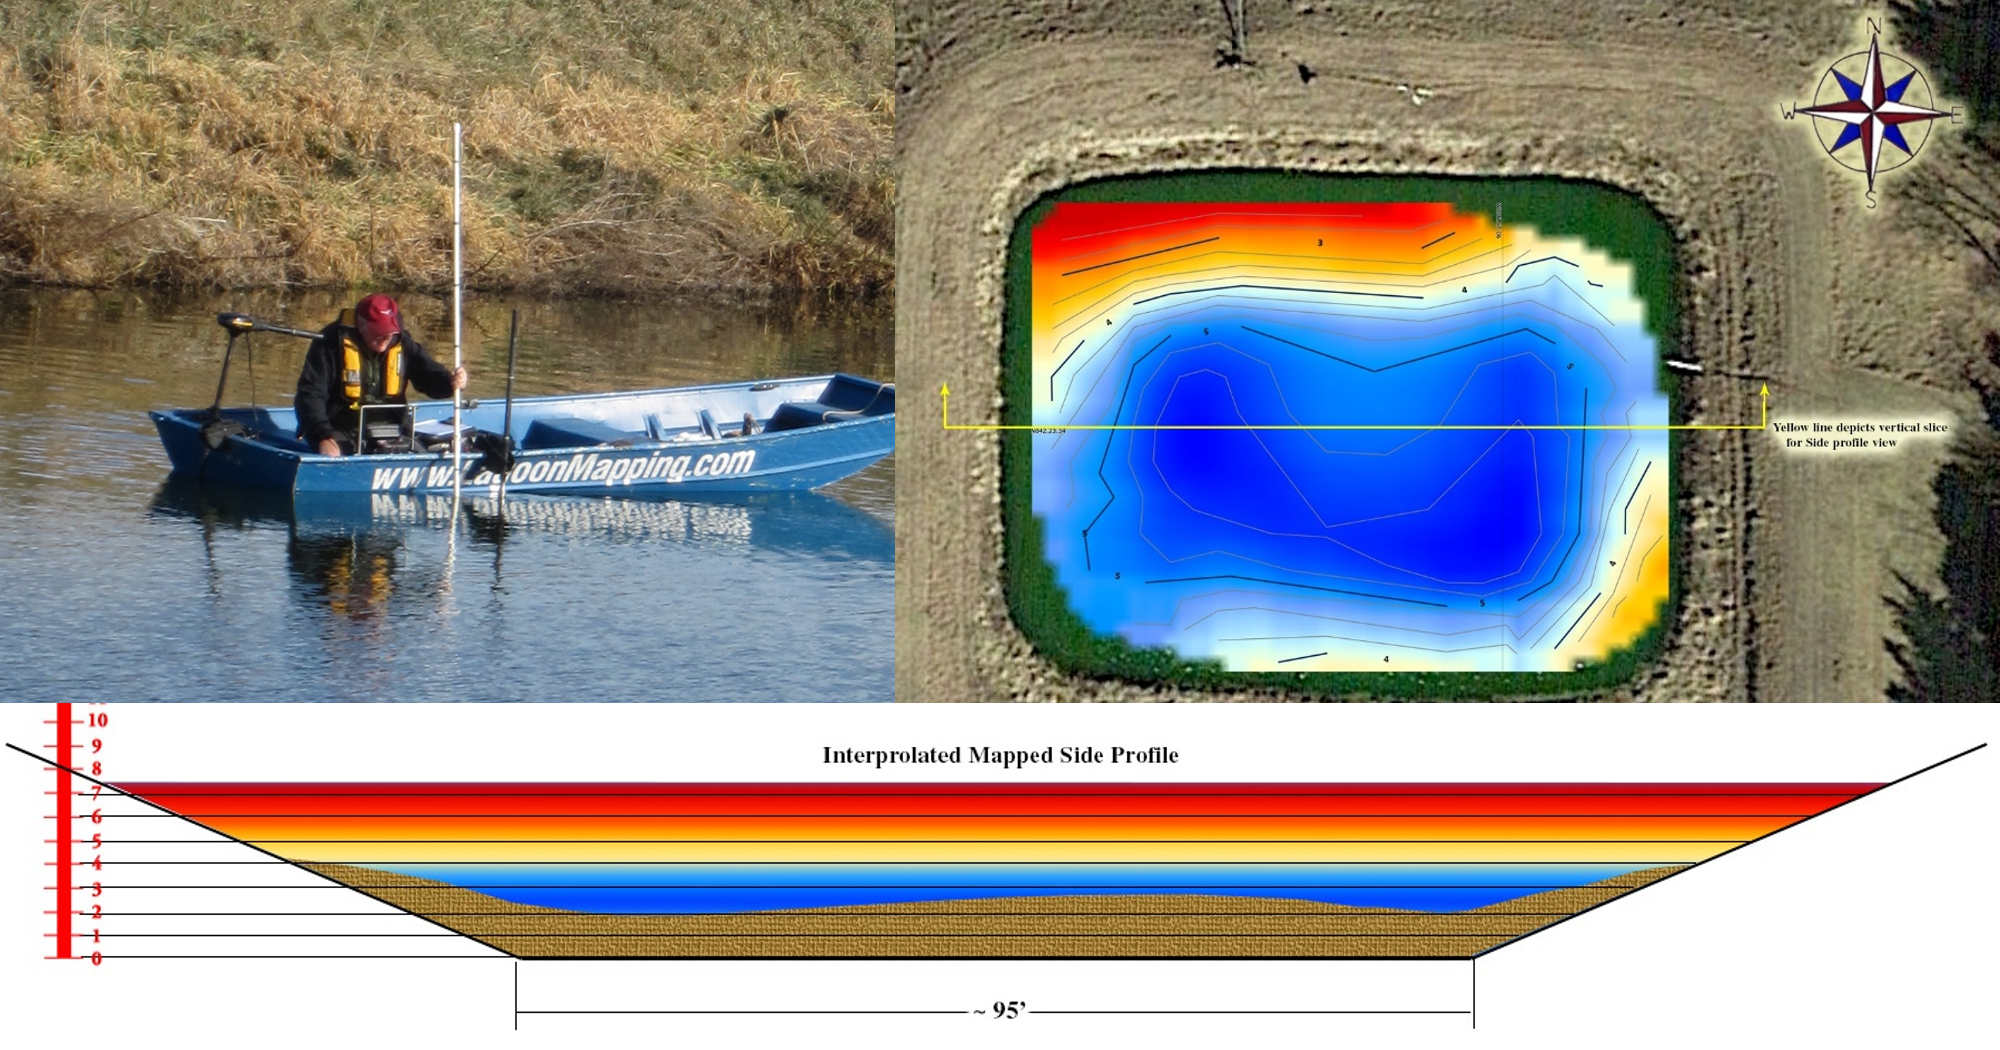
1) Mapping of sludge levels with sonar and analyzing sludge samples to estimate volume and nutrient content of sludge, which enabled development of a land application plan for utilizing the products

Figure 1. Sonar sludge mapping

Figure 1. Sonar sludge mapping.

2) De-watering the lagoon (effluent used for sprinkler irrigation and flood irrigation)

3) Hosting a demonstration event during which participants:

a. observed sludge removal and land application processes,

b. participated in a manure spreader calibration,

c. inspected the soil beneath the lagoon liner,

d. viewed the abandoned production buildings and heard about options for eliminating conveyance of liquid from the building to the lagoon,

e. explored alternative sludge removal methods, and

f. participated in a classroom session where presenters shared details of the closure planning process, cost-share opportunities for closure of manure storage structures, and expectations for re-grading and re-seeding the site following removal of sludge.

Figure 2. Participants learned about planning land application of the sludge

Figure 2. Participants learned about planning land application of the sludge.

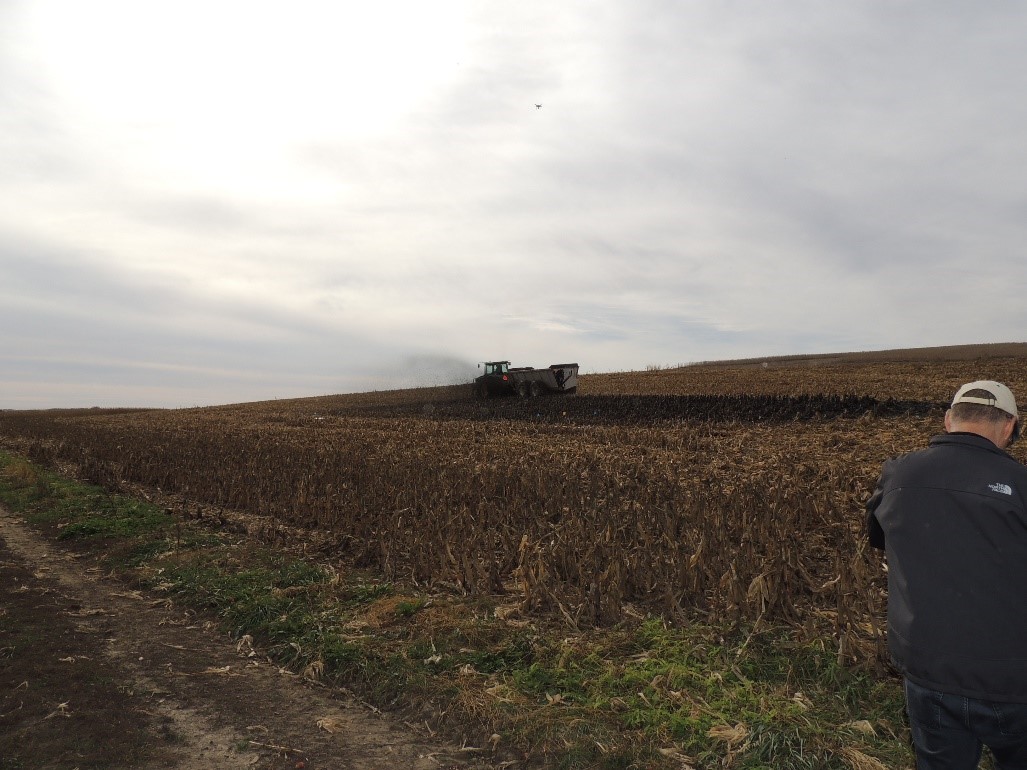
Figure 3. Land application of the sludge and calibration of the manure spreader

Figure 3. Land application of the sludge and calibration of the manure spreader.

4) Removing the sludge and applying it to cropland following the demonstration event.

Documentation of all planning, demonstration, and closure execution activities have been captured via extensive video footage, still photos, and participant interviews. Production of the videos is in process with completion and release of videos anticipated in summer 2017.

What have we learned?

Although every manure storage closure process is expected to present its own unique challenges and opportunities for learning, the process documented during this project has provided a number of insights:

1) While this process involved pumping liquid from the lagoon prior to attempting sludge removal in order to observe the sludge layer and document the volume present, a more appropriate, and likely more effective, process is to agitate the storage prior to and during pumping activities to enable handling all of the material as a slurry;

2) Dewatered sludge volume (nearly 200,000 gallons) and nutrient content (44.2 lbs. TKN, 37.5 lbs. organic N, 89.3 lbs. P2O5 and 7.6 lbs. K2O per 1,000 gallons) for this system yielded enough nutrients to apply to 80-100 acres, based on a phosphorus removal rate. It is unknown what the release of the organic N component of the sludge will be, but using just the phosphorus content, application of 1000 gallons per acre would provide enough phosphorus for what would be removed from 220 bushels of corn, which is worth approximately $35 with winter 2017 prices.;

3) Given the high phosphorus content in the sludge and that the nearby fields at the Haskell Ag Lab were not in need of phosphorus, an appropriate application rate for the sludge was determined as 8-10 tons/acre;

4) Soil beneath the lagoon liner yielded a phosphorus concentration of 556 ppm, likely a result of an inadequate liner in the lagoon as originally constructed in the 1960s; and

5) Installation of a bentonite clay liner during renovation of the structure in 1992 appeared to be effective as the liner was fully intact when observed during closure activities.

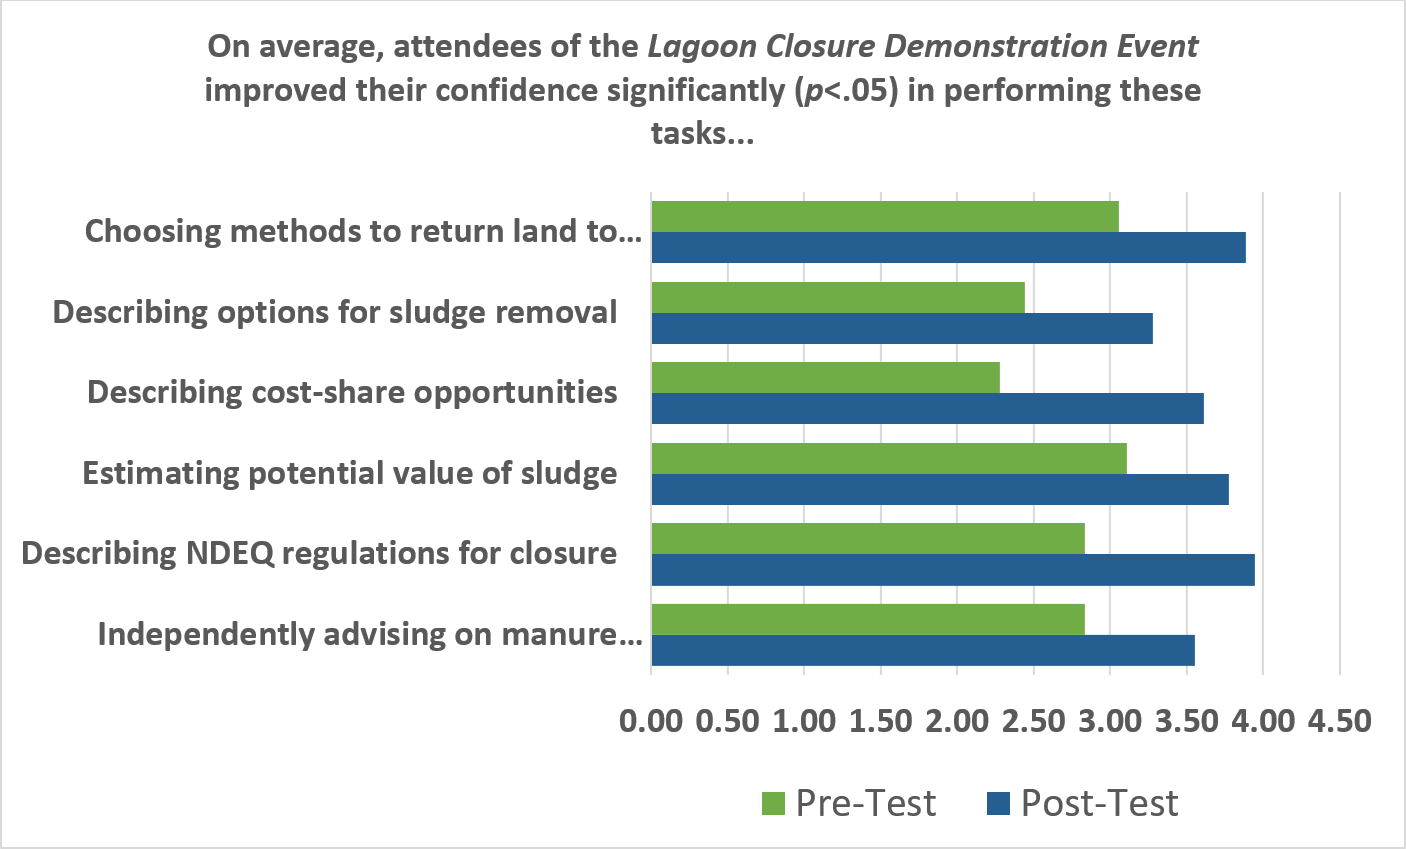
Pre-post surveys completed by 33 attendees of the demonstration event revealed that attendees improved their confidence in performing six key tasks identified by the team as being impactful. Results are summarized in Figure 4.

Figure 4. Impacts of the lagoon closure demonstration event

Figure 4. Impacts of the lagoon closure demonstration event.

Future Plans

We plan to continue the decommissioning process by:

1) Completing sludge removal and application to cropland;

2) Deconstructing the berms, leaving the liner intact, and returning the area to natural grade;

3) Seeding the area to establish ground cover and mitigate runoff and erosion; and

4) Plugging the inlet pipes in manure pits within the animal housing in lieu of removing buried conveyance pipes.

The two videos are in production and will be made available through the Pork Information Gateway (www.porkgateway.org) during summer 2017.

Corresponding author, title, and affiliation

Leslie Johnson, Research Technologist, University of Nebraska – Lincoln

Corresponding author email

ljohnson13@unl.edu

Other authors

Charles Shapiro and Amy Schmidt, University of Nebraska – Lincoln

Additional information

https://water.unl.edu/article/animal-manure-management/lagoon-closure-and-your-environmental-responsibility

Acknowledgements

The authors would like to recognize the U.S. Pork Center of Excellence (USPCE) for funding the development of the videos documenting this process and enabling us to complete this project. We would also like to acknowledge that without the support of the industry, who provided equipment and advice, we would not have been able to get this project off the ground. Also a special thanks to the Agricultural Research Division for their support.