Most farms are on a continuous journey of environmental stewardship. This journey includes voluntary and regulatory pathways (e.g., programs, regulations) and checkpoints (e.g., certifications, production goals). Industry initiatives like the Net Zero Initiative (US Dairy) and Pork Cares (National Pork Board) provide goals that serve as destination descriptions, motivating collective action amongst their farms. However, industry initiatives do not dictate which mitigation actions can serve as the route. Every farm has a unique starting point in the present, and there are many pathways for the future that can be illuminated, shaped and supported by advisors.
This workshop was designed to provide the advisor community insights on opportunities to support the industries’ sustainability commitments through data, methods, and tools related to mitigation adoption. The desired outcome was to accelerate adoption by strengthening a community of support for sustainability initiative practices.
What Did We Do?
This workshop used multiple formats to engage participants in discussion and ideation, recognizing there is a need not only for purposeful planning, but also for quick action. There were brief introductions to a suite of tools and resources that support on-farm decision-making, and opportunities for crowd-sourcing additional material. Collective discussions charted networks and roles for advisors to support farmers in the implementation process for select scenarios. Activities considered both one-on-one advisor-advisee relationships, as well as the role of advisors within a broader network of actors involved in sustainability initiatives. The workshop culminated in identifying basic, finite steps for the promotion of action.
What Have We Learned?
The workshop content supports advisors for all types of livestock farms, but draws heavily from experiences in the swine and dairy industries. In extension work, we observed that advisors can serve as connectors, motivators, and informers. We noticed that exploring options for mitigation pathways can require a variety of advisor services.
Summary of Workshop Findings
Following the workshop, an accessible guide of resources to support participants and LPELC community members was compiled, available here:
This workshop is supported by Multistate Project S1074 – Fostering Technologies, Metrics, and Behaviors for Sustainable Advances in Animal Agriculture. This workshop benefitted from supporting materials provided by National Pork Board and the National Milk Producers Federation Farmers Assuring Responsible Management Program.
The authors are solely responsible for the content of these proceedings. The technical information does not necessarily reflect the official position of the sponsoring agencies or institutions represented by planning committee members, and inclusion and distribution herein does not constitute an endorsement of views expressed by the same. Printed materials included herein are not refereed publications. Citations should appear as follows. EXAMPLE: Authors. 2025. Title of presentation. Waste to Worth. Boise, ID. April 7-11, 2025. URL of this page. Accessed on: today’s date.
Environmental assessments are core to sustainability initiatives in several livestock sectors. For example, the Farmers Assuring Responsible Management Environmental Stewardship Program and the National Pork Board’s On-Farm Sustainability Reports support dairy and swine farms, respectively, in documenting baselines and improving environmental performance. Although many farms have a long history of environmental stewardship, farms may have limited experience in quantifying and communicating about farm environmental performance. In these cases, an environmental stewardship assessment or other evaluation can be an opportunity to learn about sustainability metrics and discuss their farm impacts. Farms, advisors, processors, and other stakeholders share responsibility in conducting and responding to environmental assessments. Uniquely, advisors and educators can build value in environmental assessment processes by assisting stakeholders in interpreting and communicating results.
What Did We Do?
To improve the translation from assessments to action, we designed a cross-institutional extension program for farmers and advisors in 2023. This W2W workshop shared key findings from this extension program by immersing participants in similar activities. The workshop included two parts. In Part I “Understanding environmental assessment models,” participants discussed fictional assessment results–reviewing inputs, then outputs, then discussing unknowns to the calculation processes. In Part II “Your role in assessment processes,” participants developed an action plan for incorporating environmental assessments into their own advising and professional work through facilitator-guided ideation activities. In summary, our workshop sought to empower participants to: 1) accurately interpret and explain the results of an environmental assessment; 2) develop strategies for incorporating environmental assessment results into their professional activities; 3) build confidence in initiating and leading discussions on environmental sustainability assessments.
What Have We Learned?
In brief, based on the perspectives of farmers and advisors in our Fall 2023 focus groups, an advisor can recognize:
Environmental assessments and reports can be relatively simple;
Assessments will not capture all the specifics for every farm;
Assessments enumerate key environmental indicators (greenhouse gases and energy consumption), and this can help processors and retailers sell more animal products;
More support, beyond an assessment, is needed to inform on-farm decision-making.
These acknowledgments are a starting point to establish a common understanding between advisors and others involved in environmental assessment processes.
Summary of Workshop Findings
This workshop generated ideas that we collected into a summary document to distribute to the broader community of Livestock and Poultry Environmental educators and advisors, available below:
We thank Midwest Dairy for supporting the original work. Additionally, we are grateful to participants in these focus groups and surveys for sharing their experiences. This workshop benefitted from supporting materials provided by National Pork Board and the National Milk Producers Federation Farmers Assuring Responsible Management Program.
The authors are solely responsible for the content of these proceedings. The technical information does not necessarily reflect the official position of the sponsoring agencies or institutions represented by planning committee members, and inclusion and distribution herein does not constitute an endorsement of views expressed by the same. Printed materials included herein are not refereed publications. Citations should appear as follows. EXAMPLE: Authors. 2025. Title of presentation. Waste to Worth. Boise, ID. April 7-11, 2025. URL of this page. Accessed on: today’s date.
We are always looking for articles to include in our monthly newsletter, so we created a form to make submission easier. Send an article related to some aspect of animal agriculture and environmental stewardship. All we need is the author, title, and link to the article so we can review it and put in the newsletter. Fill the form out below or go to https://forms.gle/rzQTRVfRzeE1baMh9.
Dairy farming is known to emit greenhouse gases (GHG), both from direct and indirect emission sources. Carbon dioxide (CO2) is emitted from the combustion of deep sequestered fossil fuel while non/temporarily sequestered, biologically mediated, methane (CH4) and nitrous oxide (N2O) are emitted by various sources, most notably by cattle, feed production, and manure management.
Dairy farmers and their key advisors, the balance of the dairy value chain, policy makers, government officials, non-governmental organizations (NGOs), and astute consumers value best available information about the greenhouse gas (GHG) emissions associated with milk production. In 2020, the Innovation Center for US Dairy (IC) set three 2050 environmental stewardship goals spanning from cradle to processor gate (i.e., milk production and milk processing), including GHG neutrality. Further, the IC committed to outwardly reporting on progress towards the goals every five years starting in 2025.
What Did We Do?
Work focused on the cradle to farm gate (milk production) segment of the overall GHG neutrality goal. A list of considerations deemed important to conduct a robust US dairy GHG analysis was developed and evaluated. The most important key considerations determined were geographic-driven factors and assessment focused approach (i.e., sampling farm population, not sampling). Boundaries for the four areas making up a cradle to farm gate categories for analysis – Cattle (Enteric), Feed, Manure, and Energy – were developed based in part on understanding of where available data is housed and managed by farmers and their custom operators and following Life Cycle Assessment (LCA) practices.
What Have We Learned?
The most important lesson learned was that sampling a farm population and scaling results to represent the US dairy industry GHG emission footprint cannot be used for multiple reasons. First, classical statistics requires a sample needs to be normally distributed about the mean – herd size is not normally distributed among farm size, 80 % cows owned by 20% of the farms and milk production is higher, between 3,000 and 5,000 lbs./cow annually, for larger herds. Second, the data needed from every farm doesn’t exist today. Third, random sampling of MILK and COWS is required, however, farmers are surveyed. Fourth, accurate emission results require a percentage of cows surveyed and the percentage of milk surveyed to be the same; however, the estimated probably is less than 0.0001 that this would occur (once in every 10,000 years if annual surveys were conducted). Lastly, analysis showed that unavoidable and unpredictable error resulted when scaling up sample analysis results to the US dairy population, meaning that a reported carbon dioxide equivalent (CO2e) value would have tremendous uncertainty in direction and magnitude. This is especially challenging when measuring progress toward the 2050 GHG neutrality goal; a population sampling and scaling based approached can result in higher calculated emissions in five years over a current value, even though many farms made notable changes to reduce GHG emissions.
Leaders of the US dairy industry were educated on the challenges of farm sampling and scaling. As a result, the decision was made to approach quantification of the progress toward the 2050 GHG neutrality goal using an approach that removes the need for scaling. That approach is called USDA Cow and Milk Data Focused approach.
Future Plans
Measurement of US dairy’s progress towards its 2050 GHG neutrality goal will be made using the USDA Cow and Milk Data Focused approach; first report on progress due in 2025.
Authors
Curt A. Gooch, Sustainable Dairy Product Owner, Land O’Lakes – Truterra
Roger Cady, Freelance Sustainability Consultant (Retired from industry)
Acknowledgements
Dairy Management Incorporated and the Innovation Center for US Dairy Environmental Stewardship Committee
The authors are solely responsible for the content of these proceedings. The technical information does not necessarily reflect the official position of the sponsoring agencies or institutions represented by planning committee members, and inclusion and distribution herein does not constitute an endorsement of views expressed by the same. Printed materials included herein are not refereed publications. Citations should appear as follows. EXAMPLE: Authors. 2022. Title of presentation. Waste to Worth. Oregon, OH. April 18-22, 2022. URL of this page. Accessed on: today’s date.
The animal agriculture industry is widespread across the U.S. with some areas having more of certain types of farms than others. The sectors highlighted in this module include dairy, beef cattle, layer chickens (eggs), meat chickens (broilers), and pigs.
The images below shows where each of the five highlighted sectors are located in the U.S. The darker colors on each map indicate more animals in that area. These maps are based on the most recent (2012) Census of Agriculture, which is conducted every five years by the USDA National Agriculture Statistics Service.
Trends In Animal Agriculture
The graphs below show data from the USDA Census of Agriculture from 1987 until the most recent one (2012).
For dairy and beef cattle, you can see clear trends showing that the number of animals is declining slightly but the number of farms is declining drastically. This means that the average farm with cattle in 2012 had many more animals than the average cattle farm in 1987. In each graph, the orange line represents the number of animals and the blue line represents the number of farms.
For pigs, the number of animals has increased slightly and the number of farms has decreased a lot. Like with cattle, this means that the average pig farm in 2012 had many more animals than the average farm in 1987. Chickens show a different trend in that the number of birds in the U.S. has increased but the number of farms has also increased.
How Much Manure Do Animals Produce?
The amount of manure animals produce varies greatly based on species; a dairy cow will produce much more manure than a chicken, for example. Two cows can excrete very different amounts of manure based on the feed they eat, their size, and age. The same is true of chickens and pigs.
The U.S. Department of Agriculture Natural Resources Conservation Service (NRCS) estimates that for every 1000 pounds of body weight, most common farm animals will excrete between 60 and 80 pounds of manure per day (source). Based on those numbers a 1400 pound dairy cow will excrete 112 pounds of manure and a layer hen will excrete around 1/3 of a pound of manure per day.
The American Society of Agricultural and Biological Engineers (ASABE) released standard D384.2 “Manure Production and Characteristics” in 2005. Table 1 and Table 2 of that standard provide numbers that are similar to the NRCS manure production estimates. The ASABE standard estimates that a layer hen will excrete 0.19 pounds of manure per day and a dairy cow (weight not specified) will excrete 150 pounds per day.
The amount of manure an animal excretes is not necessarily the same amount that farms collect or store. For animals housed in open lots, manure dries considerably as it lays on the surface of the pen. For example, a feedlot steer may excrete 80 or 90 pounds of manure per day, but after that manure has dried on the pen surface, the farm may only end up with 8 or 9 pounds of manure to collect. The same goes for layer hen manure on manure belts or in storage structures.
For animals housed in barns with flush systems, the total volume will include animal manure, wasted feed and water, and water used for the flush system.
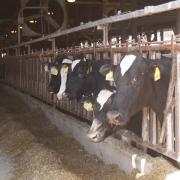
How Has Manure Management Changed?
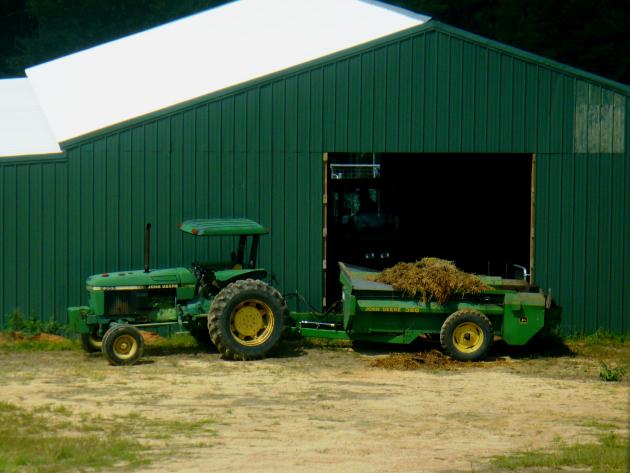
In decades past, most farms handled manure as a solid* material, often mixed with bedding, and hauled the manure and bedding out to a field regularly, referred to as “daily haul”. Photos 1 and 2 (below) show what a daily haul system looks like.
Photo 1. (Above) A spreader being loaded with manure directly from the barn.
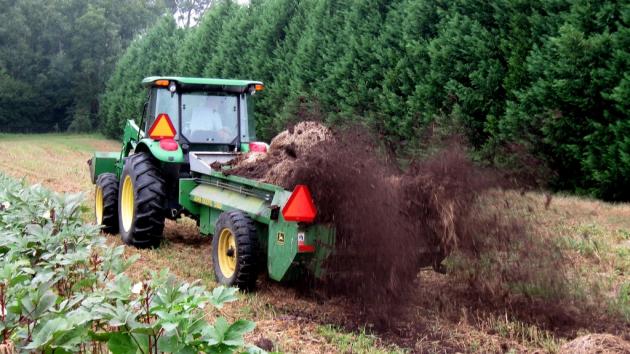
Photo 2. (Above) Spreading manure in a recently harvested field. Photos 1 and 2 are courtesy of Anne Cumbie Randle.
As farms have grown larger, and technologies improve, more manure is being handled as a slurry or liquid* — especially on dairy and pig farms. Beef cattle feedlots, and layer chicken and broiler farms mostly handle manure as a solid.
The volume of manure generated on many modern animal feeding operations necessitates storing manure in engineered structures. Manure storage has become a more visible feature on farms compared to past decades.
The primary purpose of storage systems is to provide a place to contain manure so that farmers can apply manure to fields at times when nutrients can best be utilized by crops and thereby avoid applying it to fields at inappropriate times such as when soils are frozen, snow-covered or saturated. Avoiding these times reduces the risk of runoff to water and soil compaction. Also, while not yet common, manure treatment systems that generate renewable energy or process manure for other value-added products start with storage.
* Solid manure is generally at least 20% solids and 80% or less moisture but can be stacked and piled. Liquid manure is usually 5% solids and 95% or more moisture. Slurry manure is in between. Both slurry and liquid manure are moved via pumps. (See Figure 1 on page 11 of LPES Lesson 20).
The Basics of Manure Management
The components of a manure management system include:
Collection. How much manure is produced by the animals on the farm? How will the farm gather manure for storage?
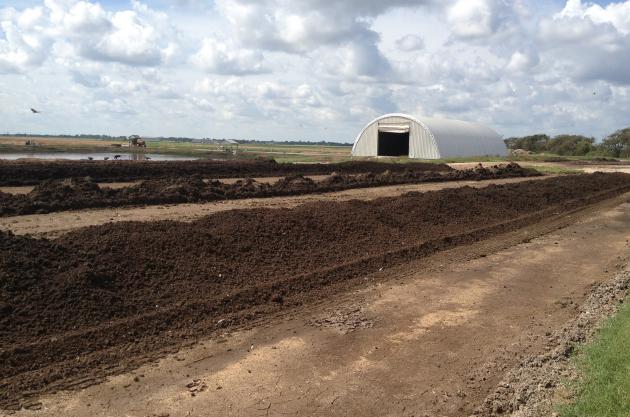
Storage. How will the manure be contained until it can be used or treated? Photos 1-3 below show some examples of manure storage.
Treatment. Not all systems are designed to include manure treatment. Treatment systems tend to be very expensive, but they can lead to new uses for manure or new revenue streams for the farm. Anaerobic or aerobic lagoons, composting, anaerobic digestion, vermicomposting, and thermal technologies are examples of manure treatment.
Transport. How will the manure be moved from the storage structure to the field or to its intended use?
Utilization. Manure has many beneficial uses. The most common use (by far) is land application as a plant fertilizer.
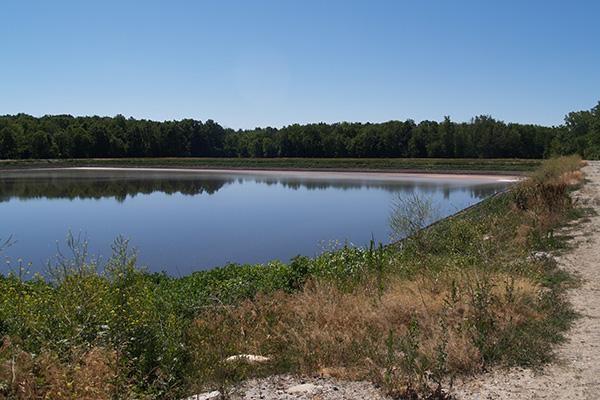
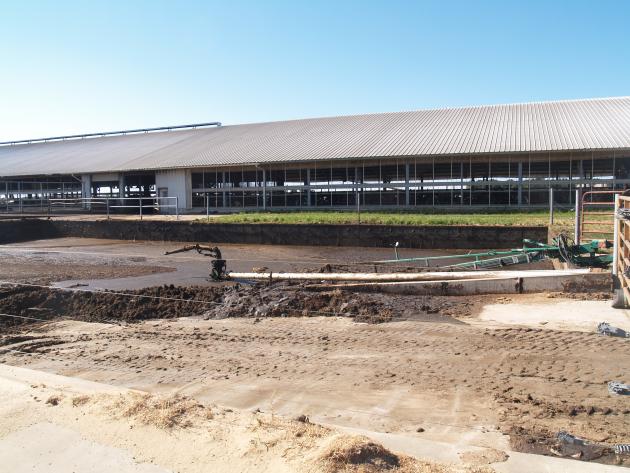
Photo 1. (Above) An earthen liquid manure storage structure. Ideally, this type of manure storage would have a marker installed that indicates when the liquid level reaches the maximum design limit (a depth that provides enough capacity to store the expected volume of wastewater plus a margin of safety in case of a large rainfall or prolonged period of bad weather that prevents pumping out to a field). Photo courtesy of Tetra Tech.
Photo 2. (Above) A storage area for solid manure. It is important that any runoff from this area is captured and contained. Photo courtesy of Saqib Mukhtar, University of Florida.
Photo 3. (Above) A concrete storage structure for slurry manure on a dairy farm. The ramp in the foreground allows access to remove accumulated solids.
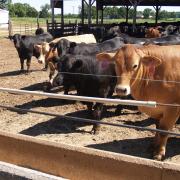
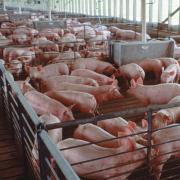
A Look at Five Different Types of Animal Agriculture
Click on a photo to start a short virtual tour showing the outside, inside, and basic manure handling and storage practices on layer, beef, pig, dairy, and broiler farms. These tours discuss typical manure collection intervals and practices along with typical storage facilities and management. Links to additional resources are provided throughout the text and at the end of each tour.
For the fun activity below, use the scroll bar at the right of the frame to move down and show the “continue” or “submit” buttons if they do not appear.
These materials were developed by the Livestock and Poultry Environmental Learning Center (LPELC) with funding from the U.S. Environmental Protection Agency and with input from the Natural Resources Conservation Service, National Cattlemen’s Beef Association, National Milk Producers Federation, National Pork Board, United Egg Producers, and U.S. Poultry and Egg Association.
For questions on these materials, contact Jill Heemstra, jheemstra@unl.edu. All images in this module, unless indicated otherwise, were provided by Jill.
Reviewers: Tetra Tech, Inc.; Mark Risse, University of Georgia; Leslie Johnson, University of Nebraska; Bill Couser, Couser Cattle; Tom Hebert, Bayard Ridge Group; Glenn Carpenter, USDA NRCS; Joe Harrison, Washington State University; and Jace Thornton, National Cattlemen’s Beef Association
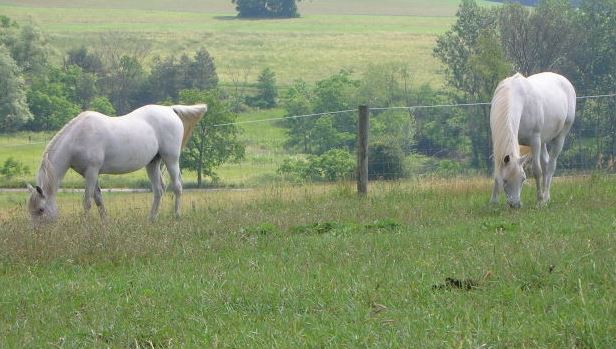
In Pennsylvania there has been an increased emphasis on farm and nutrient management practices on equine operations due to expansion of environmental regulations. Of the 31,000 operations which house horses in Pennsylvania, 23,250 are non-commercial operations and over 75 percent are on limited acreage, requiring intensive management. Managers of equine operations frequently do not have agricultural backgrounds and need assistance with farm management plans. Proper management of equine operations requires a series of complementing Best Management Practices (BMPs) that implement strategies to preserve pasture vegetative cover, to balance nutrient production with nutrient utilization, to properly manage excess manure nutrients, and to manage equine operations for minimal release of sediment.
This environmental program was developed to identify needed BMPs for the equine industry and help farm mangers understand, select, and implement sustainable farm management practices. The program consisted of three components: Documentation of existing practices and conditions on equine operations, educational outreach to increase knowledge and skills, and on-farm implementation of BMPs. These three projects covering 2009-2015, measured sediment and nutrient losses, for high density horse operations; and recorded environmentally sound farm management practices.
What did we do?
Project 1- documented conservation and farm management practices on 23 equine operations, quantitatively evaluated pasture desirable plants and canopy cover, sampled feed, hay and soil, and conducted nutrient management audits. Pasture data, collected using line point transect methodology, included calculation of percent canopy cover, basal stems and desirable forage. The 23 surveyed operations were used to develop a baseline for total nutrient balances and levels for the Pennsylvania horse industry.
Project 2- looked at nitrogen and phosphorus inputs on 14 farms to determine the risk of horse farms for non-point source pollution. Over a 12 months period, amounts of imported fertilizer, hay, concentrate feed, and bedding were obtained from farm managers. Samples of hay, concentrate feed, and bedding were taken from each farm and analyzed for N and P. Whole farm nutrient balance was calculated as a percent by the equation ((imported nutrients- exported nutrients) /imported nutrients) X 100. Nitrogen and P whole farm balances were recorded as a percentage basis for the total farm and on a kilogram basis for per animal unit and per hectare values. PROC SURVEYMEANS was used to determine descriptive statistics on the sample and whole farm balance values.
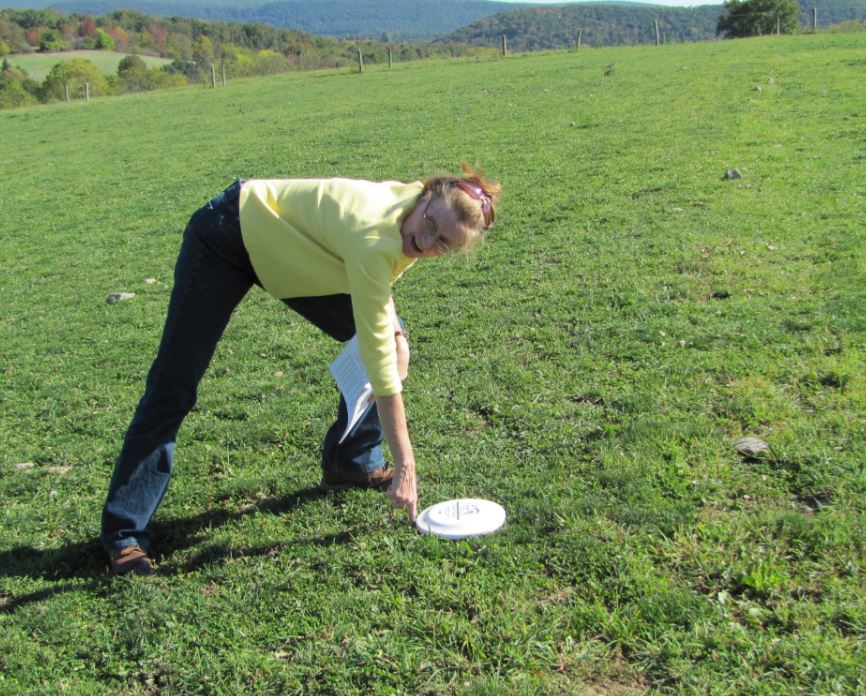
Project 3- involved 95 farm operations (1,086.90 ac.) in a project designed to implement practices to increase canopy cover and desirable forages in pastures and reduce nutrient and sediment loss. The team provided individual assistance to help owners locate resources, technical assistance and funding. All farm managers (n=95) farms were visited documenting conservation/management practices, BMPs already in place and identification of areas of concern/improvement needs. The team finalized field farm survey instruments, quantitatively documented pasture plants/canopy cover, sampled feed/hay/soil, and conducted nutrient management audits. Pasture data was collected using line point intercept and Equine Pasture Evaluation Disc methodology. All plant species were documented with pasture condition scores generated using pasture condition score sheets.
Out of the 95 farms visited, a total of 43 farm (744.55 ac. collectively), pastures were targeted for improvement, soil tested and prepared for methods to improve the pasture grass stands. Farms selected to reseed pastures were provided with a seed mix that was custom blended for their farm based on soil conditions, farm management, pasture needs and level of use.
Twenty-seven of the farms conducted reseeding using a no-till drill, 8 farms utilized conventional plowing and 8 farms utilized broadcasting and/or frost seeding. The remaining 48 farms did not need to reseed and instead received recommendations on methods to improve and manage existing forage quality through improving or utilizing BMPs. Four farms did not continue involvement in the program after the initial farm visit by the team.
What have we learned?
Project 1- The surveyed farms have helped to validate and evaluate existing tools on horse operations. The “pasture sediment loss” tools used (at that time) in this project (PA RUSLE2, Pasture Condition Score, Nutrient Balancing, Pasture Nutrient Balancing sheets and PA Phosphorous-Index) helped to analyze the cost-effectiveness and sustainability of the nutrient reduction strategies. The survey results have shown that these selected tools need to be adjusted in order to properly measure sediment and soil loses on horse farms.
Smaller farm operators reported a major hurdle to managing pastures is lack of knowledge and lack of equipment. In addition, 33% of farm managers reported they wanted to utilize the suggested practices, but required financial assistance or more technical information.
Results of the information gathered by the Equine Environmental Stewardship (EES) team projects has been used and examined by state agencies, assisting in development of in-service training for their personnel, used in revising potential regulations and assistance concerning horse farm operations.
Study 2- The majority of the horses on the farms were non-breeding horses, which the only managed output was manure. Four of the farms did not export any manure, 3 exported a small portion of their collected manure and 6 exported all their collected manure. Whole farm balance inputs averaged 53 kg N per 1000 lbs of animal (AU) and 13 kg P/AU. Whole farm balances ranged from 100% retention of imported nutrients where no products were exported to a negative balance where all collected manure was exported. Average N and P whole farm balances were 73% and 51% retention of inputs, respectively. With limited export of nutrients from horse farms as foals or manure, more manure must be exported and/or nutrient imports must be decreased to approach nutrient balance and decrease the risk of nutrient pollution.
Project 3- Out of the 95 farms visited, a total of 43 farms (representing 744.5 acres) were reseeded. Twenty farms needed to utilize the no-till drill purchased through the project grant. Pastures chosen for reseeding had low forage yields and canopy covers less than 50%. After reseeding the pastures, yields increased to 1.0 to 2.0 tons per acre resulting in an economic gain that averaged $450 to $600 per acre.
In conclusion: The Team noted that farm owners are committed to adopting practices that maintain healthy horses, healthy farms, and a healthy environment. Each of the farms listed worked with the Equine Team to select and implement one or more Best Management Practices (BMPs) on their farm. BMP’s were chosen to increase pasture canopy cover and improve pasture quality, proper composting and or disposal of manure, and ration formulation. Practicing rotational grazing, utilizing sacrifice areas, soil testing and applying lime and fertilizers are BMPs farmers were encouraged to adopt.
Future Plans
The survey results are being used in the development of the curriculum for Environmental Stewardship short courses, to help agency personnel understand the equine industry and to help farm owners develop the knowledge and skills necessary to adopt environmentally sound farm management practices.
Corresponding author, title, and affiliation
Ann Swinker, Extension Horse Specialist, Pennsylvania State University
Bott, R., Greene, E., Trottier, N., Willliams, C., Westendorf, M., Swinker N., Mastellar, S., Martinson, K., Environmental implications of nitrogen output on horse operations: A review, Journal of Equine Veterinary Science 08/2015; DOI:10.1016/j.jevs.2015.
Swinker, A., D. Foulk, H. McKernan , Environmentally Friendly Farm Program Recognizes Pennsylvania Farms that Adopt Sound Management Practices Protecting Water Quality and the Environment, Waste to Worth, Seattle WA, March 31 – April 3, 2015.
USDA, CIG Grant Final Report: Pennsylvania Small Farm Environmental Stewardship Program: Implementing Conservation Practices on Small Farms and Using Environmental, Agreement Number: 69-3A75-11-180. 56 pages.
USDA Natural Resource Conservation Service Conservation Innovation Grant and SARE Grant for funding this project. USDA Regional Project, NE-1041, All the hard work of the PSU Extension Equine Team
The authors are solely responsible for the content of these proceedings. The technical information does not necessarily reflect the official position of the sponsoring agencies or institutions represented by planning committee members, and inclusion and distribution herein does not constitute an endorsement of views expressed by the same. Printed materials included herein are not refereed publications. Citations should appear as follows. EXAMPLE: Authors. 2017. Title of presentation. Waste to Worth: Spreading Science and Solutions. Cary, NC. April 18-21, 2017. URL of this page. Accessed on: today’s date.
Manage Cookie Consent
To provide the best experiences, we use technologies like cookies to store and/or access device information. Consenting to these technologies will allow us to process data such as browsing behavior or unique IDs on this site. Not consenting or withdrawing consent, may adversely affect certain features and functions.
Functional
Always active
The technical storage or access is strictly necessary for the legitimate purpose of enabling the use of a specific service explicitly requested by the subscriber or user, or for the sole purpose of carrying out the transmission of a communication over an electronic communications network.
Preferences
The technical storage or access is necessary for the legitimate purpose of storing preferences that are not requested by the subscriber or user.
Statistics
The technical storage or access that is used exclusively for statistical purposes.The technical storage or access that is used exclusively for anonymous statistical purposes. Without a subpoena, voluntary compliance on the part of your Internet Service Provider, or additional records from a third party, information stored or retrieved for this purpose alone cannot usually be used to identify you.
Marketing
The technical storage or access is required to create user profiles to send advertising, or to track the user on a website or across several websites for similar marketing purposes.


 Project 1- documented conservation and farm management practices on 23 equine operations, quantitatively evaluated pasture desirable plants and canopy cover, sampled feed, hay and soil, and conducted nutrient management audits. Pasture data, collected using line point transect methodology, included calculation of percent canopy cover, basal stems and desirable forage. The 23 surveyed operations were used to develop a baseline for total nutrient balances and levels for the Pennsylvania horse industry.