
For the equine industry, concerns about ammonia (NH3) levels in the barn environment are multifaceted and include issues of animal welfare, animal and human health, and environmental impacts. In Florida, many performance horses are housed in stalls at least part of the day as are horses with allergic skin conditions and/or pasture associated asthma. The warm and humid climate produces favorable conditions for ammonia generation and fly emergence. Previous research has demonstrated the effectiveness of sodium bisulfate in lowering floor substrate and bedding pH, reducing ammonia concentrations, and fly populations in livestock facilities (poultry houses and dairies)1,2. However, research on application of sodium bisulfate in equine facilities is limited to two studies conducted in the northeastern United States3.
What did we do?
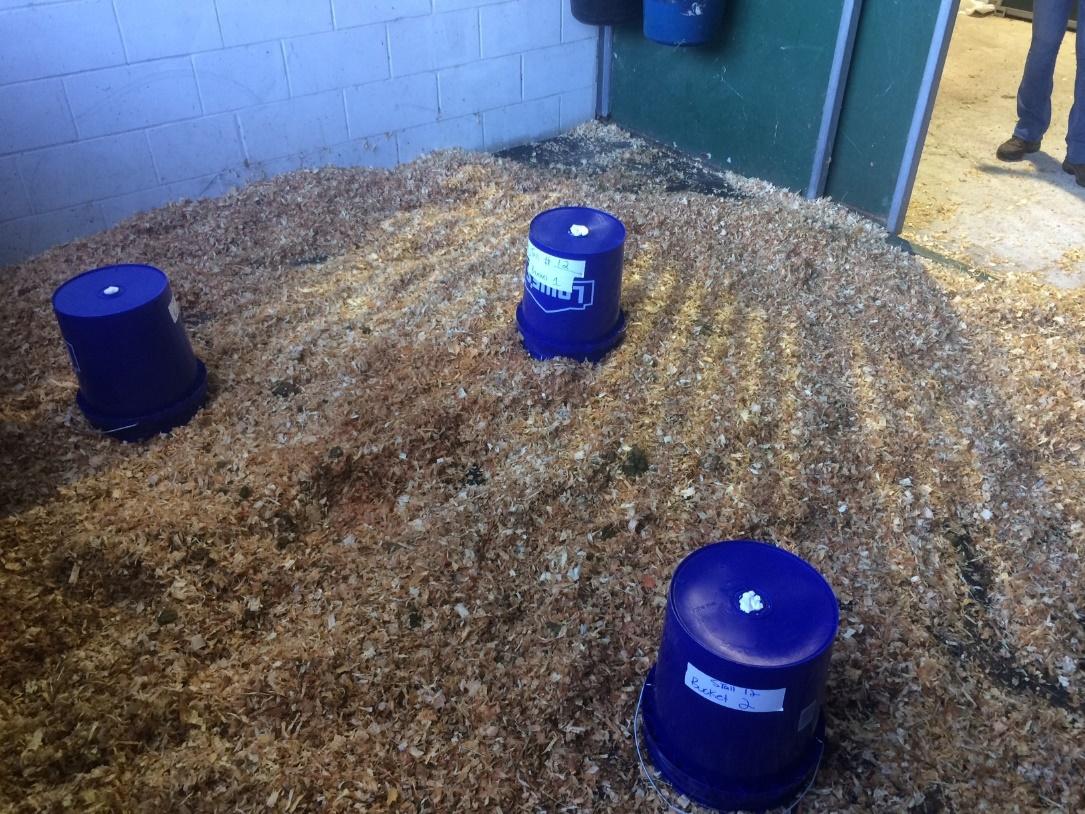
The objective of this pilot study was to determine the effects of sodium bisulfate (PLT®) application in a north central Florida equine facility on bedding pH, NH3 concentration, and fly counts. Four 12 x 12 ft stalls in a 20-stall barn were used, 2 control (CON) and 2 treated with sodium bisulfate (SB), individually housing mature geldings. Data were collected during the third week of August, 2018. Stalls were initially bedded with 67 lbs of wood shavings. Amount of product initially added to SB stalls was 14 lbs (manufacturer recommended application rate of 100 lbs/1,000 sqft) followed by 7 lbs daily for 4 days. Horses were housed in stalls overnight (12 hours/day) and stalls cleaned (manure and wet bedding removed) once/day. An aspirating pump and gas detection tubes (Kitagawa, Japan) were used to determine NH3 concentration before stall cleaning (AM measurement), to allow for manure and urine accumulation, and 10 hours post stall cleaning (PM measurement). Three 5-gallon buckets were placed over the stall surface in a triangular pattern to standardize airflow and the location of each bucket was marked to allow replication across AM and PM readings. OnSet HOBO loggers were used to monitor temperature and relative humidity. Fly traps containing no fly attractant, were suspended 8 feet above the floor in the center of each stall to determine fly counts.
What Have We Learned?
Background (cleaned stalls without bedding material; rubber mats only) and baseline (bedded stalls) NH3 concentrations were < 5 ppm and not different between SB and CON stalls. NH3 concentrations had a cumulative effect and were greater on day 3 (69.8 ppm) compared to day 1 (< 5 ppm) and day 2 (16.7 ppm). NH3 concentrations were greater in CON stalls (28.6 ppm) compared to SB stalls (< 5 ppm). Bedding pH was lower in SB stalls (1.82) compared to CON stalls (6.16) demonstrating an overall treatment effect, but pH of the bedding increased over the duration of the study. The number of flies caught in traps did not differ between treatments, although fly counts did increase over time. Reductions in pH and NH3 observed in the present study were comparable to previous studies. We expected reductions in flies in stalls treated with SB, however, fly counts were extremely low overall and a different approach for quantifying fly numbers may be necessary.
Future Plans
Future research directions include testing different application rates for equine stalls and determining efficacy of SB with different bedding types. Additional studies to investigate the effectiveness of SB in mitigating NH3 emissions in equine facilities4 and reducing fly populations and bacteria in stalls should be pursued. There is also potential to assess the benefits of SB application near manure storage areas on equine operations.
Corresponding author, title, affiliation and email
Carissa Wickens, Extension Equine Specialist, University of Florida. cwickens@ufl.edu
Other authors: Jill Bobel, Biological Scientist, University of Florida; Danielle Collins, Graduate Student, University of Florida; Alex Basso, Graduate Student, University of Florida
Additional information:
1Johnson, T. M. and B. Murphy. 2008. Use of sodium bisulfate to reduce ammonia emissions from poultry and livestock housing. Proceedings of the Mitigating Air Emissions from Animal Feeding Operations Conference, Des Moines, IA. Iowa State University, pp. 74-78.
2Sun, H., Y. Pan, Y. Zhao, W. A. Jackson, L. M. Nuckles, I. L. Malkina, V. E. Arteaga and F. M. Mitloehner. 2008. Effects of sodium bisulfate on alcohol, amine, and ammonia emissions from dairy slurry. J. Environmental Quality 37:608-614.
3Sweeney, C.R., S.M. McDonnell, G.E. Russell, and M. Terzich. 1997. Effect of sodium bisulfate on ammonia concentration, fly population, and manure pH in a horse barn. Am. J. Vet. Res. 57(12):1795-1798.
4Weir, J., H. Li, L.K. Warren, E. Macon, C. Wickens. 2017. Evaluating the impact of ammonia emissions from equine operations on the environment. Waste to Worth: Spreading Science and Solutions. Cary, NC. April 18-21, 2017. https://lpelc.org/evaluating-the-impact-of-ammonia-emissions-from-equine-operations-on-the-environment/. Accessed on: February 28, 2019.
Additional information regarding this project is available by contacting Carissa Wickens (cwickens@ufl.edu), or Jill Bobel (jbrides2@ufl.edu).
Acknowledgements:
The authors wish to thank Dr. Josh Payne, Technical Services Manager, Jones-Hamilton Company, Agricultural Division, and Dr. Hong Li, Associate Professor, Department of Animal and Food Sciences, University of Delaware for providing technical expertise and support for this project. We would also like to thank Carol Vasco, Tayler Hansen, Agustin Francisco, and Claudia Lopez for their assistance with data collection.

The authors are solely responsible for the content of these proceedings. The technical information does not necessarily reflect the official position of the sponsoring agencies or institutions represented by planning committee members, and inclusion and distribution herein does not constitute an endorsement of views expressed by the same. Printed materials included herein are not refereed publications. Citations should appear as follows. EXAMPLE: Authors. 2019. Title of presentation. Waste to Worth. Minneapolis, MN. April 22-26, 2019. URL of this page. Accessed on: today’s date.