The decision-support tool (DST) being developed facilitates the selection of manure treatment technology based on farm needs and nutrient balance requirements. A life cycle assessment (LCA) approach is used to determine and allocate among sources the whole-farm greenhouse gas (GHG) emissions and environmental impact of different manure management systems (MMS) to facilitate decision-making. The purpose of the tool is to help users identify the suite of technologies that could be used, given the farm’s unique set of preferences and constraints. The tool asks for an initial set of farm details and these values are cross-checked with predefined conditions before starting the simulation. This tool helps in the rapid quantification and assessment of treatment technology feasibility, GHG emissions, environmental, and economic impacts during the manure management decision-making process (Fig. 1). The decision algorithm operates based on user input for weightage priorities of criteria and sub-criteria related to environmental, economic, and technical components.
Figure 1. Graphical abstract
What Did We Do?
The DST is a Microsoft Excel-based tool with precalculated mass balance for a selected number of MMS alternatives representing current and emerging treatment technologies and practices. The MMS considered for the tool includes various handling systems, aerobic and anaerobic treatment systems, solid-liquid separation techniques, chemical processing units, etc. Modules were developed based on mass and energy balances, equipment capital & operating costs, unit process, and technology performance, respectively. The tool utilizes data specific to the country/region/farm where feasible and default values to calculate the overall economic and environmental performance of different MMS, providing results unitized per animal/day or per year.
Then, an LCA approach is used to evaluate the potential environmental footprints of each MMS considered. A life cycle impact assessment (LCIA) is comprised of detailed quantification of inputs and outputs of material flows in a specific treatment and/or conversion process. At the output level, it also defines and quantifies the main product, co-products, and emissions. The major focus on the treatment methods is quantifying the raw materials (manure, wash-water, bedding, etc.) that are to be handled in each MMS, thereby characterizing the properties of effluents (nutrients, gas emissions, etc.). The results include carbon, energy, water, land, nitrogen, and phosphorus footprints along with the effluent nitrogen, phosphorous, and potassium concentrations.
What Have We Learned?
Systematic selection of appropriate technology can provide environmental and economic benefits. Manure management systems vary in their design, due to individual farm settings, geography, and end-use applications of manure. However, the benefits of technological advancements in MMS provide manure management efficiencies and co-production of valuable products such as recycled water, fiber, sand bedding, and nutrient-rich bio-solids, among others. The handling efficiencies and environmental benefits provided by manure treatment technologies come with additional costs, however, so the tradeoffs between environmental benefits and implementation costs also need evaluation.
Future Plans
The next steps are to finalize the dairy module. We are refining the tool’s user interface and demonstrating to stakeholders to gather information regarding key assumptions, outputs, and the functionality of the tool. Further, we also plan to complete the swine module.
Authors
Sudharsan Varma Vempalli, Research Associate, University of Arkansas
Sudharsan Varma Vempalli, Research Associate, University of Arkansas
Erin Scott, PhD Graduate Assistant, University of Arkansas
Jacob Allen Hickman, Project Staff, University of Arkansas
Timothy Canter, Extension Specialist, University of Missouri
Richard Stowell, Professor, University of Nebraska-Lincoln
Teng-Teeh Lim, Extension Professor, University of Missouri
Lauren Greenlee, Associate Professor, The Pennsylvania State University
Jennie Popp, Professor, University of Arkansas
Greg Thoma, Professor, University of Arkansas
Additional Information
Detailed economic impacts and tradeoffs expected with the implementation of certain MMS related to this tool is presented during the conference by Erin Scott et al., on the topic “Evaluating Costs and Benefits of Manure Management Systems for a Decision-Support Tool”.
Varma, V.S., Parajuli, R., Scott, E., Canter, T., Lim, T.T., Popp, J. and Thoma, G., 2021. Dairy and swine manure management–Challenges and perspectives for sustainable treatment technology. Science of The Total Environment, 778, p.146319. https://www.sciencedirect.com/science/article/pii/S0048969721013875
Acknowledgements
We acknowledge funding support from the United States Department of Agriculture (USDA) National Institute of Food and Agriculture (NIFA) grant award (# 2018-68011-28691). We would also like to thank our full project team and outside experts for their guidance on this project.
The authors are solely responsible for the content of these proceedings. The technical information does not necessarily reflect the official position of the sponsoring agencies or institutions represented by planning committee members, and inclusion and distribution herein does not constitute an endorsement of views expressed by the same. Printed materials included herein are not refereed publications. Citations should appear as follows. EXAMPLE: Authors. 2022. Title of presentation. Waste to Worth. Oregon, OH. April 18-22, 2022. URL of this page. Accessed on: today’s date.
Different dairy associations and cooperatives have been establishing aggressive environmental goals, including reaching carbon neutrality. Carbon sequestration has been largely absent from environmental dairy studies as it is challenging to estimate. The daily feed intake of dairy cows under organic management is composed mainly of pasture and forages, which have a significantly more developed root system than many other grain cropping systems usually included in conventionally managed feed rations. Moreover, manure is also an important source of carbon, that could be sequestered in the long-term depending on the farm’s management practices. This paper quantifies GHG emissions from organic dairy farms in the U.S., including the benefits of carbon sequestration from above and below ground residues.
What Did We Do?
The U.S. was divided into eight regions based on U.S. climate categories and management practices of the organic dairy farms that participated in the study. This paper presents the results for the Midwest-Great Lakes, New England, California, and the Northwest, where representative organic farms and management practices for each region are modeled with life cycle assessment (LCA) techniques to estimate GHG emissions (kg CO2-eq). The model keeps track of key constituents in milk, meat, and manure based on the defined feed ration and animal characteristics. All inputs and outputs at the farm level during feed production, herd management, milking, and manure management are included in the analysis. Results are expressed per 1 kg of fat and protein corrected milk (FPCM), adjusted to 4% fat and 3.3% protein.
A novel approach has been developed to estimate carbon sequestration from carbon staying in the field that considers environmental factors such as temperature and farm management practices that affect the carbon content of manure reaching the soil and posterior sequestration. Three major steps are used to estimate C sequestration from the pasture and crops portion of dairy feed in the modeled organic systems: i) estimate the C added to the soil from biomass in above ground residues, below ground residues, and manure; ii) estimate the change in C above and below ground as a result of crop and grassland management practices, iii) determine the amount of C from the first steps that will be sequestered long-term.
What Have We Learned?
Average GHG emissions for the modeled farms and regions range from 0.76 – 1.08 kg CO2-eq/kg FPCM after accounting for C sequestration. Enteric methane (CH4) represents more than half of total GHGs and is closely related to the efficiency of conversion of feed to milk by the cow. Carbon sequestration benefits reduce overall emissions by 7 – 20% in the modeled farms and regions. Farms in the Midwest and New England rely heavily on pasture during the grazing season and on grass forages produced on-farm during the non-grazing season, meaning that most of the C is sequestered through residue that stays in the soil system (42 – 49% from below ground residue vs. 35 – 42% from manure). The addition of carbon in manure is also significant, contributing more carbon to the soil than below ground residue in some farms, especially in those relying on imported feeds (43 – 47% from manure in California and the Northwest).
Future Plans
GHG emissions, ammonia emissions, resource depletion (energy, land, and water) and eutrophication potential of organic dairy farms will be estimated for the remaining regions in the U.S. The effect of alternative management practices, key to organic practices, will also be modeled to identify mitigation strategies. Finally, different LCA modeling decisions, such as allocation and use of enteric CH4 predictive equations, will be evaluated to determine their effect on final results.
Authors
Horacio Andres Aguirre-Villegas, Associate Scientist, Department of Biological Systems Engineering, University of Wisconsin-Madison
Corresponding author email address
Aguirreville@wisc.edu
Additional authors
Rebecca A. Larson, Associate Professor. Department of Biological Systems Engineering, University of Wisconsin-Madison
Nicole Rakobitsch, CROPP, Organic Valley.
Michel A. Wattiaux, Professor, Animal and Dairy Sciences, University of Wisconsin-Madison
Erin, Silva, Associate Professor, Plant Pathology, University of Wisconsin-Madison
Acknowledgements
This work was funded by the Cooperative Regions of Organic Producers Pools (CROPP) Cooperative – Organic Valley
The authors are solely responsible for the content of these proceedings. The technical information does not necessarily reflect the official position of the sponsoring agencies or institutions represented by planning committee members, and inclusion and distribution herein does not constitute an endorsement of views expressed by the same. Printed materials included herein are not refereed publications. Citations should appear as follows. EXAMPLE: Authors. 2022. Title of presentation. Waste to Worth. Oregon, OH. April 18-22, 2022. URL of this page. Accessed on: today’s date.
Manure from beef feedlot productions can be managed through a diversity of strategies. When choosing from the possible scenarios the main factors influencing the decision are financial, logistical or from a regulatory fulfillment focus, however it is necessary to consider the environmental impact generated from the manure management system in order to generate less burdens on behalf of meat production. One of the most reliable methodologies for this matter is Life Cycle Assessment (LCA), which considers every input and output throughout the process and will calculate environmental emissions quantitatively. In this study we compared various LCA studies of beef lot manure management processes, with the aim of understanding the different systems´ hotspots and global emissions so that these can be considered when establishing a manure management system in similar facilities.
What Did We Do?
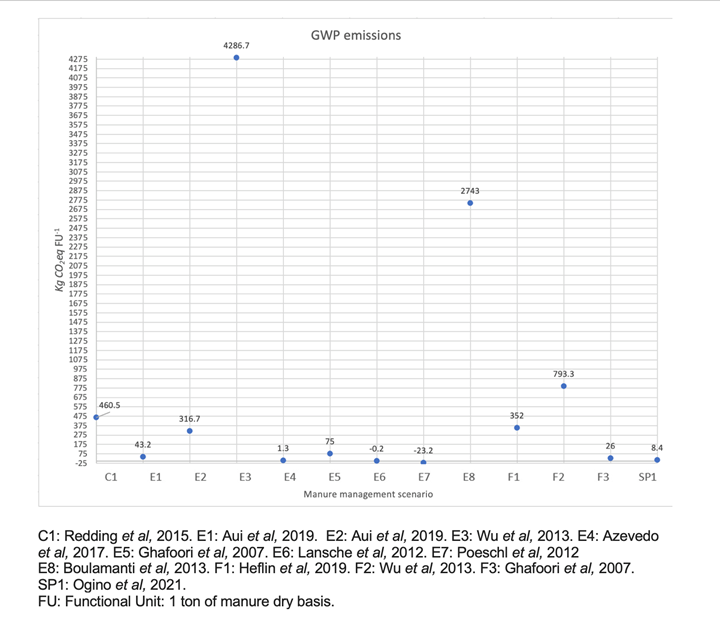
We gathered LCA studies published from peer-reviewed scientific journals that assessed the environmental impact of beef manure management. The search terms taken into account were “LCA and beef manure” and “LCA and feedlot manure”. To enable comparison between studies the following criterion were considered for inclusion: a) manure collected from intensive feedlot facilities b) results reporting at least global warming potential.
In order to categorize emissions generated from the entire manure life cycle we established four stages of manure management: Feedlot, transport, storage/transformation and use/disposal. Next, we identified which of these stages were taken into account in each study and if emissions were reported for stages individually as well as globally. Lastly, a comparison between LCAs was conducted for which we converted the functional units reported in the references to 1 ton of manure (dry basis). With this we can visualize the emissions generated from every ton of dry manure that enters the system despite the functionality to which it´s destined.
What Have We Learned?
The final review included 14 references which resulted in 19 scenarios evaluated, ranging from 2007 to 2021. Initially we noted that the system with the greatest number of evaluations performed was the transformation of manure into an energetic resource (E), with 12 of the 19 scenarios being focused on energy generation through manure treatment processes, emphasizing that the current trends are not only leaning towards a better manure use but also cleaner energy sources. On the counter part, composting (C) and stockpiling (SP) are the two least evaluated scenarios through LCA (just once in the articles present in this review). Manure composting and stockpiling aren´t perceived as innovative solutions when aiming to mitigate emissions, but shouldn´t be left aside when performing evaluations, since they´re the most applied techniques for feedlot manure management.
The energetic evaluations represented both, the most (E3) and the least emissions (E7) through the whole process. This is because bioenergetic sources, such as the one generated from manure transformation, frequently are given environmental credits and therefore negative emission values considering the substitution of other energetic resources. In this review 10 of the 12 energetic scenarios considered emission reduction by substitution, but not because the actual process generated less amount of greenhouse gases in itself. Energy production from manure is, in many cases assessed as a life cycle for transformation and excluding other stages of the entire management system. In fact, apart from the kind of treatment only 21.4% of all the LCAs considered in this study included all four stages. Since two of them (Lansche et al, 2012; Van Stappen et al, 2016) mentioned that the best mitigation emission option was to reduce storage time, and one (Giwa et al, 2017) reported the largest emissions coming from transportation we can assume that both, storage and transport are important stages when looking at sources of emissions and should not be left aside.
The difference between emissions between different manure management systems can be as extreme as 4,000X depending on system boundaries, allocation procedures, emission factors, environmental credits, amongst others. When evaluating a manure management system, it is necessary to consider every stage and so that emission reduction can be addressed in the whole process hotspots and not only during the transformation of organic matter.
Future Plans
To conduct an attributional LCA of beef feedlot manure management system as a case study. With this we will contribute more data to contrast composting or stockpiling scenarios and address the weight of the different manure management in a feedlot facility. Also, we will report eutrophication potential and water depletion, as their importance in the environmental impacts of manure management is well known and should be considered when decisions are being made.
Authors
Andrea Wingartz, National Autonomous University of Mexico
Corresponding author email address
anwiot@gmail.com
Additional author
PhD. Rafael Olea Pérez, National Autonomous University of Mexico
A carbon footprint is a total of all the greenhouse gas emissions (GHG) from a process or industry. A life cycle assessment (LCA) is the process used to figure out what GHG emissions will be included in the footprint. More technically, it is systematic way of looking at a product’s complete life cycle and calculating a “footprint”. In addition to carbon footprints, there are efforts to calculate land, water, and other environmental footprints.
Below are highlights from several different reports that looked at the carbon footprint of the pork industry on a national and international scale. A comparison between different ways to raise pigs was also highlighted.
The report concluded that the carbon footprint to prepare and consume a 4 oz serving of pork was ~2.5 lbs of carbon dioxide equivalents. Figure 1 (below) from that report shows the relative breakdown of the industry’s estimated greenhouse gas emissions:
Live animal production made up 62.1% of the emissions. That is further broken down and presented in second column (right).
Processing – 5.6%
Retail – 7.54%
Consumption – 23.5% including refrigeration, cooking, and methane from food waste in landfill
Packaging (1.3%);
Comparison Over 50 Years of Production
Another example of an industry-wide analysis, this one comparing over time, is a “50-year comparison of the carbon footprint of the U.S. swine herd 1959 – 2009” (29 pp; PDF). The pork industry overall emits more total greenhouse gases than 50 years ago, but actually emits much less per pound of pork produced because of improvements in efficiency.
From that publication:
The U.S. swine industry produces pigs far more efficiently today (2009) than in 1959. The number of hogs marketed has increased 29% (87.6 million in 1959 to 112.6 million in 2009 after removing market hogs imported directly to harvest) from a breeding herd that is 39% smaller. The efficiency gain is even more impressive when measured against the total dressed carcass weight harvested. Dressed carcass yield leaving the farm has nearly doubled in 50 years from 12.1 billion pounds to 22.8 billion pounds. This increase in productivity has resulted in an increase of 2,231 pounds (2.5x) of carcass harvested annually per sow – year. Today, it takes only five hogs (breeding and market) to produce the same amount of pork that required eight hogs in 1959.
High-profitability operations have consistently lower impacts compared to low-profitability operations for both commodity and deep-bedded niche piglet production.
Global Assessment from Backyard to Industrial Systems
On an international scale, the report “Greenhouse gas emissions from pig and chicken supply chains” was published in 2013. This study looked at all scales of farms from backyard pigs to industrial production (large confinement operations). Over the entire scale, they estimated that the carbon footprint of pork for every kg (~2.2 lbs) of pig carcass weight has an emissions intensity of 6.1 kg of carbon dioxide equivalent.
This report found that backyard systems, especially in some parts of the world, have low emissions, largely due to by-product or “second-grade” feeds. Industrial pig systems tended to have more emissions intensity than backyard systems, with the emissions from liquid/slurry manure management systems being a big reason. From the conclusion of the report:
When drawing any conclusions about scope for improvement, the following points should be borne in mind: (a)differences in emission intensity may reflect differences in production systems that have arisen over time to enable the system to perform better within a given context, e.g. to make them more profitable, or resilient; (b) focusing on a single measure of efficiency (in this case GHG emissions per kg of output) can lead to positive and negative side effects on, for instance, biodiversity, water quality and animal welfare; (c) reducing GHG emissions is not the only objective producers need to satisfy, as they also need to respond to changing economic and physical conditions.
How Do Carbon Footprints Compare?
It is very important to note that when looking at data and numbers generated from different reports like these, the carbon footprints are difficult to compare unless they use the same LCA. Presenting carbon footprints from different LCA’s is an “apples to oranges” comparison. Only when the same LCA is used, can they be an “apples to apples” comparison.
Authors: Amy Carroll, University of Arkansas and Jill Heemstra, University of Nebraska jheemstra@unl.edu
This information is part of the program “Integrated Resource Management Tool to Mitigate the Carbon Footprint of Swine Produced In the U.S.,” and is supported by Agriculture and Food Research Initiative Competitive Grant no. 2011-68002-30208 from the USDA National Institute of Food and Agriculture. Project website.
Dr. Greg Thoma, Dr. Richard Ulrich and Dr. Jennie Popp – University of Arkansas, Dr. William Salas and Dr. Chengsheng Li – DNDC Applications, Research and Training
Why Develop Models for Pork Production and Environmental Footprint?
Change in complex systems can occur either systemically, for example by government policy or regulation, or by adoption of new practices by individuals followed by wider adoption where the new practice is effective. This is costly and early adopters incur high risk of failure. This risk can be reduced through good decision support systems to aid in the selection of optimal practices – in effect, with a good model of the system, adoption of management techniques or technology can be tested by simulation before physical implementation.
This is the fundamental utility of models: they provide an inexpensive low risk alternative to experimental trial and error. The swine production model being developed for this project is based on the National Pork Board (NPB) Pig Production Environmental Footprint Calculator written at the University of Arkansas and first released in May 2011.
The National Academy of Sciences reported that EPA methodology should be improved by replacing emission factors with “process-based” models.” The tradeoff is that process-based models are more complex. Our team worked with the National Pork Board to create a process based emission model for swine production to serve as the foundation for a decision support system. This combined emission and cost model, the Pig Production Environmental Footprint Calculator (V2), was released in June 2013, and V3 will be released in Fall, 2015.
This model estimates GHG emissions, water use, land occupation and day-to-day costs from multiple farm operations to identify major contributions and provide a test bed for evaluating potential reduction strategies. The model requires readily available input information such as the type of barn, animal throughput, ration used, the time in the barn, weather for the area, type of manure management system as well as energy and feed prices. The model output includes a summary GHG emissions, water consumption, land occupation and costs by source, of as well as feed and energy usage for the simulation.
Project Objectives
Integrate process-models of swine production with coupled life cycle assessment (LCA) and economic models to create a decision support tool to identify economical swine production system options which minimize GHG emission and increase sustainability of production systems.
Improve existing process algorithms to capture effects of barn climate control, feed phases, water distribution, solar insolation, and manure application technology on GHG emissions.
Expand and improve the user interface, making it more intuitive and user-friendly.
Expand the feed ingredient list and improve estimations of important feed characteristics needed for the model.
Develop economic algorithms and compile relevant cost databases to capture the costs of day-to-day activities that entail water use and generate GHGs on farm.
Research Summary: What Have We Done? What Have We Learned?
Scale of the farm and manure systems
The model was converted from barn-level to a farm-level tool by integrating the barns and manure systems together through the model input procedures. In this way the emissions from the various on-farm operations can be compared on the same basis and put into perspective with regard to emission sources. There can be up to ten barns, each with its own associated manure system (subfloor, deep pit and, added in year 4, dry bedding) and 10 separate downstream manure handling systems (lagoon, outside storage and, recently added, a digester). Each barn can have its manure stream routed to any downstream manure system enabling streams to be combined for processing before going to the fields. An algal turn scrubber option can be added as an adjunct to any downstream system.
All of the manure handling systems, both those associated with a barn and those downstream of the barns, were written at the University of Arkansas and all but the digester are process-based. A digester option was added with options for burning the produced methane as barn heat or for producing electricity. Emissions are calculated for the transport of manure to the fields but not for emissions after application.
Growth, performance and amino acid inclusion in rations
The National Research Council (NRC) growth and performance model was integrated into the full farm level model in order to link ration characteristics and growth performance. We have closed the mass balance over the farm for carbon, nitrogen, phosphorous, water and manure solids. Addition of the NRC model also brought in the effects of ractopamine and immunocastration management options.
Testing of the revised growth equations with respect to the effects of individual amino acids (AA) was completed and a manuscript has been partially drafted. A revised equation predicting the effects of heat stress on feed intake was derived and incorporated into the model resulting in much better predictions of these effects than provided by the native NRC equations. Equations describing the impact of heat and cold stress on energy maintenance costs were also constructed, but have yet to be incorporated into the model. These latter 2 efforts were carried out primarily by a postdoctoral student employed on the National Animal Nutrition Program (NRSP-9) with the resulting equations made available to the project. Two manuscripts describing this work have been drafted and will be submitted in Fall, 2015. Finally, a method of deriving model settings to match observed rates of daily gain and feed conversion efficiency was devised and recently passed onto the barn model team for incorporation into the barn model. This will allow the model to be easily calibrated to observed gain and feed efficiency as input by the user.
Weather information
We updated the model weather files from the MERRA database for each of the 3102 counties in the U.S. These files have, in addition to temperature and humidity, other useful information such as precipitation, solar insolation, subsurface temperatures at various depths, and snow cover. The additional MERRA information facilitated addition of a solar panel option and will be used to estimate rainwater contribution to outside manure handling facilities and of solar insolation on inside barn temperatures.
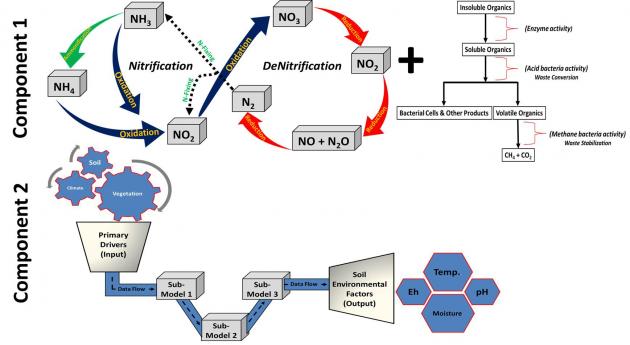
What Is the DNDC Model?
The DNDC (DeNitrification and DeComposition) model was developed for quantifying N2O emissions from agricultural soils in the late 1980s (US EPA, 1995). By including fundamental bio-geochemical processes of carbon and nitrogen transformations, DNDC was extended to model soil C sequestration and other trace gases (e.g., methane, nitric oxide, ammonia etc.) in the early 1990s.
DNDC consists of two components. The first component entails three sub-models and converts primary drivers (i.e., climate, soil, vegetation and anthropogenic activity) to soil environmental factors (i.e., temperature, moisture, pH, Eh and substrate concentration gradient). The second component consists of nitrification, denitrification and fermentation sub-models; and simulates production/consumption of N2O, NO, N2, NH3 and CH4 driven by the modeled soil environmental conditions [see graphic below]. With the bio-geochemical reactions embedded in the model framework, DNDC can predict the turnover of soil organic matter and the consequent trace gas emissions and nitrate leaching losses.
Feed ingredients
With input from industry and academic experts, our feed ingredient database was revised to better capture the expected range of ingredients typically available to producers in the US. Carbon, water and land footprint data as well as nutritional characteristics for the NRC growth equations were compiled for each feed ingredient. Economic models, that estimate the cost of feed, manure handling, utilities (water, electricity, gas, propane and diesel), dead animal disposal and immunocastration were integrated into the model. Capital costs are not considered. We are conducting cost benefit analyses on combinations of operations, manure management and dietary feeding systems aimed at reducing GHG emissions. These will help identify incentives to minimize mitigation strategy cost. Routines have been developed that will allow the user to download a set of updated prices for utilities and major feed ingredients.
DeNitrification and DeComposition (DNDC) Model (Soil)
The DeNitrification and DeComposition (DNDC) model requires numerous weather and site inputs, many of which are output from the environmental calculator, and others which require site-specific geographical characteristics (e.g., soil type). We analyzed the agricultural area of each continental-US county using agricultural classes from the 2013 NASS Cropland Data Layer. For each county, we assigned the mean latitude/longitude of all agricultural pixels as the agriculture-weighted centroid from which representative weather data will be extracted.
County soils data are derived from the NRCS General Soils Map (STATSGO). We derived the spatial intersection of STATSGO soil polygons with county boundaries. We summarized top soil data for each soil polygon from 0 to 10cm depth for clay fraction (a proxy for soil texture), bulk density, organic matter fraction (to estimate soil organic carbon, SOC), and pH. Modeled results will be based on either the comprehensive set of soil polygon attributes or a representative distribution of soil attributes for each county (depending on timing and available computing power).
Summary
The model will enable the user to find hot spots in their emissions profile, evaluate the effects of operational changes, and estimate the emissions from facilities during the design stage. The further addition of an operational economic model will provide the ability to perform cost/benefit analyses of practices that can change impact GHG emissions (see video).
Work will continue on this project through Spring, 2016.
Figure 1. Diagram of the DeNitrification and DeComposition (DNDC) model
Why Does This Matter?
The environmental footprint model, with improved algorithms for manure management, economics, and animal performance provide high resolution and flexible decision support for the swine industry. The model enables users to identify hot spots in their emissions and water/land use profiles, evaluate the effects of operational changes, and estimate the emissions from facilities during the design stage. The further addition of an operational economic model enables cost/benefit analyses.
These enhancements support evaluations of dietary energy, protein, and amino acid content for much of the life cycle and immunocastration and the use of ractopamine during the growth cycle. They also allow assessment of the performance, economic, and environmental impact of transient health events during the growth cycle with respect to whole farm operation.
A carbon footprint is the total greenhouse gas emissions for a given person, place, event or product.
Carbon footprints are created using a process called life cycle assessment. Life cycle assessment or LCA is a method of resource accounting where quantitative measures of inputs, outputs and impacts of a product are determined.
Life cycle assessment is commonly used to:
find process or production improvements
compare different systems or products
find the ‘hot spots’ in a product’s life cycle where the most environmental impacts are made
help businesses or consumers make informed sourcing decisions
LCA Methods
There are several standard approaches for developing a life cycle assessment including the International Dairy Federation, the U.S. EPA, and two European standards: ISO 14040, and PSA 2050. While this can be completed with a simple spreadsheet, there are several software packages available to help complete the LCA
Steps to a Life Cycle Analysis:
Define the goal & scope of the LCA. This includes determining the purpose for the analysis.
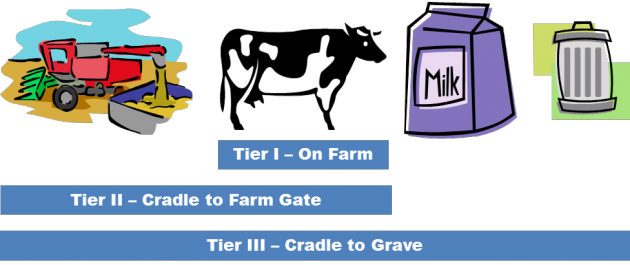
Set the boundaries of the system: each higher tier provides a more complete picture of the product’s impacts, however requires more time and resources to complete.
Gate to Gate (LCA Tier I) – inventories the direct emissions for a single product of process
Cradle to Gate (Tier II) – inputs are taken back to the initial extraction as natural resources up to a certain point in the product’s life such as its sale from the farm, i.e. farm gate. This will include both direct and indirect emissions from the product.
Cradle To Grave (Tier III) – the product is followed through the consumer to its eventual recycling or disposal.
Determine how the impacts will be measured, also known as the functional unit. This can be expressed as the net sum of all impacts per unit of product, or the opposite: for a given amount of product, the amount of impact e.g. pounds of greenhouse gas emissions produced per pound of energy corrected milk.
Example impacts: greenhouse gas emissions, water use, land use, health impact
Example livestock products: Pound of meat, dozen eggs, energy corrected milk production, nutritional content.
Inventory the needed data. Information is gathered to identify and quantify energy, water and materials usage and the environmental releases associated with each step of the process. These data are collected through research and modeling for many different inputs, from coal mining to equipment manufacturing, and are available through worldwide databases. However, some of the needed data may not yet be available so research articles, models and assumptions must be used to fill in the final informaion.
Allocate resources and impacts to co-products. For example in dairy production, feeder cattle for meat production are also grown. The impacts of dairy feeder production can be included in the milk LCA, because calves are necessary for milk production, or a portion of the impacts can be allocated to beef production. This allocation can be made several ways, with the most common being economic, i.e. the calves are 10% of the value of dairy enterprise, or mass, i.e. the calves are 1% of the mass leaving the farm.
Impact assessment. This is where all the impacts are totaled and summarized. If the purpose of the LCA was to produce a carbon footprint, then only greenhouse gas impacts need totaled. However, multiple impacts can be compared and given different weighting if an overall score for a product is part of the purpose for the LCA.
Sources of variation
Different researchers may get different results when performing a LCA on the same product. This can happen for many reasons:
System boundary definition
Inclusion/exclusion of secondary/ indirect sources
Inclusion/exclusion of biogenic carbon (stored in organisims)
Inclusion/exclusion of carbon dioxide from fuel combustion
Functional relationships used
Global warming potential indexes
Inclusion/exclusion of carbon sequestration
Additional Resources
Additional Animal Agriculture and Climate Change Resources
Author: Crystal A. Powers – UNL
Reviewers: J. Harrison – WSU, J. Heemstra – UNL, S Mukhtar – TAMU, D. Smith – TAMU
Manage Cookie Consent
To provide the best experiences, we use technologies like cookies to store and/or access device information. Consenting to these technologies will allow us to process data such as browsing behavior or unique IDs on this site. Not consenting or withdrawing consent, may adversely affect certain features and functions.
Functional
Always active
The technical storage or access is strictly necessary for the legitimate purpose of enabling the use of a specific service explicitly requested by the subscriber or user, or for the sole purpose of carrying out the transmission of a communication over an electronic communications network.
Preferences
The technical storage or access is necessary for the legitimate purpose of storing preferences that are not requested by the subscriber or user.
Statistics
The technical storage or access that is used exclusively for statistical purposes.The technical storage or access that is used exclusively for anonymous statistical purposes. Without a subpoena, voluntary compliance on the part of your Internet Service Provider, or additional records from a third party, information stored or retrieved for this purpose alone cannot usually be used to identify you.
Marketing
The technical storage or access is required to create user profiles to send advertising, or to track the user on a website or across several websites for similar marketing purposes.


 of pork production in the U.S.")
 Project Objectives