
This webinar will examine how black soldier fly larvae (BSFL) can transform food and agricultural waste into valuable products for both animal feed and soil health. Presenters will discuss large-scale BSFL production, the frass co-product, and how nutrient content can vary based on inputs and processing. This presentation was originally broadcast on August 15, 2025. Continue reading “Flies, Frass, Feces, and Fields”
Concise Composting
Purpose
Timber Creek Recycling has operated a turned windrow composting operation using manure and food waste processing by-products and green waste for over a decade in Meridian, Idaho. Pressure from suburban encroachment and the availability of increasingly difficult feedstocks that had excessive odor, created the need to move operations from a farm to an industrial site. Land costs were greater, and potential odor impacts would increase in this move. The owner also requested that the number of touches be reduced to minimize the current workload for compost operators. There are some essential operational & design considerations to manage manure composting on a concise footprint and a limited budget. This presentation describes the operation and design considerations that can apply to any composting operation.
What Did We Do?
Green Mountain Technologies considered three different models of concise composting. Radial stacker bunkers, using a central pivot telescopic conveyor to place and cover active compost piles. Also inwardly turned circular aerated piles, which use a side discharge compost turner to turn the compost towards the center of a large circle. Timber Creek Recycling decided to use a narrow profile rectangular shaped turned aerated pile composting approach. This form uses a long concrete aeration floor that allows the owner to build capacity in six phases and increase the operating efficiencies with each additional phase. This approach kept the expansions in line, so that delivery trucks could unload directly in front of the piles and so that side discharge compost turners could be used to mix feedstocks into one side of the pile and move the composting material through different aeration floor capacities and finally to a long collection belt that directly fed a compost screener. This and the aeration floor reduced touches from 12 to 9, compared to non-aerated windrows, and provided a once a week turning frequency, reducing compost, and curing time from 90 to 45 days.
Steps taken to reach this point.
Industrial land was purchased in Nampa, Idaho, permits received and phase one of construction has been completed and operated for over 9 months. The design compacted a 30-acre operational site to a 12-acre operational site with significantly more capacity than the original. Odor reduction steps were taken to reduce the odor of cheese whey waste activated sludge being delivered to the site by using a lime additive during the screw press step at the cheese manufacturer. A small straddle windrow turner was used to mix the delivered feedstocks, and a food waste de-packager was installed to manage out-of-date or off-specification foods.
What Have We Learned?
The use of reversing direction aeration was not necessary when using positive aeration using a cap of wet wood chips or screened compost covers on top of the piles for the first 7 to 10 days. Odors have not been a problem at the new site using forced aeration compared with turned windrows (un-aerated) at the old site. The higher horsepower side discharge conveyor compost turners do not make economic sense just for phase one but will for all three phases. Wastewater collection and reuse is difficult to manage and needs to be incorporated into the mixing and turning process using an underground main and hose reel located at the far end of the aeration pads.
Take home messages
Aeration using blowers and airpipes below a concrete floor can effectively keep composting operations with challenging feedstocks from smelling bad and increase the biological efficiency and throughput. Use of a woody moist bio cover over the top of the pile is essential for the first 7-10 days for these feedstocks.
Force air through a compost pile at least 6 times per hour using on/off timers to control pile temperatures between 125° and 145° F and to keep oxygen above 13% using a rate of 3-5 CFM/cubic yard. Automated temperature feedback controllers make this simpler and more dependable.
Turn and re-water at least 2 times in the first month, either by top irrigation within 30 minutes before turning, or using a hose reel and spray bar connected to the turner (better) or simply turn piles at least 30 minutes after a big rain event.
Piles shrink over time- Double up the piles after 2 weeks and cure with less forced air at 1-2 CFM/cubic yard for an additional 2 weeks.
Adding capacity over time without increasing travel distances requires delivery directly to the initial composting area and collection from the distant piles using conveyors. On-farm generated feedstocks and the composting operations should be placed together as close as possible. Have delivery and storage of outside amendments be alongside your manure or processing waste discharge locations.
Each touch of the material should be limited, and with each touch involving several key feedstock preparation actions while entering a composting system, such as metering materials together in the correct proportions, and mixing thoroughly while watering and delivering into the first composting stage. Examples include building windrows proportionally with loaders and turning and watering with a windrow turner that can apply pond wastewater as it turns. Second example, if a conveyor is used to collect and discharge a manure in a CAFO, add bulking materials prior to the last conveyor and place into an in-line pug mill before stockpiling or placement on an aeration floor. The third example when using side dump delivery trucks, have trucks unload manure in a long low windrow, and then place the amendment in another long low windrow alongside about 22 feet apart, then use a side discharge windrow turner with a spray bar to apply wastewater to combine and then mix the windrows together using the turner in 2 passes. Large loaders move about 500 cubic yards per hour, compost turners move over 4000 cubic yards per hour. So each touch is cheaper per unit.
Future Plans
Phases two and three are under development to move the entire windrow operation from Meridian Idaho to the new site within 2 years.
Authors
Presenting authors
-
- Jeffrey Gage, Director of Consulting, Green Mountain Technologies, Inc.
- Mike Murgoitio, President, Timber Creek Recycling
- Caleb Lakey, Vice President, Timber Creek Recycling, LLC
Corresponding author
Jeffrey Gage, Director of Consulting, Green Mountain Technologies, Inc., jeff@compostingtechnology.com
Additional author
Caleb Lakey, Vice President, Timber Creek Recycling, LLC.
Additional Information
-
- https://www.compostingtechnology.com
- https://www.timbercreekrecycling.com/
- Citations
- Industrial Composting: Environmental Engineering and Facilities Management, Eliot Epstein, CRC Press, 2011. https://www.taylorfrancis.com/books/mono/10.1201/b10726/industrial-composting-eliot-epstein?_ga=2.37894116.67590306.1739841108-1296093157.1739841108
- Compost Science & Utilization https://www.tandfonline.com/journals/ucsu20
- Biocycle Magazine https://www.biocycle.net/
- Case Studies: Annen Brothers, Mt Angel, OR. Timber Creek Recycling, Meridian and Nampa, ID. Stage Gulch Organics Compost Facility, Sonoma, CA.
Distillers grains impact on feedlot pen surface material
Purpose
Distillers grains (DGs) have been heavily researched as a diet additive for cattle since the early 2000s. Research has considered the nutritional value, optimization, and even how it impacts odors and greenhouse gases emitted from the surface of the pens that house cattle fed these diets. However, no work has been conducted to determine if there are changes in pen surface material properties after exposure to manure from diets containing DGs. Recent conversations with producers highlighted changes in pen surface characteristics such as significant loss in material and inability to maintain mounds in the pen. after DGs were fed for prolonged periods. Research has shown that manure from distillers diets contain excess proteins which we hypothesized could cause interruptions in soil particle interactions thus leading to a loss in integrity of the pen surface. The purpose of this work was to investigate if excess excreted protein in urine was the cause of changes in the properties of pen surface material.
What Did We Do?
This work was comprised of a large-scale study at a feedlot and a lab-scale study. In the feedlot study, cattle were fed either control (no DGs), wet DGs (40%) or dry DGs (40%) for 180 days. Once cattle were finished and removed from their pens, pen surface material (PSM) was collected from 4 general locations within each pen: behind the apron, on top of the mound, the side of the mound and the bottom of the pen. Samples from each pen with the same treatment were pooled into one single composite to represent each of the treatments. Samples were divided into two sets and analyzed by a commercial laboratory as either soil or manure. Soil analysis included pH, soluble salts, organic matter, nitrate nitrogen, potassium, sulfate, zinc, copper, calcium, sum of cations, % saturation of calcium and magnesium, and Mehlich-III phosphorus. Manure analysis included organic nitrogen, ammonium nitrogen, nitrate, phosphorus, potassium, sulfur, calcium, magnesium, sodium, zinc, iron, manganese, copper, boron, soluble salts pH, and moisture
For the lab-scale study, PSM was collected from a feedlot that does not feed DGs. Material was dried, ground, and sieved. Synthetic urine was added daily to bottles containing 300 g of PSM for 3 weeks to simulate prolonged addition of urine to feedlot pen surface. Samples were then shaken for 30 minutes and left at room temperature unsealed overnight. Synthetic urine contained either 0, 8, 16, or 32% additional protein. At the end of the study, samples were dried and sent to a commercial lab to be tested as soil in which the same properties listed above were again reported.
What Have We Learned?
In the feedlot study, differences (p < 0.05) in soluble salts were observed between all three treatments. Differences (p<0.05) were observed between the control and DGs diets for soluble salts, organic matter, potassium, sulfate, magnesium saturation, Mehlich P, pH, ammonium nitrogen, organic N, total N, phosphate, total phosphorus, and sulfur.
For the lab-scale study, properties in which differences (p<0.05) were measured between the control and treatments include: nitrate N, cation exchange capacity, magnesium, sodium, zinc, calcium saturation and magnesium saturation. Analysis which resulted in differences (p < 0.05) between control and all three added protein treatments include Mehlich P, potassium, calcium, and copper. No significant differences were determined between the control and the treatments for zeta potential and conductivity. Results of the feedlot study compared to the lab scale study suggest that changes in PSM are not solely caused by excess soluble protein excretion.
Future Plans
The lab scale study will be used to determine if fiber has any contribution to the observed changes in PSM properties. The results of this study will help us determine how best to manage feedlot pens when varying forms and concentrations of DGs are fed to the cattle. It may also provide insight into potential pen surface amendments that may be used to mitigate the negative effects of feeding DGs to cattle.
Authors
Corresponding author
Bobbi Stromer, Research Chemist, US Meat Animal Research Center, Bobbi.stromer@usda.gov
Additional authors
Mindy Spiehs, Research Nutritionist, US Meat Animal Research Center
Bryan Woodbury, Research Engineer, US Meat Animal Research Center
Additional Information
USDA is an equal opportunity provider and employer
Acknowledgements
The authors wish to thank Victor Gaunt for assistance with data collection.
The authors are solely responsible for the content of these proceedings. The technical information does not necessarily reflect the official position of the sponsoring agencies or institutions represented by planning committee members, and inclusion and distribution herein does not constitute an endorsement of views expressed by the same. Printed materials included herein are not refereed publications. Citations should appear as follows. EXAMPLE: Authors. 2025. Title of presentation. Waste to Worth. Boise, ID. April 7–11, 2025. URL of this page. Accessed on: today’s date.
Ammonia and greenhouse gas emissions when chicken litter is added to beef pen surface material
Purpose
One of the big challenges in animal agricultural waste management is reduction of greenhouse gas (GHG) emissions. Pen surface material (PSM) from beef feedlots has been characterized for its GHG emission profile and research has now shifted to focus on emission-reducing treatments for pen surfaces. Chicken litter (CL) has a nutrient and microbial profile unique from beef manure which was hypothesized to cause a change in GHG emissions. This study was conducted to determine if the addition of CL to beef PSM would reduce methane (CH4), carbon dioxide (CO2), ammonia (NH3), and nitrous oxide (NO2) emissions.
What Did We Do?
A lab scale study was conducted in which 24 stainless steel pans (12.75 x 20.75 x 2.5 in, L x W x H) were filled with PSM (3000 g, control) that had been collected from USMARC feedlot in August. Twelve pans of PSM had chicken litter (20% wt/wt) added to the top of the pan and gently raked into the PSM. All pans had 1000 g of water added. All samples were kept in an environmentally controlled chamber at 25 C for 18 days and watered after each measurement to keep sample moisture consistent. Sample pH and loss in water were recorded throughout the experiment. Flux measurements of CH4, CO2, N2O and NH3 were measured on days 0, 1, 3, 6, 8, 10, 13, 15, and 18 using Thermo Scientific gas analyzers. Data was analyzed for statistical differences in emissions as a function of time (days), treatment (control vs chicken litter), and time*treatment. At the conclusion of emission measurements, samples were pooled and sent to a commercial lab for nutrient analysis.
What Have We Learned?
All measured gases showed significant changes over the time of the experiment (p < 0.05). Significant differences between treatments (p < 0.05) were recorded for N2O with a higher emission recorded for PSM+CL. Significant treatment* day interactions were observed for CH4, NH3, and N2O (p < 0.05). Methane and NH3 emissions peaked on day 1 and steadily decreased over the 18 days; N2O emissions steadily rose from day 0 to day 8 and then steadily decreased through day 18. Nutrient analysis determined PSM with chicken litter contained significantly higher levels of organic N, ammonium N, and total nitrogen. There was no significant difference of N2O in control vs treated samples. Chicken litter treated samples showed higher levels of P2O5, K2O, sulfur, calcium, magnesium, sodium, zinc, copper, boron, soluble salts, and organic matter. From this work, we conclude that addition of chicken litter to PSM did not favorably alter emissions of greenhouse gasses. Mixing the manures may be beneficial for land application to cropland or for composting.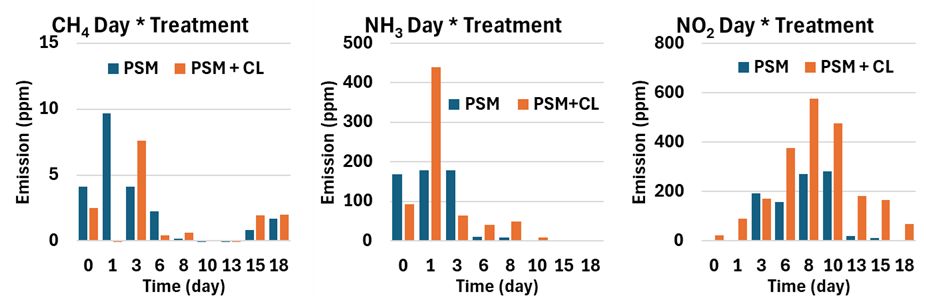
Future Plans
Future research will evaluate different sources of composted CL, the emission profile of CL, and consideration of how mixtures of PSM and CL impact nutrient retention and composting.
Authors
Presenting & corresponding author
Bobbi Stromer, Research Chemist, US Meat Animal Research Center, Bobbi.stromer@usda.gov
Additional authors
Mindy Spiehs, Research Nutritionist, US Meat Animal Research Center
Bryan Woodbury, Research Engineer, US Meat Animal Research Center
Additional Information
USDA is an equal opportunity provider and employer
Acknowledgements
The authors wish to thank Victor Gaunt for assistance with data collection
The authors are solely responsible for the content of these proceedings. The technical information does not necessarily reflect the official position of the sponsoring agencies or institutions represented by planning committee members, and inclusion and distribution herein does not constitute an endorsement of views expressed by the same. Printed materials included herein are not refereed publications. Citations should appear as follows. EXAMPLE: Authors. 2025. Title of presentation. Waste to Worth. Boise, ID. April 7–11, 2025. URL of this page. Accessed on: today’s date.
Seasonal greenhouse gas emissions from dairy manure slurry storages in New York State
Due to a technical glitch, the beginning of the recorded presentation was not recorded. Please accept our apologies.
Purpose
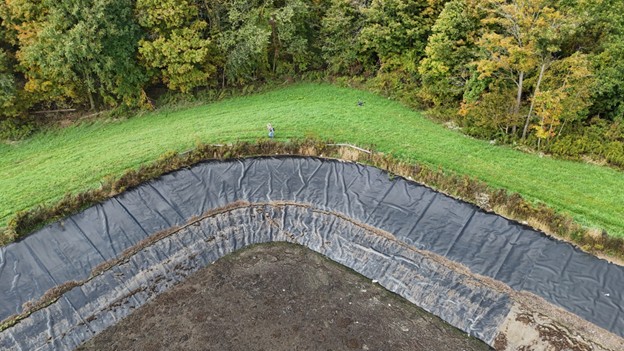
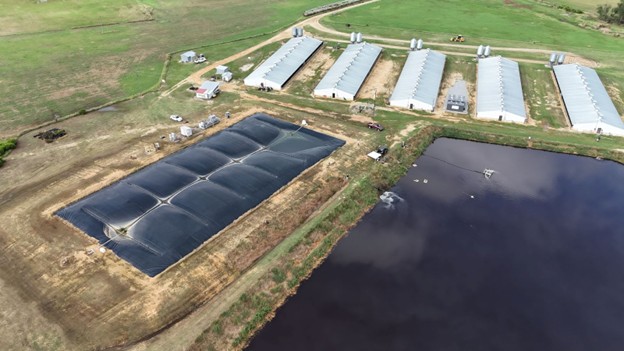
As the adoption of dairy manure storage systems has increased as a best management practice for protecting water quality, the anaerobic conditions in these systems has inadvertently led to an increase in emission of the greenhouse gas methane. Current inventory and modeled estimates of this potent greenhouse gas are based on limited datasets, and there is a need for methodologies to better quantify these emissions so that the impacts of storage conditions, manure treatments and seasonality can be better assessed, mitigation strategies can be implemented, and greenhouse gas reduction estimates can be correctly accounted for.
What Did We Do?
 We are developing a ground-based, mobile measurement approach where manure storage systems are circled with a backpack methane gas analyzer and measurements are integrated with on-site wind measurements to calculate emission flux rates. Twelve commercial dairy farm manure storage systems, representing a range of herd sizes and pre-storage manure treatments are collaborating on the research. Once per month, each manure storage structure at each site is circled 10 consecutive times with a methane gas analyzer. A drone equipped with a separate methane analyzer is also used to verify ground-based measurements amidst the methane plumes. Divergence (Gauss’s) theorem is then applied to concentration measurements and anemometer wind data to estimate the net rate of methane flux. These observed methane emission fluxes are compared to International Panel of Climate Change (IPCC) modeled emissions as well as state inventories.
What Have We Learned?
 We find that this methodology provides a reliable, cost-effective way to estimate methane emissions from manure storages. Observed emissions track modeled emissions with similar magnitudes, though models may be overestimating emissions during the growing season and underestimating during the winter months in this region (Figure 1). While emissions patterns are generally similar for each of the farm sites, with some farms and some individual monthly observational estimates there can be substantial deviation from predicted emission rates.
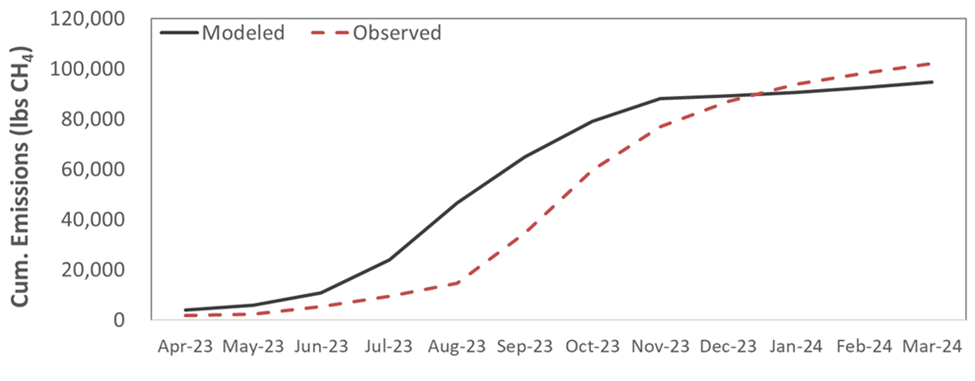
- Figure 1. Modeled and measured cumulative methane emissions from a dairy manure storage system over a 12-month period.
Future Plans
 Evaluation of 2024 field data is ongoing, and we will continue to measure methane around storages with ground-based and drone measurements into the summer of 2025. We will explore plume dynamics and the effects of pre-storage treatments on measured methane emission flux. For select sites, measurements will be expanded to include continuous, open-path laser absorption spectroscopy to verify this novel measurement approach, footprint emissions, and explore the implications of pre-storage manure treatments.
Authors
Presenting & corresponding author
Jason P. Oliver, Dairy Environmental Systems Engineer, Cornell University | PRO-DAIRY, jpo53@cornell.edu
Additional authors
Lauren Ray, Agricultural Sustainability and Energy Engineer, Cornell University | PRO-DAIRY
Eric Leibensperger, Associate Professor, Physics and Astronomy, Ithaca College
Additional Information
https://leibensperger.github.io/
Acknowledgements
Funding for this work was provided by the New York State Department of Agriculture and Markets. Agreement # CM04068CO
The authors are solely responsible for the content of these proceedings. The technical information does not necessarily reflect the official position of the sponsoring agencies or institutions represented by planning committee members, and inclusion and distribution herein does not constitute an endorsement of views expressed by the same. Printed materials included herein are not refereed publications. Citations should appear as follows. EXAMPLE: Authors. 2025. Title of presentation. Waste to Worth. Boise, ID. April 7–11, 2025. URL of this page. Accessed on: today’s date.
Effect of Swine Manure Nitrification on Mesophilic Anaerobic Digester Performance
Purpose
This study seeks to quantify the impact of swine slurry nitrification on biogas productivity. Ammonia (NH3) is produced during anaerobic digestion of manure and emitted during storage. Ammonia emissions have adverse impacts on swine health and growth, caretaker health, and local air and water quality. Ammonia is also known to inhibit methanogenic activity during anaerobic digestion, reducing methane potential. Thus, reducing ammoniacal nitrogen in digester feedstock can improve digester performance. A novel approach to nitrogen management, developed by a commercial partner, is nitrifying flush water that feeds into the digester. This technology leverages nitrification to suppress NH3 volatilization through using low-pH, highly nitrified substrate to flush the barns. This alternative reduces in-barn NH3 concentration surge during flushing events. In addition, equilibrium between nitrified (oxidized) flush liquid and reduced urine-feces will reduce ammoniacal nitrogen levels in the feed entering the digester. A barn-scale system (17,000 gallons per day capacity) is currently under testing on a NC swine farm that has an anaerobic digester as part of the waste management system (Figure 1). Understanding the impacts of this treatment on anaerobic digestion under controlled conditions under different organic loading rates is needed. This study aimed to quantify impacts of flush water nitrification on biomethane yield (BMY) in swine manure under two different organic loading rates (OLRs).
What Did We Do?
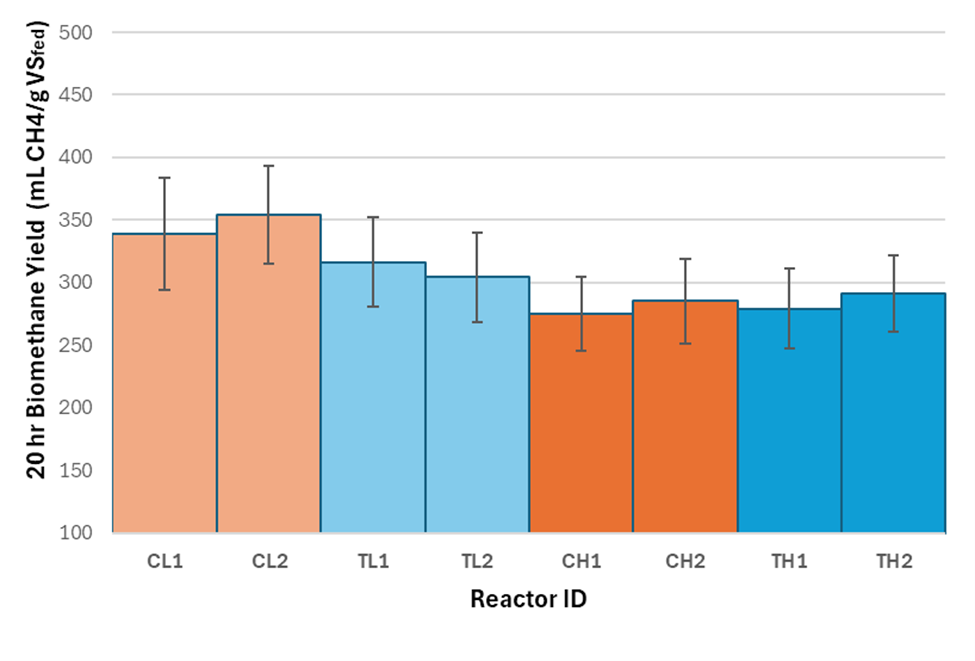
Three different substrates were collected for this study. Substrates were sourced from the same farm every 2 to 3 weeks (Figure 2). Swine slurry was processed through settling > decanting > maceration > screening to create liquid (<1% solids) and solid (>5% solids) fractions needed to formulate desired OLRs. Two OLRs were tested in this study, 1 g VS/L-d (low, L) and 2 g VS/L-d (high, H). For each OLR, two substrate formulations were tested: nitrified (treatment, T) and baseline (control, C). Therefore, four combinations of substrate and OLR were evaluated in this study and were abbreviated as: CH, CL, TH, and TL.

Eight mesophilic reactors at 95°F (35 °C), each with a two-liter active volume, were used to study the impacts of OLR and substrate type, with two replicates per OLR-substrate combination, represented by 1 or 2, respectively. Reactors were fed once daily, 6 days per week, unless otherwise noted. Influent and digestate total solids (TS), volatile solids (VS), chemical oxygen demand (COD), pH, alkalinity, and nitrogen forms were analyzed during the study. Biogas composition (% carbon dioxide (CO2), methane (CH4), and nitrogen gas (N2)), specific CH4 productivity (mL/g VS-fed), and volatile solids and COD reduction (%) were compared across treatments.
What Have We Learned?
Overall, comparable BMY values were observed across reactors with mean reactor productivity ranging from 275 to 354 mLCH4/g VS-fed. Average BMY for the reactors represented around 61% of typical values of ultimate biomethane potential (BMP) for swine manure reported in the literature, i.e., 450 to 550 mLCH4/gVS. Increasing OLR from 1 to 2 gVS/L-d resulted in a 14% decrease in BMY. The nitrogen treatment effect appears to be minimal and only limited to low OLR treatments. The percentage deviation of biomethane productivity between C and T reactors was less than 1%.
Similar to CH4, concentrations of CO2 were impacted more by OLR than the nitrogen treatment implemented. For low OLR reactors, Average CO2 concentrations in the biogas were for treatment reactors. Increasing the OLR showed an increase in CO2 concentration in the biogas, with control and treatment reactors containing approximately , respectively.
Future Plans
We plan to continue our data analysis to quantify reduction in VS and COD. Similarly, digestate characterization to quantify alkalinity and volatile fatty acids (VFAs) in the feedstock and digestates is ongoing. Two-way analysis of variance (ANOVA) will be conducted to assess treatment impacts on specific methane yield, VS and COD reduction. Denitrification occurring within reactors was further investigated via GC-TCD headspace analysis. We plan to closely analyze denitrification dynamics to capture the effect of treatment on nitrogen forms and organic matter in the substrates.
Authors
Presenting author
Kristina E. Jones, Graduate student researcher, North Carolina State University
Corresponding author
Mahmoud A. Sharara, PhD, Associate Professor and Extension Specialist, North Carolina State University, Msharar@ncsu.edu
Acknowledgements
This work was funded by Pancopia, Inc. as part of a Department of Energy, Small Business Innovation Research program grant (DOE SBIR, Grant No. DE-SC0020833). Authors would like to acknowledge Smithfield Foods for access and support sampling. and undergraduate student researchers: Brian Ngo, Nick Bell, Kiarra Condon, Himanth Mandapati, and Jackson Boney for assistance and support conducting this study.
The authors are solely responsible for the content of these proceedings. The technical information does not necessarily reflect the official position of the sponsoring agencies or institutions represented by planning committee members, and inclusion and distribution herein does not constitute an endorsement of views expressed by the same. Printed materials included herein are not refereed publications. Citations should appear as follows. EXAMPLE: Authors. 2025. Title of presentation. Waste to Worth. Boise, ID. April 7-11, 2025. URL of this page. Accessed on: today’s date.
High Clearance Robotic Irrigation Impacts on Soybeans and Corn Yield and Nutrient Application
Purpose
This collaborative project between The Ohio State University, Iowa State University, and 360YieldCenter intends to demonstrate the in-season application of commercial and animal nutrient sources and water application as a unified strategy to reduce nutrient losses while improving profitability with increased grain yields. A new and innovative high-clearance robotic irrigator (HCRI) is being used to apply liquid-phase nutrients in-season beyond all stages of row crops. Replicated strip trials of Fall, Spring, and in-season application will occur using the HCRI (e.g., 360 RAIN Robotic Irrigator, Figure 1). The in-season application consists of traditional N and P application rates as well as reduced rates to take advantage of better matching nutrient availability to crop needs during the growing season. Data were collected to verify nitrate-nitrogen leaching loss using liquid swine manure as a nutrient source in Iowa, while total and dissolved reactive phosphorus losses with both runoff and leaching using commercially available nutrients were collected in in Ohio. Secondly, as climate shifts result in water scarcity during critical crop growth stages, robotic irrigation water applications will be used to meet the crop needs. Higher crop yields are anticipated via precision water management.

What Did We Do?
OSU is conducting two field demonstrations, one with a focus on water quality, and a second for comparison of nutrient management practices. The HCRI is being utilized to apply commercial fertilizer in-season via dilution in irrigation water with up to 12 applications per growing season (effective 4.5 in. of precipitation season dependent). Nutrient injection rates (N and P) are scaled to plant nutrient uptake and irrigator pass intervals. Both sites are farmed in accordance with existing crop rotation and standard practices.
Beck’s Hybrid Site (West 1A) – The Beck’s Hybrid site (78 ac) is subdivided in accordance with the sub-watershed boundaries and managed with two treatments: 1) conventional commercial fertilizer application in accordance with the Tri-State Fertilizer recommendations, and 2) in-season nutrient management (N and P) using the HCRI and Tri-State Fertilizer Recommendations with the exception nutrient application matching with plant nutrient uptake rates as judged by growing degree days (GDD). This site is instrumented as a paired watershed for surface water and subsurface tile drainage. Further, these watersheds are monitored for precipitation, flow, and water quality (nitrate, nitrite, total phosphorus and DRP).
Molly Caren Agricultural Center (MCAC) Site 1 (Field 7) – Field demonstrations at this site (140 ac) are laid-out in a randomized complete block design (RCBD) strip trial design with treatments that include: 1) commercial fertilizer application (N and P) in accordance with the Tri-State Fertilizer recommendations, 2) in-season nutrient management (N and P) using the HCRI and Tri-State Recommendations with the exception nutrient application matched with crop nutrient uptake rates based on growth stages as determined by GDD, and 3) in-season nutrient management (N and P) using the HCRI and 67.7% Tri-State recommend application rates matched with crop nutrient uptake rates based on growth stages (GDD). Strip trials are 160 ft. in width and approximately 1,170 ft. in length (4.3 ac treatments) with eight replicates.
MCAC Site 2 (Field 8A) – Field demonstration site used to test HCRI and “sandbox” for other RCBD trials outside of NRCS CIG grant to discovery and planning for future projects. This site varies depending on studies each year, but trials are completed via RCBD strips.
Data Collection and Analysis – Demonstration sites are grid sampled each season on a 1-ac grid (Beck’s) and within treatments (MCAC site) to monitor soil fertility levels. Soil moisture and temperature in situ sensors (CropX) are placed in both study locations (three per treatment, 15 total sensors). Tissue samples are collected by treatment type to assess nutrient uptake at three stages of crop growth. Harvested crops are scaled by treatment to ensure yield monitor accuracy. Remote sensing imagery (RGB, ADVI and thermal) is collected 10 or more times during the growing season to evaluate crop growth and development. Data is analyzed using RCBD procedures in SAS.
Water Quality Assessment – Surface and subsurface (tile) monitoring capacity was established in 2016 at the Beck’s Hybrid Site. Two isolated subareas within a single production field were identified and the surface and subsurface pathways were instrumented with control volumes and automated sampling equipment. Surface runoff sites were equipped with H-flumes while compound weirs were installed at each of the subsurface (tile) outlets. Each sampling point (two surface and two subsurface) is equipped with an automated water quality sampler and programmed to collect periodic samples during discharge events. Once collected, samples will be analyzed for N and P. An on-site weather station provides weather parameters. Water samples are collected weekly from the field plots during periods of drainage and follow the same ISU protocol for NO3–N. Dissolved reactive phosphorus (DRP) and digested (total phosphorous) samples are analyzed using ascorbic acid reduction method.
What Have We Learned?
2023 Results
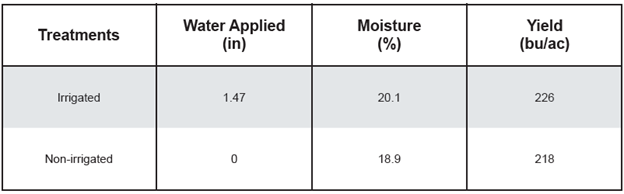
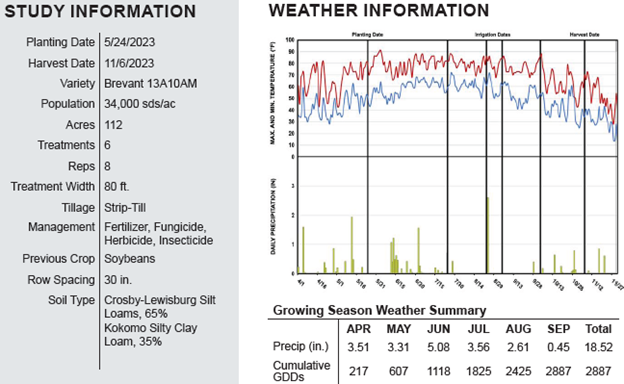
At the Beck’s Hybrid location field West 1A was planted to corn for the 2023 cropping season. There was an 8.0 bu/ac difference between irrigated and non-irrigated treatments. Nitrogen was injected using the rain unit and put on crop for the first application and use of the rain machine. Not having the rain unit in June made a significant difference in this study. The results of this location from 2023 should be taken lightly as complete implementation was not done until August. Location study information can be seen in Figure 2 and results in Figure 3.

In 2023, field 7 at MCAC was in soybeans and had no irrigation completed for this growing season.
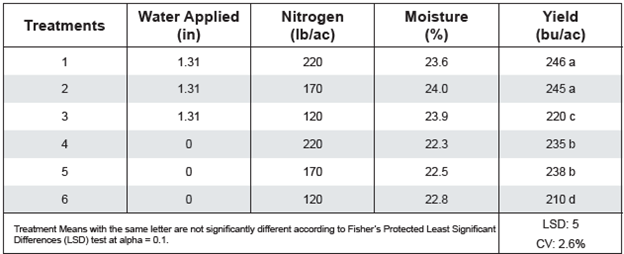
Field 8A at MCAC was in corn for the 2023 cropping season. Irrigation had a statistically significant effect on yield over all treatments. Nitrogen had statistical significance from 120 versus 170 and 220 units on nitrogen treatments. The 170 units of nitrogen was the optimal amount of nitrogen for all treatments. Not having the irrigator installed in early June caused there to be less yield in irrigated treatments. The results of this location from 2023 should be taken lightly as complete implementation was not done until August. Location study information can be seen in Figure 4 and results in Figure 5.
2024 Results
Field 7 at MCAC was in corn for the 2024 cropping season. Irrigation had a statistically significant effect on yield over all treatments. There was a 48 bu/ac between irrigated two-thirds nutrients and non-irrigated and 44 bu/ac between irrigated and non-irrigated for the 2024 growing season. A total of 773 gallons of diesel was used to run the irrigator for this trial for 2024 cropping season across 71 acres. A total of 25,739 kWh was used to run the electric pumps, base station, and well for 2024 growing season across 71 acres. These are the initial results that were published in efields and further results will continue to be analyzed to meet all project objectives. This data will be used to help in evaluating HCRI versus traditional crop production and management practices to meet project objectives. Location study information can be seen in Figure 6 and results in Figure 8. In Figure 7, aerial imagery can be seen from the 2024 cropping season.

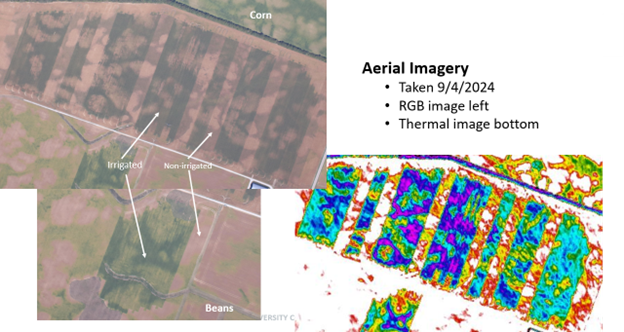

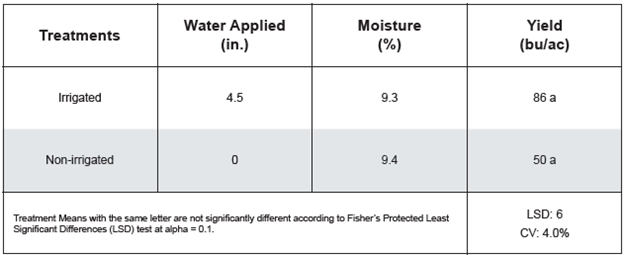
Field 8A at MCAC was in soybeans for the 2024 cropping season. Irrigation had a statistically significant effect on yield over non-irrigated. A total of 211 gallons of diesel was used to run the irrigator for this trial for 2024 cropping season across 11 acres. A total of 3,475 kWh was used to run the electric pumps, base station, and well for 2024 growing season across 11 acres. Location study information can be seen in Figure 9 and results in Figure 10. In Figure 7, aerial imagery can be seen from the 2024 cropping season.

Future Plans
During the next 12 months, we are planning for the HCRI operation at the two sites for cropping practices and irrigation for 2025 growing season. We will be aggregating weather data, agronomic data, plant samples, surface and ground water quality samples, and machine performance data for all years of the project with the current end date as spring of 2026. We are hoping to continue to perform testing with this technology and implementing the dry product skid for field operations for the 2025 growing and full-scale implementation across all studies in 2026. The results from the Iowa State portion of this funded project will also be reported in the future as well. There is a significant need to further develop programs for injecting macro and micronutrients in liquid and granular form for growers. The potential to significantly cut application rates exists with this technology. Also, implementing this technology with liquid livestock manure producers will change the paradigm of how manure is managed in the future.
Authors
Presenting & corresponding author
Andrew Klopfenstein, Senior Research Engineer, The Ohio State University, Klopfenstein.34@osu.edu
Additional authors
Justin Koch, Innovation Engineer, 360YieldCenter; Kapil Arora, Field Agricultural Engineer, Iowa State University; Daniel Anderson, Associate Professor, Iowa State University; Matthew Helmers, Professor, Iowa State University; Kelvin Leibold, Farm Management Specialist, Iowa State University; Alex Parsio, Research Engineer, The Ohio State University; Chris Tkach, Lecturer, The Ohio State University; Christopher Dean, Graduate Research Associate, The Ohio State University; Ramareo Venkatesh, Research Associate, The Ohio State University; Elizabeth Hawkins, Agronomics Systems Field Specialist, The Ohio State University; John Fulton, Professor, The Ohio State University; Scott Shearer, Professor and Chair, The Ohio State University
Additional Information
eFields On-Farm Research Publication 2023 and 2024 Editions – https://digitalag.osu.edu/efields
Acknowledgements
Natural Resources Conservation Service – Conservation Innovation Grant (NR223A750013G037)
Ohio Department of Agriculture – H2Ohio Grant
USDA, NRCS, 360YieldCenter, Beck’s Hybrids, Molly Caren Agricultural Center, Rooted Agri Services, Iowa State University, The Ohio State University
The authors are solely responsible for the content of these proceedings. The technical information does not necessarily reflect the official position of the sponsoring agencies or institutions represented by planning committee members, and inclusion and distribution herein does not constitute an endorsement of views expressed by the same. Printed materials included herein are not refereed publications. Citations should appear as follows. EXAMPLE: Authors. 2025. Title of presentation. Waste to Worth. Boise, ID. April 7-11, 2025. URL of this page. Accessed on: today’s date.
Leveraging Carbon Intensity Scoring for Sustainable Livestock Feed Supply Chains
Purpose
As market demands, consumer expectations, and environmental regulations evolve, agricultural producers increasingly focus on improving profitability while minimizing environmental impact. Carbon Intensity (CI) scoring is a tool that quantifies the greenhouse gas emissions associated with crop production, thereby helping producers understand their ecological footprint. CI scores may influence crop sales for biofuel production for corn and soybean producers and may eventually affect livestock feed markets as companies seek carbon-neutral supply chains. Furthermore, renewable fuel producers may become eligible for Low Carbon Fuel Standard (LCFS) credits, where revenue is contingent on the lifecycle CI score of the fuel, and similar economic approaches may be required to drive livestock feeds toward carbon neutrality. Biofuels and animal feed share a strong relationship; ethanol plants generate distiller grains, a key component of livestock diets, and soybean processing plants generate soybean meal and soybean oil. Distiller grains represent a large portion of livestock feed, and soybean oil is a common biodiesel feedstock. We evaluate the emissions associated with corn and soybean production for each county in Iowa, assessing how their yield, crop rotation, tillage practices, cover crop implementation, and manure application affect their CI scores.
What Did We Do?
This study used the Department of Energy’s Feedstock Carbon Intensity Calculator (FD-CIC) and published literature to estimate corn and soybean production emissions throughout Iowa counties. Manure nutrient volumes were found using animal feeding operation data from Iowa DNR and manure production characteristics from ASAE D384.2. Data for yield, acres of corn, acres of soybean, acres of cover crop, acres of no-tillage, acres of reduced tillage, and acres of intensive tillage by county in Iowa were found using the USDA Quick Stats Database. Diesel emissions and grain drying emissions were calculated using Iowa State University Extension resources. The nitrogen fertilizer application rate was calculated using the yield goal method (manure) and Iowa State University Extension resources (commercial fertilizers). Limestone emissions were directly correlated to the amount of CaCO3 necessary to neutralize the H+ added to the soil from manure nitrogen and anhydrous ammonia. Embedded fertilizer emissions, biomass degradation emissions, leguminous N fixation emissions, and specific fuel emission factors were pulled from FD-CIC. Corn and soybean CI scores were calculated in g CO2e/bu units. Through this work, we provide actionable insights for corn and soybean supply chain stakeholders interested in improving sustainability and expanding revenue opportunities.
What Have We Learned?
Key emission sources from corn and soybean production are nitrous oxide (N2O) from fertilizer and manure application, biomass residue degradation, embedded emissions from fertilizer production, and tractor diesel emissions. Reducing CI in corn production can be achieved through increased yield, reduced tillage, increased cover crop, and manure application. Reduced tillage and increased cover cropping increase soil organic carbon (SOC). Depending on the location and its existing soil characteristics, reduced tillage, and cover crops can sequester soil carbon, decreasing the overall CI score of the corn and soybeans. On average, SOC reduced CI scores by 6% and 18% for corn and soybeans, respectively.
Yield significantly impacted CI scores; counties with greater yield featured reduced CI scores. The CI score dropped by 33 g CO2e/bu for corn as yield increased by bu/acre with an R2 of 0.53. For soybeans, the CI score dropped by 72 g CO2e/bu as yield increased by bu/acre with an R2 value of 0.19.
Manure also significantly impacted CI scores. Although manure has increased diesel emissions compared to anhydrous ammonia application, manure lacks the embedded emissions of anhydrous ammonia, P2O5, and K2O fertilizers. As the percentage of manure-derived nitrogen increased by 1%, the CI score for corn reduced by 14 g CO2e/bu, featuring an R2 of 0.25. As the percentage of manure-derived P2O5 increased by 1%, the CI score for soybeans reduced by 25 g CO2e/bu, featuring an R2 of 0.68.
Crop rotation had a less intuitive effect on the CI score. Corn-soybean (CS) rotations typically have higher yields, reduced nitrogen fertilizer inputs, and reduced tillage. Nonetheless, continuous corn (CC) rotations facilitate greater build-up of SOC (assuming county tillage practices are evenly distributed among corn and soybean acres). Also, CC rotations occurred more frequently in high-yielding counties. For these reasons, the CS rotation was not associated with a reduced CI score.
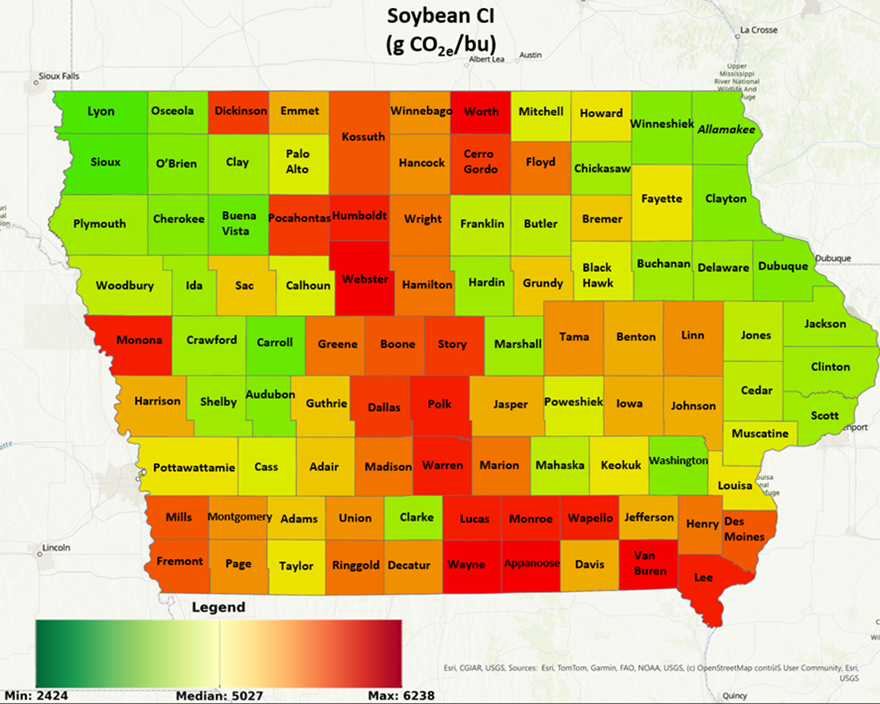
Figure 1 and Figure 2 show carbon intensity scores of corn and soybean, respectively, for all counties throughout Iowa. Green counties typically feature greater yields, greater manure volume, and more significant SOC accumulation, whereas red counties typically feature opposite trends. It is worth noting that while CI scores are calculated per bushel, corn production averages roughly 194 bushels per acre, whereas soybean averages approximately 57 bushels per acre.

Future Plans
Future analysis includes evaluating the CI scores of biofuels and animal feed produced in Iowa counties where the corn and soybean CI scores have already been assessed. Additionally, we intend on investigating the economics of implementing emission reduction strategies, considering potential yield loss and expenses of associated field activities. Also, by applying the methods of this paper to decades of historical data, we plan on analyzing how corn and soybean CI scores have evolved throughout time. Lastly, we will project future emission reduction strategy adoption and predict how CI scores of feed and fuel will change throughout the next decade.
Authors
Presenting author
Luke Soko, Graduate Student, Iowa State University
Corresponding author
Dan Andersen, Associate Professor, Iowa State University, dsa@iastate.edu
The authors are solely responsible for the content of these proceedings. The technical information does not necessarily reflect the official position of the sponsoring agencies or institutions represented by planning committee members, and inclusion and distribution herein does not constitute an endorsement of views expressed by the same. Printed materials included herein are not refereed publications. Citations should appear as follows. EXAMPLE: Authors. 2025. Title of presentation. Waste to Worth. Boise, ID. April 7-11, 2025. URL of this page. Accessed on: today’s date.
Manure Nutrient Sensing Technologies
Due to a technical glitch, we did not get this presentation recorded. Please accept our apologies.
Purpose
Manure is a critical resource in livestock production as it contains many essential nutrients required for crop growth. However, as a nutrient source, manure is highly variable, and nutrient composition may fluctuate significantly during emptying of manure storages if not properly agitated. Accounting for this variability requires extensive sampling, which is often cost and time prohibitive for haulers and producers.
The aim of this study is to evaluate a commercially available manure nutrient sensor utilizing near-infrared spectroscopy (NIRS) to provide real-time manure nutrient data. The study investigates the impact of NIRS systems in the field to achieve target nutrient application rates and assess effects on crop nutrient use efficiency (NUE) and yield compared to conventional sampling and fixed-rate application methods.
What Did We Do?
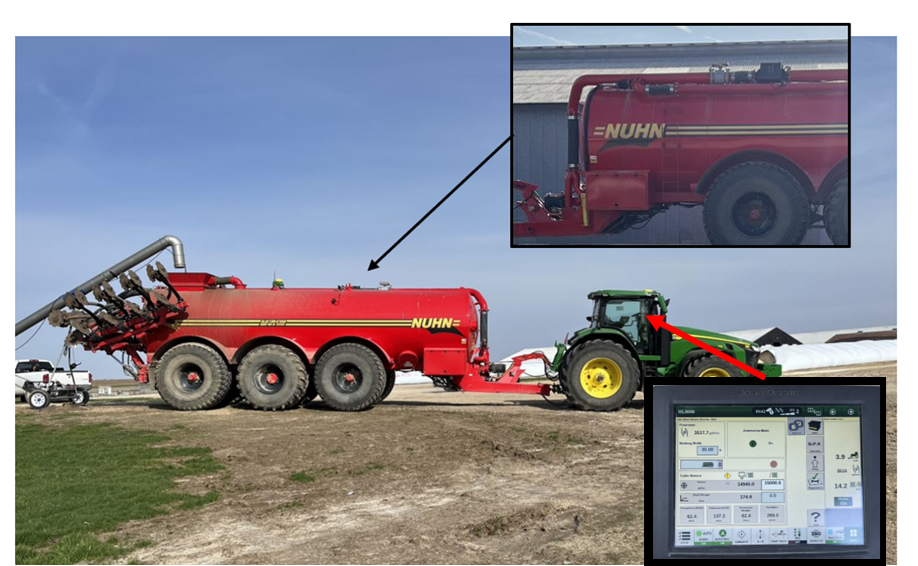
A manure tanker was outfitted with a John Deere HarvestLab 3000 setup for manure nutrient sensing. The setup included the sensor, a Krone flow meter, and a John Deere rate controller (Figure 1). Manure nutrient values from the sensor were recorded in real time. The controller then set specific target rates for a nutrient and the automation system adjusted the tractor speed or manure pump rate to meet the target.
Field trials were conducted in Wisconsin on silt loam soil. Manure was applied to strip plots to meet three specific nitrogen application rates using both the NIRS sensor and conventional sampling and application methods. During application, composite manure samples were collected to assess the sensor’s accuracy. After manure application, the field was planted with corn silage, and following harvest, NUE and yield were evaluated.
What Have We Learned?
In the first year of the study, the NIRS sensor outperformed conventional sampling methods in achieving target nitrogen rates. Across the application plots, the NIRS sensor delivered manure at a nitrogen rate in the range of 20 to 30 lbs N/ac over the target rate, whereas conventional sampling led to overapplication by 40 lbs N/ac to 95 lbs N/ac. During application, the system also tracked other nutrients, such as phosphorus and ammonium, but laboratory analysis indicated that the sensor was less accurate for these nutrients compared to nitrogen. While manure application rates varied, there was little difference in crop yield or NUE between treatments at harvest.
The NIRS sensor shows promise as a tool to revolutionize manure nutrient accounting in cropland. Its ability to track manure variation in real time could significantly improve nutrient management. Figure 2 demonstrates how the system tracked manure nitrogen, phosphorus, and potassium levels over time following a reduction in agitation. This type of tracking may help reduce the need for excessive agitation and enhance manure utilization efficiency.

Future Plans
Researchers plan to continue field trials over multiple years to assess long-term impacts on nutrient use efficiency and soil nutrient management. Additionally, with new calibration updates since the original trial, future studies will evaluate the sensor’s accuracy in measuring phosphorus and its ability to meet phosphorus-based manure application targets while simultaneously tracking nitrogen for improved supplemental nitrogen prescriptions. Overall, the goal of the project is to provide producers and haulers with information on how effective the system is and ways in which it can be used to enhance on-farm efficiency.
Authors
Presenting & corresponding author
Joseph R. Sanford, Assistant Professor, University of Wisconsin -Platteville, sanfordj@uwplatt.edu
Additional authors
Rebecca A. Larson, Professor, Nelson Institute for Environmental Studies, University of Wisconsin-Madison; Tyler Liskow, Engineer, Nelson Institute for Environmental Studies, University of Wisconsin-Madison
Acknowledgements
This material is supported by the Wisconsin Dairy Innovation Hub and the National Institute of Food and Agriculture, U.S. Department of Agriculture, under award number 2022-69008-36506. Any opinions, findings, conclusions, or recommendations expressed in this publication are those of the author(s) and do not necessarily reflect the view of the U.S. Department of Agriculture or the Wisconsin Dairy Innovation Hub.
The authors are solely responsible for the content of these proceedings. The technical information does not necessarily reflect the official position of the sponsoring agencies or institutions represented by planning committee members, and inclusion and distribution herein does not constitute an endorsement of views expressed by the same. Printed materials included herein are not refereed publications. Citations should appear as follows. EXAMPLE: Authors. 2025. Title of presentation. Waste to Worth. Boise, ID. April 7-11, 2025. URL of this page. Accessed on: today’s date.
Optimizing Manure Application Timing for Methane Reduction and Economic Gains through Carbon Credits
Purpose
Methane emissions from manure storages significantly contribute to the livestock industry’s carbon footprint. While various manure management strategies are used to reduce greenhouse gas (GHG) emissions on farms, such as anaerobic digestion and composting, many of these strategies are cost-prohibitive for small-to-medium-sized farms. Strategic manure application timing to limit GHG emissions is a practical, scalable option to reduce methane production in manure storages.
Carbon credits are financial incentives for farmers who adopt practices that reduce greenhouse gas emissions, such as cover crops or methane emissions abatement. These credits can then be sold to companies seeking to offset their emissions. This study evaluates the impact of manure application timing on methane emissions from storages and explores how carbon credits could act as an incentive for farms to employ climate-smart manure management practices. By comparing different manure application strategies (fall, spring, in-season sidedress, and split applications), we assess the methane reductions and improved economics of optimized timing.
What Did We Do?
Methane emissions were estimated using data from a lab-based study conducted by Andersen et al. (2015), who measured methane emissions from deep-pit swine manure at various temperatures. From this data, we created a model incorporating manure production rates and ambient temperature dynamics to predict daily methane emissions from a 4800-head slurry storage and 4800-head deep-pit swine production facility.
Seven application scenarios were compared: fall (November 1), spring (April 15), sidedress (June 1), fall-spring, fall-sidedress, spring-sidedress, and fall-spring-sidedress split applications. Total methane emissions were calculated for each scenario, allowing us to determine the GHG emissions abated by shifting from a fall application to an alternate strategy. An economic assessment was conducted using a $30/metric ton carbon dioxide equivalent (MT CO2e) carbon credit valuation to determine the financial implications of these methane mitigation strategies.
What Have We Learned?
For our swine slurry store model, methane emissions were highest in the single fall application scenario due to the full storage attained during peak summer temperatures, with annual emissions totaling nearly 0.5 MT CO2e/pig-space (Figure 1). Shifting application to spring or sidedress reduced emissions by approximately 50%. Split applications showed a further reduction in emissions by maintaining lower storage volumes throughout the year.

From an economic perspective, carbon credits significantly enhanced the financial viability of the new application strategies. Carbon credits from abated emissions are projected to bring a maximum of $10/pig-space, or about $74/acre, to the farm annually in the F-S-SD scenario (Table 1). The improved manure application timing can also benefit crop yield, making a spring or sidedress manure application even more economically favorable.
Table 1: Projected carbon credit income for a 4800-head wean to finish swine farm with a slurry storage for fall, spring, sidedress, fall-spring split (F-S), fall-sidedress split (F-SD), spring-sidedress split (S-SD), and fall-spring-sidedress split (F-S-SD) applications.
| Fall | Spring | Sidedress | F-S | F-SD | S-SD | F-S-SD | |
| Carbon Credit Income
($/acre) |
$ – | $ 33.63 | $ 33.71 | $ 41.95 | $ 45.82 | $ 45.69 | $ 52.06 |
| Carbon Credit Income
($/pig-space) |
$ – | $ 6.50 | $ 6.51 | $ 8.10 | $ 8.85 | $ 8.83 | $ 10.06 |
Future Plans
Further research should be conducted to refine the temperature aspect of the model. In the slurry store model, we assume that the manure temperature equals the 10-day average temperature. A study to verify the true manure temperature throughout the year would improve the confidence level of the current model. For deep pit barns, we use measured temperature data from 58 barns over 13 months, but manure temperatures were collected from the manure pump out access port and may not represent average manure temperatures in the barn. Future models to assess differences between deep pit and slurry store emissions will highlight the optimal manure management strategies for limiting GHG emissions.
Using specialized high-clearance irrigation equipment, like the 360 RAIN from 360 Yield Center, could enhance the feasibility of more frequent manure applications, reducing methane emissions while maintaining crop nitrogen availability. Additionally, developing standardized carbon credit protocols for manure management could create opportunities for more producers to monetize methane reduction efforts, further incentivizing climate-smart manure application strategies.
Authors
Presenting author
Jacob R. Willsea, Graduate Research Assistant, Iowa State University Department of Agricultural and Biosystems Engineering
Corresponding author
Daniel S. Andersen, Associate Professor, Iowa State University Department of Agricultural and Biosystems Engineering, dsa@isatate.edu
Additional Information
Andersen, D.S., Van Weelden, M.B., Trabue, S.L., & Pepple, L. M. (2015). Lab-assay for estimating methane emissions from deep-pit swine manure storages. Journal of Environmental Management, 159, 18-26. https://doi.org/10.1016/j.jenvman.2015.05.003
Talkin’ Crap Podcast Episode:
Andersen Lab Poster Repository:
https://iastate.box.com/s/3kkzdzcjlk9qcfrgbv6mj9x7vdk1v0fp
Acknowledgements
USDA-NRCS
Brent Renner
360 Yield Center
The authors are solely responsible for the content of these proceedings. The technical information does not necessarily reflect the official position of the sponsoring agencies or institutions represented by planning committee members, and inclusion and distribution herein does not constitute an endorsement of views expressed by the same. Printed materials included herein are not refereed publications. Citations should appear as follows. EXAMPLE: Authors. 2025. Title of presentation. Waste to Worth. Boise, ID. April 7-11, 2025. URL of this page. Accessed on: today’s date.