The purpose of this field research was to explore nitrogen (N) distribution in the form of nitrate and ammonium in both a spatial and temporal manner over two seasons in manure injection plots in central Pennsylvania. The description of N movement from high concentration at the manure band through the season can aid in understanding of nutrient migration and utilization efficiencies. The work was complimentary to previous soil sampling protocol developed for mid-season nitrate testing in corn fields with injected manure.
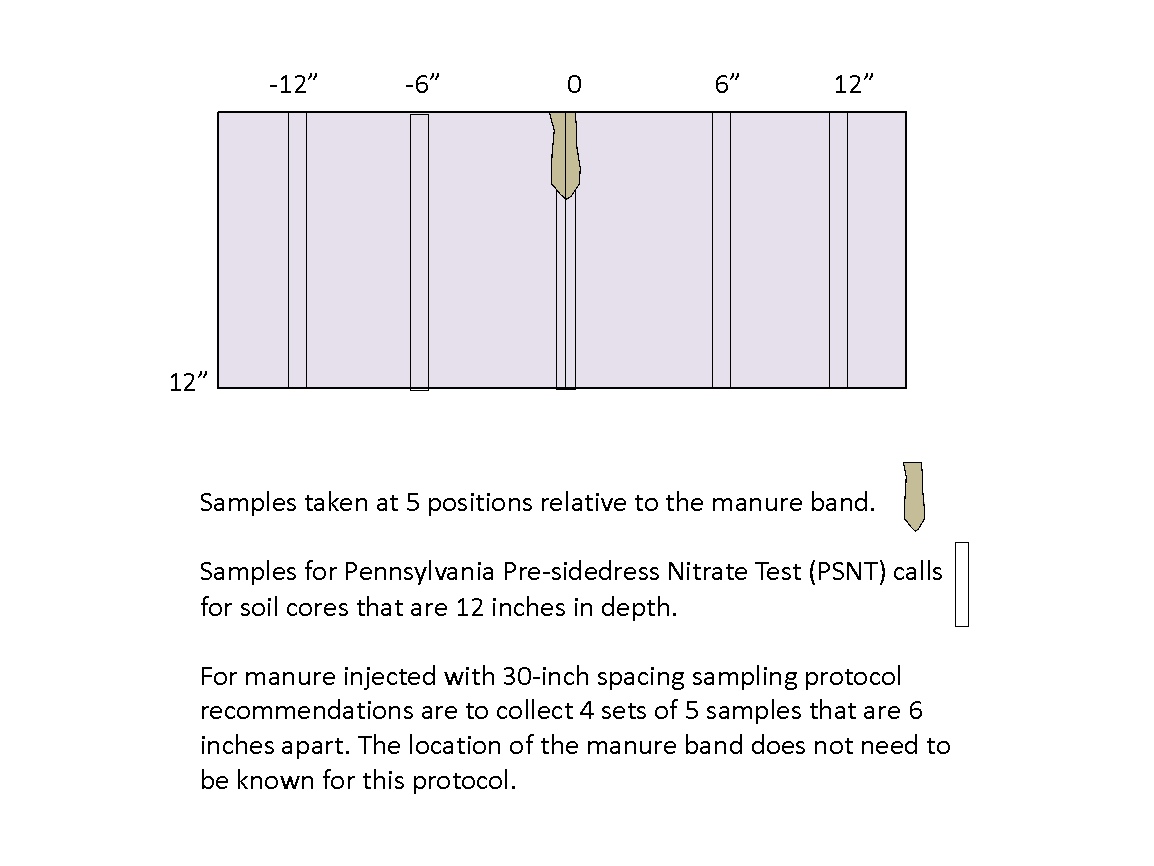
Mid-season soil testing for N protocols such as the Pre-Sidedress Nitrate Test in corn can be valuable tools to examine nutrient efficiencies. Economic benefit can result when producers use test information to determine if current soil N will allow maximum crop growth or if additional N sidedressing is needed to reach yield goals. Environmental benefits of the test include optimizing in-field N while minimizing excess application of the nutrient. However, conducting the test on soils where manure injection has occurred presents accuracy challenges due to uneven nutrient distribution. A soil sampling protocol for these scenarios was presented at the 2017 Waste to Worth Conference. The protocol calls for composite collection of four sets of soil samples, with each set containing five soil cores of 12-inch depth collected six inches apart from each other in a line perpendicular to the direction of manure injection (Figure 1).
Figure 1. Earlier work determined that collecting and compositing four sets of five soil samples that were 12-inches deep and 6-inches apart where manure injection banding was in place was an accurate substitution for Pre-sidedress Nitrate Testing compared to soils with surface broadcasted nitrogen.
What did we do?
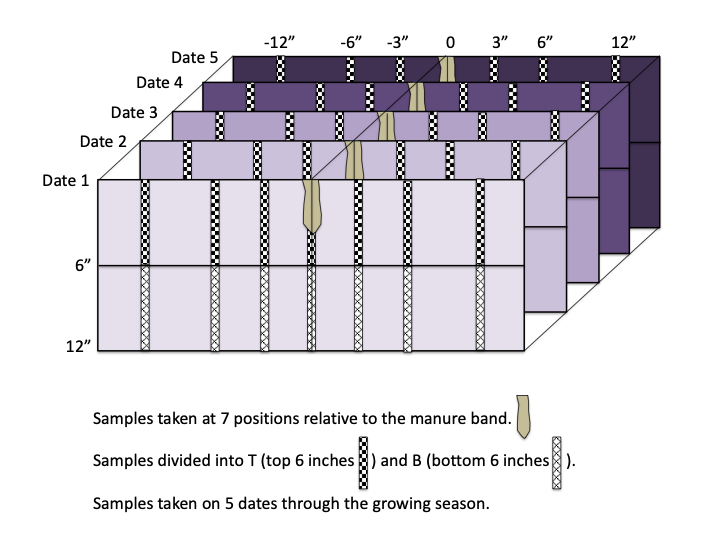
In the current research, N measurements were taken at several distances from the manure band center and analyzed at depths of 0-6 inches and 6-12 inches. Measures in manure plots were collected at five different dates through each of two growing seasons (Figure 2).
Figure 2. Current research explored nitrogen distribution through 5 dates in the growing season to develop both a spatial and temporal appreciation of nitrate distribution and efficiencies.
What have we learned?
Results show that N concentrations ‘peak’ in the region immediately near the injection band early in the season and then flatten through the season. A comparison of the top 6-inch samples with average of the both sampling depths indicate that the top 6 inches may be predictive of the entire 12-inch depth. This presentation will provide results and trends observed in N movement from injection bands in these soil plots.
Authors
Robert Meinen, Senior Extension Associate, Department of Animal Science, The Pennsylvania State University, rjm134@psu.edu
The authors are solely responsible for the content of these proceedings. The technical information does not necessarily reflect the official position of the sponsoring agencies or institutions represented by planning committee members, and inclusion and distribution herein does not constitute an endorsement of views expressed by the same. Printed materials included herein are not refereed publications. Citations should appear as follows. EXAMPLE: Authors. 2019. Title of presentation. Waste to Worth. Minneapolis, MN. April 22-26, 2019. URL of this page. Accessed on: today’s date.
A Best Management Practice (BMP) Expert Panel was convened under guidance of the Chesapeake Bay Program’s (CBP) Water Quality Goal Implementation Team to assess and quantify Nitrogen and Phosphorus load reductions for use in the Phase 6 Chesapeake Bay Watershed Model when manure is injected or incorporated into agricultural lands within the watershed. (Further description of Expert Panels and processes can be found in the 2017 Waste to Worth Proceedings and Presentation by Jeremy Hanson and Mark Dubin).
What Did We Do?
The Expert Panel first created definitions of injection and incorporation practices, which allowed technologies utilized in research to be categorized within each definition. Categorization considered the manner in which manure was placed beneath the soil surface as well as the level of surface disturbance. Manure injection was defined as a specialized category of placement in which organic nutrient sources (including manures, biosolids, and composted materials) are mechanically applied into the root zone with surface soil closure at the time of application with soil surface disturbance of 30% or less. Manure incorporation was defined as the mixing of dry, semi-dry, or liquid organic nutrient sources (including manures, biosolids, and compost) into the soil profile within a specified time period from application by a range of field operations (≤24hr for full ammonia loss reduction credit and 3 days for P reduction credit(s)). Incorporation was divided into categories of high disturbance (<30% residue retention) and low disturbance (>30% residue retention). Both liquid and solid manures were considered.
The panel conducted an extensive literature review of research that allowed comparison of nutrient loss after manure injection and incorporation with a baseline of surface manure application without incorporation. These comparisons were assembled in a large categorical table in percentage form, that reflected loss reduction efficiency. Many manuscripts offered a percentage comparison of application treatments to the surface application baseline. For research reports that did not provide a percentage comparison, the panel interpreted results into a percentage comparison when possible.
Consideration to soil variability and location in the Chesapeake Bay Watershed was considered on a very broad basis and in a manner consistent with work of other panels and modeling team recommendations. Loss reduction efficiencies were provided for soils or locations listed as either Coastal or Upland regions. Nitrogen efficiencies did not vary between the regions, but Phosphorus efficiencies did.
What Have We Learned?
Nitrogen and Phosphorus loss reduction efficiency reported or derived from literature varied within categories. For some categories, the volume of literature was small. Research providing these efficiencies is often conducted on small plots with simulated rainfall. Literary reduction results were often provided as a range and not as a single value. Professional scrutiny and judgment was applied to each value provided from literature and to all values within injection and incorporation categories to determine loss reduction efficiencies to be used in the broad categories of the model. The final loss reduction efficiencies of the Expert Panel’s final report are provided in Tables 1 (Upland Region) and 2 (Coastal Region).
Table 1. Loss reduction efficiency values for Upland regions of the Chesapeake Bay Watershed.
Category
Nitrogen
Phosphorus
Time to Incorporation
Ammonia Emission Reduction
Reduction in N Loading1
Time to Incorporation
Reduction in P Loading2
Injection
0
85%
12%
0
36%
Low Disturbance Incorporation
≤24 hr
24-72 hr
50%
34%
8%
8%
≤72 hr
24%
High Disturbance Incorporation
≤24 hr
24-72 hr
75%
50%
8%
8%
≤72 hr
0%3
1 Reduction in N loading water achieved only for losses with surface runoff. The portion of total N loss through leaching is not impacted by the practices. 25% of total N losses to water are assumed to be lost with runoff (both dissolved N and sediment-associated organic matter N).
2 Reduction in P loading water achieved only for losses with surface runoff. The portion of total N loss through leaching is not impacted by the practices. 80% of total P losses to water are assumed to be lost with runoff (both dissolved and sediment-bound P) in upland regions of the watershed.
3 Reduction in dissolved P losses typically offset by greater sediment-bound P losses due to greater soil erosion with tillage incorporation in upland landscapes.
Table 2. Loss reduction efficiency values for Coastal Plain region of the Chesapeake Bay Watershed.
Category
Nitrogen
Phosphorus
Time to Incorporation
Ammonia Emission Reduction
Reduction in N Loading1
Time to Incorporation
Reduction in P Loading2
Injection
0
85%
12%
12%
0
22%
Low Disturbance Incorporation
≤24 hr
24-72 hr
50%
34%
8%
8%
≤72 hr
14%
High Disturbance Incorporation
≤24 hr
24-72 hr
75%
50%
8%
8%
≤72 hr
14%
1 Reduction in N loading water achieved only for losses with surface runoff. The portion of total N loss through leaching is not impacted by the practices. 25% of total N losses to water are assumed to be lost with runoff (both dissolved N and sediment-associated organic matter N).
2 Reduction in P loading water achieved only for losses with surface runoff. The portion of total N loss through leaching is not impacted by the practices. 48% of total P losses to water are assumed to be lost with runoff (both dissolved and sediment-bound P) in Coastal Plain.
Future Plans
The report of the Manure Injection and Incorporation Panel were accepted by the Chesapeake Bay Program’s Agricultural Workgroup in December 2016. The values will be utilized in Phase 6 of the Chesapeake Bay Watershed Model. Future panels may revisit the efficiencies as future model improvements are made.
Corresponding author (name, title, affiliation)
Robert Meinen, Senior Extension Associate, Penn State University
Funding for this panel was provided by the US EPA Chesapeake Bay Program and Virginia Tech University through an EPA Grant.
The authors are solely responsible for the content of these proceedings. The technical information does not necessarily reflect the official position of the sponsoring agencies or institutions represented by planning committee members, and inclusion and distribution herein does not constitute an endorsement of views expressed by the same. Printed materials included herein are not refereed publications. Citations should appear as follows. EXAMPLE: Authors. 2017. Title of presentation. Waste to Worth: Spreading Science and Solutions. Cary, NC. April 18-21, 2017. URL of this page. Accessed on: today’s date.
Injection of liquid manure provides a number of benefits to the environment and cropping systems. Manure placement under the soil surface conserves nitrogen by decreasing ammonia loss. Injection can be conducted in a manner consistent with no-till farming practices resulting in greater conservation of both soil and manure nutrients. Thus the value of manure to the crop is increased.
Traditional soil nitrate testing protocol recommendations were developed on lands that received evenly distributed broadcast manure applications. However, the banding of manure during injection presents a challenge for soil testing. Random placement of soil probes in banded fields could result in artificially high or low nitrate analysis depending on the sampling distance from manure bands.
Many states recommend such nitrate testing when the corn is about 12 inches tall. In the weeks following the soil test the crop will grow quickly with high N demand. Soil testing at this time allows the producer to determine if it will be profitable to sidedress the crop with an additional N source. For example, in Pennsylvania, the Pre-Sidedress Nitrate Test (PSNT) is utilized to measure soil nitrate when corn is around the six-leaf stage (about 12-18 inches). Sidedress nitrogen need is calculated using the soil nitrate test level, expected yield, and nitrogen available from previous legumes or manure applications.
Research was conducted to explore nitrate distribution in a two dimensional view perpendicular to manure injection bands. In the proposed presentation the research results and new soil testing protocol for early-season nitrate will be discussed. This work provides an excellent tool to assure economic and environmental optimization of manure nitrogen.
What is the Pre-Sidedress Nitrate Test (PSNT)?
In the mid-Atlantic region the Pre-Sidedress Nitrate Test (PSNT) is an accepted tool for measurement of Nitrogen availability to a growing corn crop. The test is conducted when corn reaches the six-leaf stage by taking a number of twelve-inch deep soil samples. The samples are quickly dried or frozen to halt microbial N transformations and sent to a soils laboratory. A measure of soil Nitrate (NO3) level provides an indication whether the soil contains enough N to sustain maximum yield through the remainder of the growing season. The PSNT provides guidance to determine supplemental N fertilizer rates needed for soil with a low measured NO3 level. The PSNT becomes suspect on grounds receiving manure injection. Random sampling near manure bands may give artificial confidence in NO3 availability, while samples away from bands may indicate unnecessary need for commercial fertilizer.
The purpose of this work was to determine a PSNT sampling protocol for soils receiving injected manure.
What did we do?
Dairy manure was injected prior to planting of corn using shallow-disc injection spaced at 30 inches. When corn was at the six-leaf stage a ‘Monolith’ soil sampler was used to remove blocks of soil in a perpendicular direction to manure injection bands. Twelve-inch deep PSNT soil cores were systematically removed every inch across the thirty-inch sample. Each of these was evaluated individually for NO3 concentration. Composite cores of all thirty samples were also evaluated. To provide comparison, similar samples were attained in Monolith samples from Control (no manure) and Broadcast Manure plots.
What have we learned?
Others have suggested pairing manure samples to attain an average for manure-injected soils, with one sample attained in the band and one between bands. In our study, analysis of NO3 levels in a perpendicular direction to travel of manure injection equipment demonstrated concentrations in a sine wave pattern with higher concentrations located near the injection bands. Further analysis showed that five samples taken at any positions perpendicular to the manure band, and spaced six inches apart provide a reliable and repeatable sampling method. Four sets of samples taken in this manner (20 soil cores in total) were statistically better at predicting soil Nitrate level then ten paired soil sample sets (20 soil cores in total). Using this sampling protocol, marking of manure bands is not necessary. Testing can be performed at random locations in the field.
Future Plans
Manure injection conserves Nitrogen in comparison to broadcast application. Some manure injection implements can be used with minimal soil surface disturbance that is acceptable within no-till guidelines. In the mid-Atlantic region, manure injection is expected to become more common as economics and regulations drive increased Nitrogen conservation. Release of this PSNT soil sampling protocol will allow producers to accurately manage N in growing corn. The protocol will assist in adoption of manure injection utilization by providing a tool by which producers can gain confidence and knowledge centered on their manure nutrient management. Utilization of this sampling protocol will advance environmental goals in water and air quality.
Authors
Robert Meinen, Senior Extension Associate, Penn State University rjm134@psu.edu
Douglas Beegle, Peter Kleinman, Heather Karsten, Glenna Malcolm
Additional information
Penn State NorthEast SARE Sustainable Dairy Cropping Systems Project
The authors are solely responsible for the content of these proceedings. The technical information does not necessarily reflect the official position of the sponsoring agencies or institutions represented by planning committee members, and inclusion and distribution herein does not constitute an endorsement of views expressed by the same. Printed materials included herein are not refereed publications. Citations should appear as follows. EXAMPLE: Authors. 2015. Title of presentation. Waste to Worth: Spreading Science and Solutions. Seattle, WA. March 31-April 3, 2015. URL of this page. Accessed on: today’s date.
Manage Cookie Consent
To provide the best experiences, we use technologies like cookies to store and/or access device information. Consenting to these technologies will allow us to process data such as browsing behavior or unique IDs on this site. Not consenting or withdrawing consent, may adversely affect certain features and functions.
Functional
Always active
The technical storage or access is strictly necessary for the legitimate purpose of enabling the use of a specific service explicitly requested by the subscriber or user, or for the sole purpose of carrying out the transmission of a communication over an electronic communications network.
Preferences
The technical storage or access is necessary for the legitimate purpose of storing preferences that are not requested by the subscriber or user.
Statistics
The technical storage or access that is used exclusively for statistical purposes.The technical storage or access that is used exclusively for anonymous statistical purposes. Without a subpoena, voluntary compliance on the part of your Internet Service Provider, or additional records from a third party, information stored or retrieved for this purpose alone cannot usually be used to identify you.
Marketing
The technical storage or access is required to create user profiles to send advertising, or to track the user on a website or across several websites for similar marketing purposes.