
In this webinar, presenters will explore how emerging artificial intelligence technologies are transforming manure and nutrient management practices. The session will highlight how advances in IoT, machine learning, and remote sensing are enabling a shift from simple data collection to predictive, decision-support systems in livestock production. Presentations will illustrate how AI-driven tools can enhance monitoring, efficiency, and environmental outcomes while supporting producers and researchers. Attendees will gain a forward-looking perspective on how integrated data and intelligent systems are shaping the future of nutrient management and agricultural sustainability. This presentation was originally broadcast on June 19, 2026. Continue reading “Smart Manure: AI-Driven Insights for Manure and Nutrient Management”
Clear Communication, Safer Operations: Why Multilingual Manure Management and Farm Safety Training Matters
This webinar discusses how prioritizing Spanish-language and culturally informed training, agricultural operations can improve clarity, strengthen worker confidence, enhance environmental stewardship, and foster a safer, more resilient workforce. This presentation was originally broadcast on January 23, 2026. Continue reading “Clear Communication, Safer Operations: Why Multilingual Manure Management and Farm Safety Training Matters”
North American Manure Trainings

Across the United States and Canada, multiple manure training events and educational programs are scheduled soon to support manure handlers, agricultural professionals, crop producers, and livestock managers. These opportunities offer technical instruction, best practices, and compliance support for nutrient management and regulatory requirements. Below are some upcoming trainings.
Michigan Manure Management Summit
The Michigan Manure Management Summit is an annual educational event hosted by Michigan State University Extension and the Michigan Farm Bureau. This summit delivers current information on manure science, environmental stewardship, and best practices for handling and applying manure. The program is specifically designed for anyone who hauls and applies manure. In addition to technical sessions, the Summit provides required continuing education credits (CECs) for individuals certified at any level through the Michigan Manure Hauler Certification Program.
March Manure Mondays (Ontario)
In Ontario, a March Manure Mondays webinar series is being planned for the five Mondays of March. These sessions will explore practical, science-based approaches to manure management, including nutrient management fundamentals, treatment strategies, greenhouse gas considerations, spreader calibration, and environmental stewardship. The series is accessible online, allowing broad participation from manure handlers, advisors, and producers regardless of location.
Land Application Training – Nebraska 2026
Nebraska Extension is conducting a series of Land Application Training workshops across the state in 2026. These full-day, hands-on sessions focus on practical decision-making for manure use, integrating agronomic value with environmental and regulatory considerations. Participants will learn how to evaluate fields, assess manure nutrient value, consider soil and water quality risks, and understand current regulations. Workshops are scheduled in multiple communities statewide.
Certified Livestock Manager Training – Ohio
The Ohio Department of Agriculture (ODA) will host a Certified Livestock Manager (CLM) Training in Reynoldsburg, Ohio. This training supports individuals seeking CLM certification by providing instruction on regulatory standards, manure and nutrient management practices, and environmental stewardship as they relate to concentrated animal feeding operations and manure handling. CLM certification is required for certain livestock facilities, manure brokers, and applicators operating at specified scales under Ohio administrative rules.
Conservation Tillage and Technology Conference – Ohio
OSU Extension will host the Conservation Tillage and Technology Conference at Ohio Northern University in Ada, Ohio. The program includes a nutrient management portion designed for agricultural professionals seeking insights on soil health, water quality, conservation practices, precision agriculture, and related technologies. Certified Crop Adviser (CCA) and Certified Livestock Manager (CLM) continuing education credits are available for applicable sessions. The nutrient management program is scheduled the day prior to the main conference to accommodate focused training on manure, nutrient stewardship, and related topics.
Iowa Manure Applicator Certification Programs
In Iowa, Manure Applicator Certification (MAC) training is offered through Iowa State University Extension and Outreach in partnership with the Iowa Department of Natural Resources (DNR). These programs provide required training for both commercial and confinement site manure applicators, covering key topics such as safety, regulations, nutrient value assessment, and economics of manure management. Specialized training is available for liquid, dry/solid, and confinement manure systems, and participants can also access online certification options via the Iowa DNR MAC platform. Registration is coordinated through local ISU Extension offices; pre-registration is required for in-person sessions and there is no fee for workshop attendance. Additional options include online training modules and scheduled video re-showings by appointment.
A view from above – application of drones and remote sensing for air and water quality measures around livestock farms
Aerial photos of farms and farming practices are becoming easier to find and collect. But drones and satellites can provide more than pretty pictures. In this webinar, the three speakers will share applications of drones and remote sensing for air and water quality measures around livestock farms. Dirk Charlson will share his simple approach to collecting drone imagery, and the range of opportunities for analyzing images and mapping practices. Nesli Akdeniz has collected air quality measures in pasture systems with drones. Finally, Becca Muenich has used remote sensing to examine land application practices. While it may seem like these applications are flying by faster than we can see, the speakers will help ground us with their experience. This presentation was originally broadcast on December 12, 2025. Continue reading “A view from above – application of drones and remote sensing for air and water quality measures around livestock farms”
Sustainability of the Dairy Industry in the United States
Purpose
The U.S. dairy industry recognizes its environmental impact and has committed to achieving carbon neutrality by 2050, aiming to significantly reduce greenhouse gas (GHG) emissions while maintaining production efficiency. The primary sources of dairy-related emissions include enteric methane from cows, manure management, feed production, and energy use on farms.
Improvements in feed efficiency and manure management have already led to reductions in emissions per unit of milk produced. For instance, Idaho has successfully reduced enteric methane emissions per unit of milk by 25% since 1990, and methane emissions from manure per unit of milk have declined by about 20% (O’Hara, 2022). However, the total emissions from manure have increased by 20% due to herd growth in Idaho. These figures highlight the challenge of balancing productivity with environmental stewardship. Despite these difficulties, advancements in animal nutrition, manure management, and emerging technologies provide a promising path toward sustainability.
What Did We Do?
Over the past several decades, remarkable advancements in dairy farming have significantly improved milk production efficiency. Since the 1940s, the industry has nearly quadrupled milk output per cow through genetic improvements, optimized nutrition, and better overall management. This increase in productivity has allowed farmers to produce more milk with fewer cows, reducing the environmental footprint of each unit of dairy produced. Beyond improvements in feed efficiency, nutritional interventions such as adding feed additives like 3-NOP (3-nitrooxypropanol), seaweed, and oilseeds have been shown to reduce enteric methane emissions by altering rumen microbial activity. Research suggests that 3-NOP, for instance, can reduce methane emissions by up to 30% without negatively affecting milk yield or composition (Hristov, 2021).
Manure management is another critical area of focus. Technologies such as anaerobic digesters, composting systems, and improved storage techniques have been implemented to mitigate methane emissions from manure. Anaerobic digesters convert manure into biogas, which can be used as a renewable energy source, reducing the reliance on fossil fuels and lowering overall carbon emissions. Other strategies, such as mechanical separators and compost-bedded pack barns, have also been explored as effective methods for reducing methane release from stored manure.
What Have We Learned?
Several key strategies have emerged as effective pathways for improving dairy sustainability. The first is continued advancements in genetics, which allow farmers to breed more productive cows that require fewer resources per unit of milk produced. Selective breeding programs targeting low-methane-emitting cows could further contribute to sustainability efforts. Precision feeding techniques, which ensure cows receive the optimal balance of nutrients without overfeeding, are also crucial for reducing emissions. Feed additives such as tanniferous forages, alternative electron sinks like nitrates, and certain types of fats have shown potential in mitigating enteric methane production. However, long-term research is still needed to assess their effectiveness and potential side effects on animal health and productivity.
Another significant finding is the role of manure management systems in influencing overall farm emissions. Studies indicate that farms implementing covered liquid slurry storage and anaerobic digesters experience lower methane emissions compared to traditional open-lagoon systems. Additionally, manure treatment systems that integrate composting or separation techniques have been identified as key factors in reducing GHG emissions. Beyond farm-level practices, the industry has recognized the importance of collaboration across the supply chain. Processors, retailers, and policymakers must work together to promote sustainable practices, invest in research, and provide incentives for farmers to adopt new technologies.
Future Plans
Moving forward, the dairy industry will continue to focus on increasing milk production efficiency as a means of reducing emissions per unit of milk produced. Advances in genetics, feed optimization, and herd management will further contribute to sustainability efforts. Additionally, manure management will play a pivotal role in achieving sustainability goals. Expanding the use of anaerobic digesters and nutrient recycling technologies will help reduce emissions while providing renewable energy and valuable soil amendments.
Investment in research and innovation will be essential for identifying new strategies and improving existing ones. Research into alternative feed additives, precision agriculture, and digital monitoring tools will enable farmers to make data-driven decisions that enhance both productivity and environmental sustainability. Policy support and financial incentives will also be critical in accelerating the adoption of sustainable practices. Government programs and industry initiatives should continue to provide funding for technology adoption, carbon offset programs, and educational resources for farmers. Ultimately, the U.S. dairy industry is well-positioned to make significant strides toward its sustainability goals. By leveraging innovation, research, and collaboration, the industry can continue to provide essential nutrition while reducing its environmental footprint and working toward carbon neutrality by 2050.
Authors
Presenting & corresponding author
Mark A. McGuire, University Distinguished Professor, Department of Animal, Veterinary and Food Sciences, University of Idaho, mmcguire@uidaho.edu
Additional Information
Capper, J. L., Cady, R. A., & Bauman, D. E. (2009). The environmental impact of dairy production: 1944 compared with 2007. Journal of Animal Science, 87(6), 2160–2167. https://doi.org/10.2527/jas.2009-1781
El Mashad, H. M., Barzee, T. J., Franco, R. B., Zhang, R., Kaffka, S., & Mitloehner, F. (2023). Anaerobic digestion and alternative manure management technologies for methane emissions mitigation on Californian dairies. Atmosphere, 14(1), 120. https://doi.org/10.3390/atmos14010120
Godber, O. F., Czymmek, K. J., van Amburgh, M. E., & Ketterings, Q. M. (2024). Farm-gate greenhouse gas emission intensity for medium to large New York dairy farms. Journal of Dairy Science. https://doi.org/10.3168/jds.2024-25874
Hristov, A. N., Melgar, A., Wasson, D., & Arndt, C. (2021). Symposium review: Effective nutritional strategies to mitigate enteric methane in dairy cattle. Journal of Dairy Science, 105(10), 8543–8557. https://doi.org/10.3168/jds.2021-21398
Innovation Center for U.S. Dairy. (2022). U.S. Dairy Sustainability Report 2021-2022. Retrieved from https://www.usdairy.com/about-us/innovation-center
Kreuzer, M. (2024). Feed additives for methane mitigation: Introduction—Special issue on technical guidelines to develop feed additives to reduce enteric methane. Journal of Dairy Science.
Nguyen, B. T., Briggs, K. R., & Nydam, D. V. (2023). Dairy production sustainability through a one-health lens. Journal of the American Veterinary Medical Association, 261(1). https://doi.org/10.2460/javma.22.09.0429
O’Hara, J. K. (2022). State-level trends in the greenhouse gas emission intensity of U.S. milk production. Journal of Dairy Science, 106(10), 5474–5484. https://doi.org/10.3168/jds.2022-22741
Rotz, C. A. (2017). Modeling greenhouse gas emissions from dairy farms. Journal of Dairy Science, 101(7), 6675–6690. https://doi.org/10.3168/jds.2017-13272
U.S. Farmers & Ranchers in Action (USFRA). (2024). Potential for U.S. Agriculture to Be Greenhouse Gas Negative. Retrieved from https://www.usfraonline.org
Acknowledgements
Supported by USDA-NIFA SAS 2020-69012-31871
Biochar as a Manure Additive
Purpose
Biochar is a carbon-rich product derived from pyrolysis and is commonly used as a soil amendment. When applied to soil, biochar has been shown to sequester carbon, enhance aggregate stability, and improve soil nutrient and water retention. Recently, several states have adopted the USDA Natural Resources Conservation Service (NRCS) Code 336, which addresses soil carbon amendments, including biochar, as a conservation practice. This has led to increased awareness of biochar in agricultural systems. While the application of biochar to soil systems has been extensively studied, there are other agricultural sectors where biochar could be incorporated to provide additional benefits. This study explores the potential for incorporating biochar into manure management systems, specifically anaerobic digestion and manure storage.
What Did We Do?
Two different studies were conducted as part of this research. The first study investigated how biochar could be implemented into manure storage systems. Manure storage is a common practice at livestock facilities; however, emissions of ammonia (NH₃), methane (CH₄), and nitrous oxide (N₂O) are released into the atmosphere during storage. Additionally, the increasing use of solid-liquid separation in mid- to large-scale farms has resulted in emissions occurring outside of land application due to the lack of crust formation on manure storage. This study assessed emissions from pilot manure storage units (5-gallon buckets) after applying a 2-inch layer of raw feedstock or biochar as a cover over dairy manure. Different feedstocks, including woodchips, corn stover, and manure solids, were evaluated, and emissions were measured weekly over four months to determine NH₃, CH₄, and N₂O emissions (Figure 1).

The second study examined the incorporation of biochar into dairy manure anaerobic digestion systems. Anaerobic digestion of livestock manure produces biogas, which contains significant concentrations of hydrogen sulfide (H₂S) that must be removed before energy utilization. This study evaluated how dosing biochar—produced from different feedstocks and at varying pyrolysis temperatures—impacted hydrogen sulfide reduction during anaerobic digestion. A bench-scale study was conducted using batch reactors dosed at 0.75% (w/w) (approximately 62 lbs per 1,000 gallons), and biogas was analyzed every 2–3 days for H₂S, CH₄, and CO₂ concentrations.

What Have We Learned?
In the manure storage study, both raw feedstocks and biochar reduced NH₃ emissions. The greatest reductions in NH₃ emissions were observed with woodchip biochar, which achieved an average reduction of 82–97% in cumulative emissions. The manure solids and corn stover biochar resulted in average reductions of 35% and 55%, respectively. However, while NH₃ emissions were reduced, an increase in greenhouse gas emissions—particularly N₂O—was observed in treatments with biochar covers.
In anaerobic digestion systems, the addition of biochar at 0.75% (w/w) reduced H₂S production. The degree of reduction was influenced by the biochar production temperature, with lower-temperature biochars being more effective at reducing H₂S. During the batch anaerobic digestion tests, no significant impact was observed on CH₄ or CO₂ concentrations in the biogas.
Future Plans
For the manure storage study, while the reductions in NH₃ emissions were promising, the observed increase in N2O emissions requires further investigation. The highest N₂O emissions were associated with large-particle woodchip biochar, likely due to the creation of an anoxic environment within the biochar cover. Future studies will examine whether reducing biochar particle size can mitigate these N₂O emissions. Additionally, further research will assess the long-term impacts of these treatments on soil health and crop production following land application.
For the anaerobic digestion study, additional work is needed to determine the specific biochar characteristics responsible for the greater H₂S reductions observed with lower-temperature biochars. Since the study was conducted at a batch scale, further evaluation in a continuous system is necessary. Lastly, full-scale digester trials are needed before widespread adoption of biochar in anaerobic digestion systems.
Authors
Presenting & corresponding author
Joseph R. Sanford, Assistant Professor, University of Wisconsin–Platteville, sanfordj@uwplatt.edu
Additional authors
Ben Raimonde, Undergraduate Research Assistant, University of Wisconsin–Platteville
John Rodwell, Undergraduate Research Assistant, University of Wisconsin–Platteville
Jeffery Smolinski, Undergraduate Research Assistant, University of Wisconsin–Platteville
Acknowledgements
This material is supported by the Wisconsin Dairy Innovation Hub and the National Institute of Food and Agriculture, U.S. Department of Agriculture, under award number 2022-70001-37309. Any opinions, findings, conclusions, or recommendations expressed in this publication are those of the authors and do not necessarily reflect the views of the U.S. Department of Agriculture or the Wisconsin Dairy Innovation Hub.
The authors are solely responsible for the content of these proceedings. The technical information does not necessarily reflect the official position of the sponsoring agencies or institutions represented by planning committee members, and inclusion and distribution herein does not constitute an endorsement of views expressed by the same. Printed materials included herein are not refereed publications. Citations should appear as follows. EXAMPLE: Authors. 2025. Title of presentation. Waste to Worth. Boise, ID. April 7-11, 2025. URL of this page. Accessed on: today’s date.
Optimizing Manure Application Timing for Methane Reduction and Economic Gains through Carbon Credits
Purpose
Methane emissions from manure storages significantly contribute to the livestock industry’s carbon footprint. While various manure management strategies are used to reduce greenhouse gas (GHG) emissions on farms, such as anaerobic digestion and composting, many of these strategies are cost-prohibitive for small-to-medium-sized farms. Strategic manure application timing to limit GHG emissions is a practical, scalable option to reduce methane production in manure storages.
Carbon credits are financial incentives for farmers who adopt practices that reduce greenhouse gas emissions, such as cover crops or methane emissions abatement. These credits can then be sold to companies seeking to offset their emissions. This study evaluates the impact of manure application timing on methane emissions from storages and explores how carbon credits could act as an incentive for farms to employ climate-smart manure management practices. By comparing different manure application strategies (fall, spring, in-season sidedress, and split applications), we assess the methane reductions and improved economics of optimized timing.
What Did We Do?
Methane emissions were estimated using data from a lab-based study conducted by Andersen et al. (2015), who measured methane emissions from deep-pit swine manure at various temperatures. From this data, we created a model incorporating manure production rates and ambient temperature dynamics to predict daily methane emissions from a 4800-head slurry storage and 4800-head deep-pit swine production facility.
Seven application scenarios were compared: fall (November 1), spring (April 15), sidedress (June 1), fall-spring, fall-sidedress, spring-sidedress, and fall-spring-sidedress split applications. Total methane emissions were calculated for each scenario, allowing us to determine the GHG emissions abated by shifting from a fall application to an alternate strategy. An economic assessment was conducted using a $30/metric ton carbon dioxide equivalent (MT CO2e) carbon credit valuation to determine the financial implications of these methane mitigation strategies.
What Have We Learned?
For our swine slurry store model, methane emissions were highest in the single fall application scenario due to the full storage attained during peak summer temperatures, with annual emissions totaling nearly 0.5 MT CO2e/pig-space (Figure 1). Shifting application to spring or sidedress reduced emissions by approximately 50%. Split applications showed a further reduction in emissions by maintaining lower storage volumes throughout the year.

From an economic perspective, carbon credits significantly enhanced the financial viability of the new application strategies. Carbon credits from abated emissions are projected to bring a maximum of $10/pig-space, or about $74/acre, to the farm annually in the F-S-SD scenario (Table 1). The improved manure application timing can also benefit crop yield, making a spring or sidedress manure application even more economically favorable.
Table 1: Projected carbon credit income for a 4800-head wean to finish swine farm with a slurry storage for fall, spring, sidedress, fall-spring split (F-S), fall-sidedress split (F-SD), spring-sidedress split (S-SD), and fall-spring-sidedress split (F-S-SD) applications.
| Fall | Spring | Sidedress | F-S | F-SD | S-SD | F-S-SD | |
| Carbon Credit Income
($/acre) |
$ – | $ 33.63 | $ 33.71 | $ 41.95 | $ 45.82 | $ 45.69 | $ 52.06 |
| Carbon Credit Income
($/pig-space) |
$ – | $ 6.50 | $ 6.51 | $ 8.10 | $ 8.85 | $ 8.83 | $ 10.06 |
Future Plans
Further research should be conducted to refine the temperature aspect of the model. In the slurry store model, we assume that the manure temperature equals the 10-day average temperature. A study to verify the true manure temperature throughout the year would improve the confidence level of the current model. For deep pit barns, we use measured temperature data from 58 barns over 13 months, but manure temperatures were collected from the manure pump out access port and may not represent average manure temperatures in the barn. Future models to assess differences between deep pit and slurry store emissions will highlight the optimal manure management strategies for limiting GHG emissions.
Using specialized high-clearance irrigation equipment, like the 360 RAIN from 360 Yield Center, could enhance the feasibility of more frequent manure applications, reducing methane emissions while maintaining crop nitrogen availability. Additionally, developing standardized carbon credit protocols for manure management could create opportunities for more producers to monetize methane reduction efforts, further incentivizing climate-smart manure application strategies.
Authors
Presenting author
Jacob R. Willsea, Graduate Research Assistant, Iowa State University Department of Agricultural and Biosystems Engineering
Corresponding author
Daniel S. Andersen, Associate Professor, Iowa State University Department of Agricultural and Biosystems Engineering, dsa@isatate.edu
Additional Information
Andersen, D.S., Van Weelden, M.B., Trabue, S.L., & Pepple, L. M. (2015). Lab-assay for estimating methane emissions from deep-pit swine manure storages. Journal of Environmental Management, 159, 18-26. https://doi.org/10.1016/j.jenvman.2015.05.003
Talkin’ Crap Podcast Episode:
Andersen Lab Poster Repository:
https://iastate.box.com/s/3kkzdzcjlk9qcfrgbv6mj9x7vdk1v0fp
Acknowledgements
USDA-NRCS
Brent Renner
360 Yield Center
The authors are solely responsible for the content of these proceedings. The technical information does not necessarily reflect the official position of the sponsoring agencies or institutions represented by planning committee members, and inclusion and distribution herein does not constitute an endorsement of views expressed by the same. Printed materials included herein are not refereed publications. Citations should appear as follows. EXAMPLE: Authors. 2025. Title of presentation. Waste to Worth. Boise, ID. April 7-11, 2025. URL of this page. Accessed on: today’s date.
Optimizing Manure Nitrogen Application Timing in Corn Production for Sustainability and Profitability
Purpose
Nitrogen (N) application timing is crucial in balancing crop productivity and environmental sustainability. While fall applications are typical among Iowa corn producers due to favorable field conditions, they pose a high risk of N loss through denitrification, volatilization, and leaching. Spring and in-season sidedress applications offer improved nitrogen use efficiency (NUE) by aligning N availability with crop demand.
This study evaluates the effects of different N application timings—fall, spring, and sidedress—on corn yield and NUE. Using data from 65 site-years, we assess how application timing influences yield, economic returns, and environmental impacts. The findings provide insights into best management practices for improving profitability and sustainability in corn production.
What Did We Do?
A review of studies comparing N application timing in corn production was conducted, including a long-term experiment from the University of Minnesota (1960-1996) and additional datasets totaling 65 site-years. Treatments were separated into three categories: fall, spring, and sidedress. Relative yield was used to normalize data across years, and yield response was modeled using a Mitscherlich-Baule equation (Figure 1).
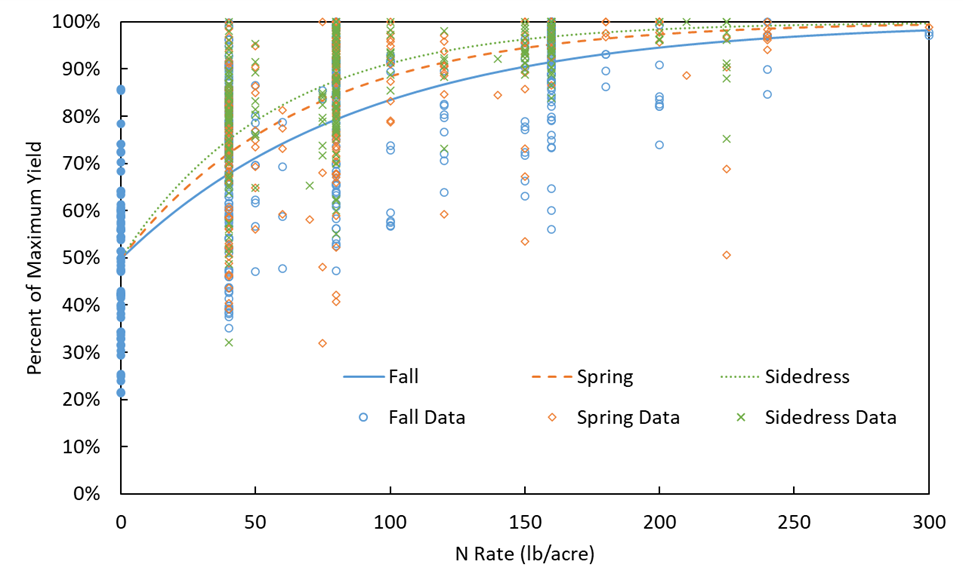
Economic impacts were analyzed using maximum return to nitrogen (MRTN), which identifies the N rate that maximizes economic return (Figure 2). Corn prices ($4.62/bu) and anhydrous ammonia prices ($0.45/lb N) were used to estimate profitability in each application scenario. The environmental effects were assessed by examining N-loss pathways and the potential for emission reduction of nitrous oxide (N2O), a greenhouse gas estimated to be 273 times more potent than carbon dioxide.

What Have We Learned?
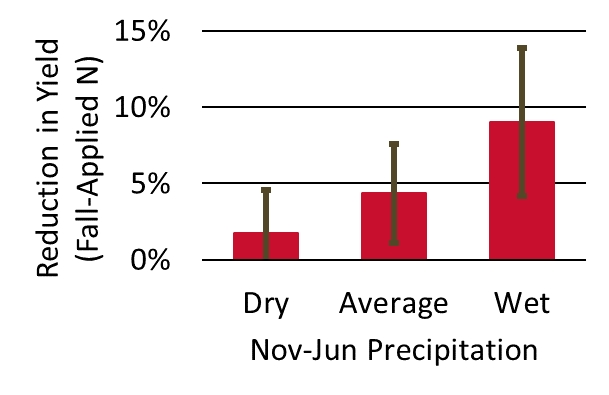
Results show that year-to-year, sidedress applications consistently produce the highest corn yield, followed by spring applications, with fall applications being the least effective. Yield differences are particularly evident in wet years (November to June rainfall > 1 inch above average), where sidedress applications outperform fall by an average of 9% (Figure 3). MRTN analysis shows that sidedress applications require 25% less N than fall applications while achieving higher yields, demonstrating their economic advantage.
The environmental analysis indicates that reducing N application rates through improved timing could cut N2O emissions by up to 25%. With a carbon credit of $30/metric ton CO2e abated the reduction in N2O equates to a $2.66/acre credit for a reduced N application rate. Fall-applied N is most susceptible to losses due to prolonged exposure to wet conditions, while spring and sidedress applications minimize the risk of loss by reducing time in the field and matching crop demand.
Future Plans
Further research is needed to refine N application strategies by incorporating real-time weather data and precision agriculture tools. The development of high-clearance application equipment, such as 360 RAIN from 360 Yield Center, offers opportunities for more flexible and targeted in-season applications, potentially enhancing NUE and reducing losses.
Additional studies should assess the risk of spring or sidedress applications from year to year. Weather conditions often limit pre-plant N application, so a thorough analysis of the frequency and financial impact of interrupted field management operations should be conducted.
Future studies should also explore the economic feasibility of split applications, which combine the benefits of multiple timings to reduce risk. Additionally, expanding MRTN models to include seasonal effects would improve decision-making for producers seeking to optimize N application timing while minimizing environmental impact.
Authors
Presenting author
Jacob R. Willsea, Graduate Research Assistant, Iowa State University Department of Agricultural and Biosystems Engineering
Corresponding author
Daniel S. Andersen, Associate Professor, Iowa State University Department of Agricultural and Biosystems Engineering, dsa@iastate.edu
Additional Information
Talkin’ Crap Podcast Episode:
Andersen Lab Poster Repository:
https://iastate.box.com/s/4s9gjhkd93d95yvqip8q5rr46frshtln
https://iastate.box.com/s/icg6clbamksfzciw8ze3lc301p8homg1
Acknowledgements
USDA-NRCS
Brent Renner
360 Yield Center
The authors are solely responsible for the content of these proceedings. The technical information does not necessarily reflect the official position of the sponsoring agencies or institutions represented by planning committee members, and inclusion and distribution herein does not constitute an endorsement of views expressed by the same. Printed materials included herein are not refereed publications. Citations should appear as follows. EXAMPLE: Authors. 2025. Title of presentation. Waste to Worth. Boise, ID. April 7-11, 2025. URL of this page. Accessed on: today’s date.
Livestock Emissions in the United States: Challenges, Efforts, and Opportunities
Due to a technical glitch, we did not get this presentation recorded. Please accept our apologies.
Purpose
This study aimed to review current literature on livestock emissions in the United States, focusing on sources, challenges, and mitigation strategies. Specifically, it examines emissions from enteric fermentation, animal housing, manure management systems, and manure utilization. By synthesizing existing research, the study provides an understanding of how these emission sources contribute to air quality concerns, including greenhouse gas accumulation, odor issues, and public health risks. Additionally, it highlights the regulatory landscape and ongoing efforts to monitor and reduce emissions through technological and management innovations.
This study also explores opportunities for improving air quality while maintaining sustainable livestock production. It evaluates the effectiveness of various mitigation strategies, such as precision feeding, anaerobic digestion, and advanced manure treatment systems, in reducing emissions. Furthermore, it discusses potential advancements, including circular economy approaches and enhanced air quality modeling, to optimize emission reductions. By providing this analysis of current research and policy efforts, this study aims to support informed decision-making among producers, researchers, and policymakers in advancing sustainable livestock systems.
What Did We Do?
This literature review analyzed peer-reviewed research, government reports, and industry publications on livestock emissions. The review focused on emissions from enteric fermentation, animal housing, manure management systems, and manure utilization, identifying key sources and their environmental impacts. Studies were selected based on their relevance to air quality, greenhouse gas emissions, and mitigation strategies, ensuring a broad yet detailed assessment of current knowledge. Additionally, regulatory frameworks and policies from agencies such as the United States Department of Agriculture and U.S. Environmental Protection Agency were examined to contextualize efforts aimed at reducing emissions in livestock production systems.
To evaluate mitigation strategies, the study categorized technologies and management practices based on their effectiveness, feasibility, and adoption rates. Approaches such as anaerobic digesters, biofilters, precision feeding, and manure treatment systems were reviewed for their potential to reduce emissions while maintaining economic viability. Case studies and data from ongoing research projects were incorporated to highlight real-world applications and emerging innovations. The synthesis of findings aimed to identify knowledge gaps, assess the impact of existing policies, and propose future research directions to enhance emission reduction efforts in livestock production.
What Have We Learned?
Livestock emissions primarily arise from enteric fermentation (methane from digestion) and manure management. These sources contribute significantly to agricultural methane emissions, a potent greenhouse gas impacting climate change. Recent research has enhanced our understanding of strategies to mitigate methane emissions from livestock, particularly through dietary interventions. Feed additives like 3-nitrooxypropanol (3-NOP) and red seaweed (Asparagopsis taxiformis) have shown significant potential in reducing methane production during digestion. Studies indicate that 3-NOP can decrease methane emissions by approximately 30% in dairy cows, while red seaweed has been shown to reduce emissions by up to 80% in beef cattle. These additives work by inhibiting specific enzymes involved in methane synthesis within the rumen, thereby lowering the overall greenhouse gas output from ruminant livestock.
In addition to dietary strategies, advancements in manure management have been explored to further reduce environmental impacts i.e., solid-liquid separation, anaerobic digestion, acidification, vermifiltration. Anaerobic digestion (AD) systems convert livestock manure into biogas, which can be used as a renewable energy source. This process not only mitigates methane emissions but also offers economic benefits by reducing fossil fuel expenses and generating income from excess energy production. However, the economic viability of AD systems can be influenced by factors such as operational costs and the scale of implementation. Therefore, while AD presents a promising approach to sustainable manure management, careful consideration of these factors is essential for its successful adoption in livestock operations.
Future Plans
Future studies on mitigating dairy emissions should focus on integrated approaches across enteric fermentation, manure management, and land application. Research into dietary interventions, such as precision feeding strategies and methane-reducing feed additives like seaweed, tannins, and essential oils, could help lower enteric methane emissions while maintaining animal productivity. Advances in microbiome research could further refine these approaches by identifying specific gut microbial populations that reduce methane production. Additionally, long-term studies on genetic selection for low-methane-emitting cattle could offer a sustainable mitigation strategy without compromising milk yield.
For manure systems and applications, future research should prioritize optimizing anaerobic digestion efficiency to maximize methane capture and energy recovery while reducing residual emissions. Innovative manure amendments, such as biochar or nitrification inhibitors, could limit methane and nitrous oxide release during storage and land application. Studies on precision manure application techniques, including low-disturbance injection and variable-rate spreading, could enhance nutrient use efficiency while minimizing emissions. Furthermore, landscape-scale modeling should be developed to assess the cumulative effects of these strategies and guide policy recommendations for sustainable dairy farming.
Authors
Presenting & corresponding author
Gilbert Miito, Assistant Professor & Extension Specialist — Air Quality, University of Idaho, gmiito@uidaho.edu
The authors are solely responsible for the content of these proceedings. The technical information does not necessarily reflect the official position of the sponsoring agencies or institutions represented by planning committee members, and inclusion and distribution herein does not constitute an endorsement of views expressed by the same. Printed materials included herein are not refereed publications. Citations should appear as follows. EXAMPLE: Authors. 2025. Title of presentation. Waste to Worth. Boise, ID. April 7-11, 2025. URL of this page. Accessed on: today’s date.
From Lecture to Hands-On Learning: Engaging Iowa’s Manure Applicators Through Active Certification Programs
Purpose
The Iowa Manure Applicator Certification program has transitioned from a traditional lecture-based format to a multimodal learning approach that integrates lectures, discussion, and hands-on activities. This shift was implemented to create more engaging and memorable training experiences, fostering discussion and peer-to-peer knowledge sharing while improving knowledge retention and practical skill application.
Hands-on learning has been widely recognized as an effective educational strategy. Research indicates that individuals retain more information through active engagement rather than passive listening. However, developing these engaged learning opportunities requires additional time and commitment from educators and a willingness from participants to fully engage in the learning process. Our goal was to transform the training environment from passive listening to an interactive space where participants could explore activities, facilitate discussions, and share personal experiences within groups.
What Did We Do?
To achieve this transformation, we restructured the program to incorporate interactive activities designed to bring real-world challenges into the classroom. Instead of serving solely as lecturers, facilitators became discussion leaders, encouraging participants to actively engage with the material. Starting in approximately 2014, we started adding one module to training based on fostering discussion and participant interaction. As the training occurs annually, with livestock farmers or commercial manure applicators required to attend annually, different modules were created each year with at least a three-year break before an existing module is used again.
Some of the hands-on activities integrated into the program include:
-
- Carousel Exercise – Applicators rotate through stations, responding to questions on environmental impacts and operational challenges, sparking peer-to-peer discussions.
- Spill Response Scenario – Groups rank and discuss response steps to manure spills, often incorporating real-world examples shared by applicators and insights from Iowa DNR regulators.
- Load Loss Competition – Model trucks are used to visually demonstrate best practices for material containment.
- Stockpiling Locations – Hands-on exercises with topographic, soil, and aerial imagery to develop regulatory knowledge and practical application skills.
- Application Rate Calibration – Three simulated manures (bed pack [wetted straw], open lot [wetted sand], and turkey litter [wetted wood shavings]) were supplied to each group and a plastic tarp. Each group was asked to apply a prescribed manure application and then to estimate the application rate of other groups. The actual application rate was calculated based on the weight added to the tarp and compared to group estimates.
- DOT Compliance Activity – Participants perform checklist inspections on model trucks to identify vehicle issues and understand road rules.
- Video-Based Farm Walkthrough – Applicators observe an Iowa DNR site inspection via video before using Google Maps and a farm description to evaluate livestock production sites for compliance readiness.
- Biosecurity Bench – Glow germ was placed on at a simulated barn entry and producers went through a Danish style entry. At the end we evaluated how much glow germ made it to the clean side of the entry.
- Manure Transport Route Selection – Participants were divided into groups and given a map and worksheet. The map identified the location of the farm with manure and the field to which manure was to be applied. Groups were required to select a route from farm to field with the worksheet providing talking points such as travel time, neighbors, and bridge considerations.

Each of these activities was designed to promote critical thinking in manure management and spill prevention while allowing facilitators to assess current knowledge levels among participants.
What Have We Learned?
While some participants and facilitators initially approached this transition with skepticism, feedback has been positive. Evaluations suggest that these engaged learning techniques have resulted in increased participant investment, improved knowledge retention, and greater willingness to discuss challenges and ask questions.
Facilitators also report stronger engagement with applicators, who now feel more comfortable sharing experiences, discussing obstacles, and applying learned concepts in real-world situations. Additionally, peer-to-peer learning has emerged as a significant benefit, with applicators contributing valuable insights that complement the formal curriculum.
Data obtained from the Iowa Department of Natural Resources Hazardous Material Release Database (https://programs.iowadnr.gov/hazardousspills/Reports/EPCManureRelease.aspx) was used to track total incidents of manure releases and surface water impacts from these releases. Within this report, incidents are broken down by species (Hog, cattle, or poultry, by facility type (open lot, confinement), and if they occurred from the facility, because of land application, or during manure transport. A summary of total events is provided in Figure 2. A before and after analysis using 2012 as the break point indicated a statistically lower number of spills (29.9 ± 9.6 compared to 49.9 ± 6.4 spills) after 2014 (p<0.001). However, the number of water quality impacts from spills remained unchanged (10.9 ± 4.6 compared to 10.0 ± 4.8). A breakpoint regression analysis was used to evaluate if the occurrence of spills has changed with time (Figure 2). The breakpoint year was set at 2013 (the year before our first active learning activity was implemented) and results indicated that before 2013 the occurrence of spills was constant with time, while after 2013 we have been decreasing by 3.1 spills per year. Similarly, for water quality impacts the breakpoint year was set at 2013 with results indicating that before 2013 impacts on water (spills reaching a surface water) were constant with time, while after 2013 impacts have been decreasing by 0.3 incidences per year. While other changes certainty played a role in the reduction of manure spills and water impacts (increased adoption of flow meters and automated flow shutoff systems, a change from tanks to umbilical application to reduce road traffic, and regulatory interventions) our program reviews and spill impact assessment suggest the Iowa Manure Applicator training played a role in helping improve industry performance.

Future Plans
We plan to continue refining the program by incorporating additional interactive elements and expanding hands-on learning opportunities. Future initiatives may include:
-
- Enhancing real-world application exercises by integrating on-farm training opportunities.
- Collecting and analyzing long-term data to assess the impact of training on manure management practices and environmental outcomes.
- Exploring digital and remote learning tools to reach a broader audience while maintaining interactive engagement.
Authors
Presenting & corresponding author
Daniel Andersen, Associate Professor, Iowa State University, Dsa@iastate.edu
Additional authors
Rachel Kennedy, Iowa State University
Melissa McEnany, Iowa State University
Tony Mensing, Iowa State University
Kapil Aurora, Iowa State University
Kris Kohl, Iowa State University
Additional Information
@drmanure
https://www.facebook.com/IowaManure/
https://www.extension.iastate.edu/immag/commercial-manure-applicators
Acknowledgements
Iowa DNR
The authors are solely responsible for the content of these proceedings. The technical information does not necessarily reflect the official position of the sponsoring agencies or institutions represented by planning committee members, and inclusion and distribution herein does not constitute an endorsement of views expressed by the same. Printed materials included herein are not refereed publications. Citations should appear as follows. EXAMPLE: Authors. 2025. Title of presentation. Waste to Worth. Boise, ID. April 7-11, 2025. URL of this page. Accessed on: today’s date.