Purpose
The Iowa commercial manure application industry plays a crucial role in advancing nutrient utilization, circularity, and water quality within agricultural systems. Effective programming requires an understanding of the industry’s needs, challenges, and perspectives to tailor information and drive behavior change.
To assess the current state of the industry, we surveyed Iowa’s commercial manure applicators to gather insights into business sizes, application capacity, client demand for manure as a cost-effective fertilizer alternative, and pricing structures. The survey served as a needs assessment, helping to align business goals with state water quality objectives. Specifically, we aimed to understand how the industry navigates market demands, regulatory pressures related to environmental stewardship (particularly water and air quality), labor, and time constraints.
What Did We Do?
A comprehensive electronic survey was sent to all 540 of the 562 commercial manure application businesses in Iowa (22 did not have an email on file). We received a response rate of 20%, providing valuable insights into the industry’s scale and operations. Key findings include:
-
- Commercial applicators handle 62% of Iowa’s 13 billion gallons of liquid manure annually and nearly 60% of its 6 million tons of solid manure.
- Manure transport costs and application expenses shape decision-making, influencing equipment selection and service pricing.
- Current industry capacity and weather-dependent application constraints affect the feasibility of meeting best management practices, such as applying manure only when the soil is 50°F and cooling to minimize nutrient loss.
By examining these trends, we aimed to identify programming opportunities that could support both industry advancements and water quality improvement goals.
What Have We Learned?
The survey results provided critical context for understanding commercial applicator decisions, including:
-
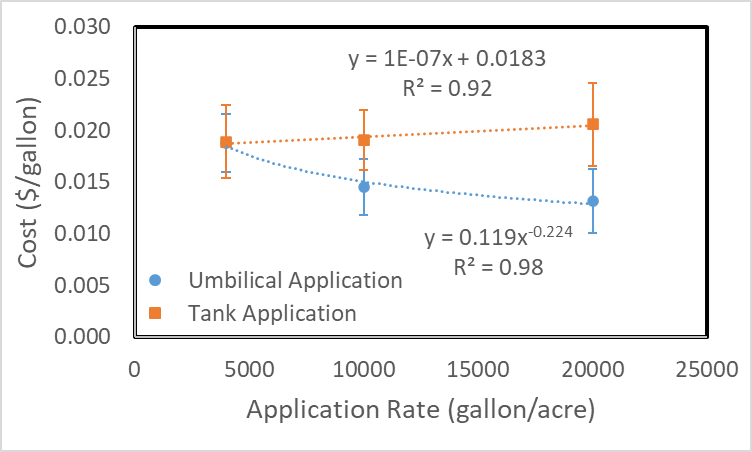
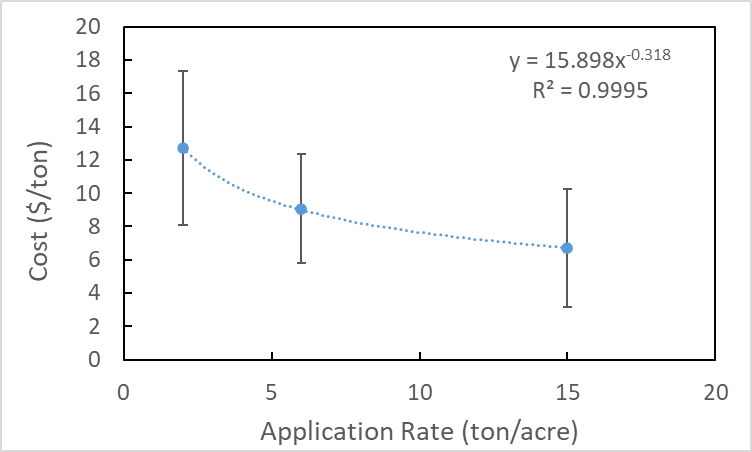
- Economic Realities – The manure application industry must remain financially viable while balancing regulatory requirements and customer needs. One of the most common questions asked by manure applicators is what people are charging for manure application. To help address this question we asked applicators what they would charge for application for three liquid manure application rates (4000 gallons/acre, 12,000 gallons/acre and 20,000 gallons/acre) meant to represent finishing swine manure, gestation-farrowing manure, and dairy manure respectively (Figure 1). For solid manure applicators we asked what they charge per ton for application rates of 2, 6, and 15 tons/acre, meant to represent layer manure, turkey litter, and bed pack cattle manure rates (Figure 2). Additionally, we asked what hauling charge was used for transporting either liquid or solid manure. The average charge for liquid manure was $0.0411 per gallon-mile, while for solid manure, the average charge was $0.40 per ton-mile. Agitation of liquid manures was generally included in the manure application price; however, if special agitation services were required (an additional agitation tractor beyond standard practice or the use of an agitation boat) an additional charge of $0.002 per gallon or around $150-300 per hour was reported.
-
- Manure Transport & Industry Size – Understanding how manure moves within the state and the cost of application informs strategic equipment investments. Solid manure transport distances were reported to average 14.5 miles while liquid manure transport was reported at 2.0 ± 1 mile.
Survey responses suggested 2050 people employed in the commercial manure application business, with 920 of these as non-seasonal employees and 1130 as seasonal employees. Overall totals align well with the number of certified commercial manure applicators in Iowa.
- Regulatory & Timing Constraints – The number of available application days under various weather conditions and the desired soil temperatures at the time of application limits application days available. It also sets a constraint on the application capacity needed to complete manure application. We surveyed how much manure could be applied daily by each company to evaluate application days needed and to evaluate how much increase in application capacity is required. Expansion could occur through either equipment sizing and employee numbers, needed to meet state water quality goals while maintaining viable businesses. On average, businesses can apply 0.6 million gallons of liquid manure per day, with a standard deviation ranging from 0.25 to 1.6 million gallons. Assuming an application rate of around 4000-gallons and acre this means manure could cover 150-acres per day per company. It would take 50 working days to apply all liquid manure in Iowa. On average, businesses apply 526 tons of solid manure per day, requiring 57 working days to apply all the solid manure in Iowa.
- Industry’s Role in Water Quality – Commercial applicators must be strategic partners in achieving water quality objectives by optimizing manure use through best application rates and timing, and incorporation of technology.
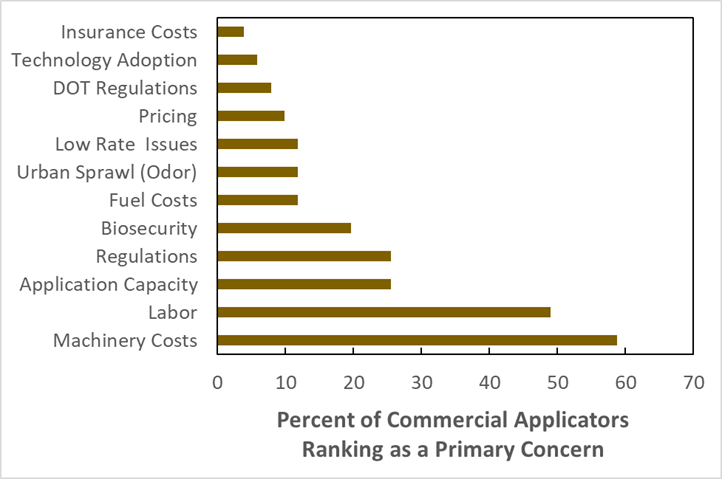
An open-ended question was asked around what challenges were for your application business over the next ten years (Figure 3). As answers were not limited, most businesses chose to list numerous concerns. These were grouped as best possible to provide categories and to help understand where future programming could address these concerns.
The primary concerns listed by most businesses were equipment costs and labor availability. Many noted how as equipment costs have increased it takes more hours of application to justify ownership and find a way to make their business cash flow, and how this has translated into repair costs that add to concerns about maintaining a business. There was an expression of how this could make it difficult for a younger generation to get into the business and make sure the industry stays sustainable. Developing materials to help facilitate those interested in developing a business plan and gallons it takes under different conditions would be a useful tool for facilitating making a business case to a lender.
- Manure Transport & Industry Size – Understanding how manure moves within the state and the cost of application informs strategic equipment investments. Solid manure transport distances were reported to average 14.5 miles while liquid manure transport was reported at 2.0 ± 1 mile.
This study underscores the importance of tailoring educational programs to meet industry needs while collaborating with policymakers to develop strategies that advance manure management practices.
Future Plans
To further support the industry and align with water quality objectives, future efforts will focus on:
-
- Developing strategic policies that support efficient manure application while maintaining business viability.
- Expanding educational programming to help applicators navigate regulatory changes and improve application timing strategies.
- Assessing infrastructure needs to determine equipment investment and business growth opportunities.
- Enhancing industry collaboration with policymakers to balance business sustainability with environmental stewardship.
Authors
Presenting & corresponding author
Daniel Andersen, Associate Professor, Iowa State University, dsa@iastate.edu
Additional authors
Melissa McEnany, Iowa State University
Rachel Kennedy, Iowa State University
Additional Information
https://www.extension.iastate.edu/immag/commercial-manure-applicators
The authors are solely responsible for the content of these proceedings. The technical information does not necessarily reflect the official position of the sponsoring agencies or institutions represented by planning committee members, and inclusion and distribution herein does not constitute an endorsement of views expressed by the same. Printed materials included herein are not refereed publications. Citations should appear as follows. EXAMPLE: Authors. 2025. Title of presentation. Waste to Worth. Boise, ID. April 7–11, 2025. URL of this page. Accessed on: today’s date.