
This webinar will explore how the 360Rain autonomous irrigation system is being used as a new tool for manure management. By enabling in-season manure application, 360Rain opens opportunities to better match nitrogen availability with crop uptake, reduce manure storage time (and associated methane emissions), and even provide supplemental irrigation. This presentation was originally broadcast on September 26, 2025. Continue reading “Rethinking Manure Management with 360Rain: Expanding Application Windows and Improving Nutrient Use Efficiency”
Manure Nutrient Sensing Technologies
Due to a technical glitch, we did not get this presentation recorded. Please accept our apologies.
Purpose
Manure is a critical resource in livestock production as it contains many essential nutrients required for crop growth. However, as a nutrient source, manure is highly variable, and nutrient composition may fluctuate significantly during emptying of manure storages if not properly agitated. Accounting for this variability requires extensive sampling, which is often cost and time prohibitive for haulers and producers.
The aim of this study is to evaluate a commercially available manure nutrient sensor utilizing near-infrared spectroscopy (NIRS) to provide real-time manure nutrient data. The study investigates the impact of NIRS systems in the field to achieve target nutrient application rates and assess effects on crop nutrient use efficiency (NUE) and yield compared to conventional sampling and fixed-rate application methods.
What Did We Do?
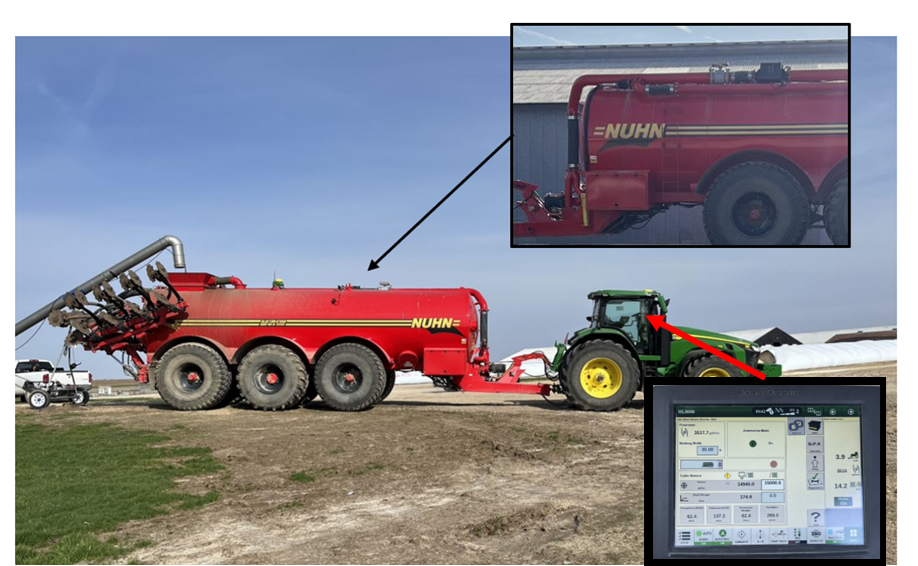
A manure tanker was outfitted with a John Deere HarvestLab 3000 setup for manure nutrient sensing. The setup included the sensor, a Krone flow meter, and a John Deere rate controller (Figure 1). Manure nutrient values from the sensor were recorded in real time. The controller then set specific target rates for a nutrient and the automation system adjusted the tractor speed or manure pump rate to meet the target.
Field trials were conducted in Wisconsin on silt loam soil. Manure was applied to strip plots to meet three specific nitrogen application rates using both the NIRS sensor and conventional sampling and application methods. During application, composite manure samples were collected to assess the sensor’s accuracy. After manure application, the field was planted with corn silage, and following harvest, NUE and yield were evaluated.
What Have We Learned?
In the first year of the study, the NIRS sensor outperformed conventional sampling methods in achieving target nitrogen rates. Across the application plots, the NIRS sensor delivered manure at a nitrogen rate in the range of 20 to 30 lbs N/ac over the target rate, whereas conventional sampling led to overapplication by 40 lbs N/ac to 95 lbs N/ac. During application, the system also tracked other nutrients, such as phosphorus and ammonium, but laboratory analysis indicated that the sensor was less accurate for these nutrients compared to nitrogen. While manure application rates varied, there was little difference in crop yield or NUE between treatments at harvest.
The NIRS sensor shows promise as a tool to revolutionize manure nutrient accounting in cropland. Its ability to track manure variation in real time could significantly improve nutrient management. Figure 2 demonstrates how the system tracked manure nitrogen, phosphorus, and potassium levels over time following a reduction in agitation. This type of tracking may help reduce the need for excessive agitation and enhance manure utilization efficiency.

Future Plans
Researchers plan to continue field trials over multiple years to assess long-term impacts on nutrient use efficiency and soil nutrient management. Additionally, with new calibration updates since the original trial, future studies will evaluate the sensor’s accuracy in measuring phosphorus and its ability to meet phosphorus-based manure application targets while simultaneously tracking nitrogen for improved supplemental nitrogen prescriptions. Overall, the goal of the project is to provide producers and haulers with information on how effective the system is and ways in which it can be used to enhance on-farm efficiency.
Authors
Presenting & corresponding author
Joseph R. Sanford, Assistant Professor, University of Wisconsin -Platteville, sanfordj@uwplatt.edu
Additional authors
Rebecca A. Larson, Professor, Nelson Institute for Environmental Studies, University of Wisconsin-Madison; Tyler Liskow, Engineer, Nelson Institute for Environmental Studies, University of Wisconsin-Madison
Acknowledgements
This material is supported by the Wisconsin Dairy Innovation Hub and the National Institute of Food and Agriculture, U.S. Department of Agriculture, under award number 2022-69008-36506. Any opinions, findings, conclusions, or recommendations expressed in this publication are those of the author(s) and do not necessarily reflect the view of the U.S. Department of Agriculture or the Wisconsin Dairy Innovation Hub.
The authors are solely responsible for the content of these proceedings. The technical information does not necessarily reflect the official position of the sponsoring agencies or institutions represented by planning committee members, and inclusion and distribution herein does not constitute an endorsement of views expressed by the same. Printed materials included herein are not refereed publications. Citations should appear as follows. EXAMPLE: Authors. 2025. Title of presentation. Waste to Worth. Boise, ID. April 7-11, 2025. URL of this page. Accessed on: today’s date.
Models & Tools to Improve Manure Management: Part II
This webinar features the Oregon NMPT, an internet-based record keeping and planning tool, and the Ruminant Farm Systems (RuFaS) project, which aims to build an integrated, whole-farm model that simulates milk, meat, and crop production, and critical metrics of sustainability from ruminant farms. This presentation was originally broadcast on October 20, 2023. Continue reading “Models & Tools to Improve Manure Management: Part II”
Models & Tools to Improve Manure Management
This webinar highlights one tool that provides resources to support livestock production and expansion, as well as two others that focus on manure application planning and making the best use of manure available. This presentation was originally broadcast on May 19, 2023. Continue reading “Models & Tools to Improve Manure Management”
Updating manure N and P credits: A growth chamber study
For a long time, farmers have realized the benefits of using manure as a nutrient source. The ratio of various nutrients in manure, however, rarely matches the exact plant needs. Consequently, farmers must choose between overapplying some nutrients, or underapplying others and meeting the remaining needs with commercial fertilizers. Figuring out nitrogen (N) credits can be a difficult task since the total amount of N found in manure is not fully available the year of application, nor even after the second year of application. In addition, understanding P availability in manure is necessary because excess P can ultimately lead to eutrophication of surface waters. The amount of N that is available will depend on several factors such as animal species, bedding (if any), manure storage, and application method. We assume approximately 80% of the total manure P is available the first year, but even this can vary depending on soil texture, manure chemistry, and weather conditions. Current University of Minnesota recommendations help determine N and P credits for a variety of manures (Hernandez and Schmitt 2012). These recommendations were developed several decades ago and need an update since the diets of animals, storage of manures, and manure application equipment have changed over the years. Therefore, the primary purpose of this study is to estimate N and P mineralization from a variety of manures and soil types across different temperature regime. Our goal is to verify and/or update N and P credit recommendations from manure so that farmers are able to make better decisions when purchasing and applying commercial fertilizers in following years.
What did we do?
Laboratory incubations were used to assess N and P release characteristics from a variety of manures in several different soil types. The incubation studies were a complete factorial with 4 replications and with manure type, soil type, and temperature as the main factors. We also included a control treatment that did not include any manure application to see how much nitrogen and phosphorus mineralized from the soils themselves. We tested 8 manures, including: dairy liquid (separated and raw [non-separated]), swine liquid (from a finishing house and a sow barn), beef manure (solid bedded pack and liquid from a deep pit), and poultry (turkey litter and chicken layer manure). Manure analyses to determine nutrient content were conducted on all samples prior to incubations. Soils for the incubations included a coarse textured soil from the Sand Plain Research Center at Becker, MN; a medium textured soil from a research field near Rochester, MN; and a fine textured soil from the West Central Research and Outreach Center in Morris, MN. Soils were collected from the top six inches of soil at each location in bulk and then air dried, ground down to pass a 2-mm sieve, and analyzed for nutrient and organic matter content.
One liter clear glass canning jars were filled with 200 g of sieved soil and were kept at 60% of field capacity which was maintained by weighing every 4-6 days and adding deionized water as needed to replace the weight lost. We used the University of Minnesota guidelines and manure analysis results to calculate the appropriate application rate for each manure type. During the incubation study, the temperature inside the incubator was kept at either 25⁰C (77⁰F). We collected subsamples at 0, 7, 14, 28, and 56 days after the experiment had begun. Subsamples were destructively analyzed for potassium chloride extractable ammonium and nitrate and Bray-1 or Olsen extractable phosphate. Figure 1 shows the schematics of our experimental set-up and components.

What have we learned?
At the time of writing, the experiment has only been run at one temperature, 25⁰C (77⁰F) and subsamples for days 0-28 have been collected. Ammonium and nitrate have been analyzed for subsamples for days 0-14. The remaining treatments will be completed later in 2019. Statistical analyses have not been conducted at this time.
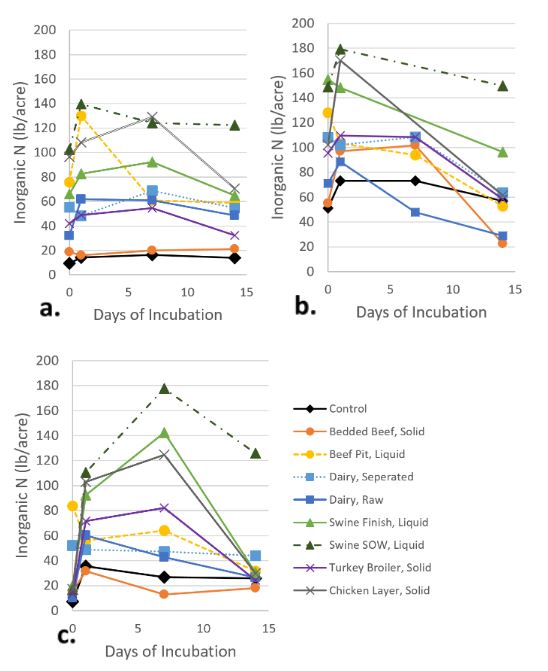
The results of the initial soil and manure tests can be found in Tables 1 and 2, respectively. This will give an idea of the starting conditions of the soils and manures. For visual reference, Figure 2 shows the inorganic N (ammonium + nitrate) from each treatment from days 0-14 for the incubation at 25⁰C. The control samples showed that more inorganic N was present in the medium textured soil than the other soils. In general, the swine manure from both finisher and sow barns released the most inorganic N compared with other manures. Of the beef manures, the liquid deep pit manure tended to release more inorganic N than the bedded pack manure, likely due to the lack of bedding to tie up nitrogen. Of the dairy manures, the raw and liquid separated tended to release inorganic N similarly, except in the medium textured soil where the liquid separated manure released more inorganic N. Across soil types, the inorganic N release tended to be stable in the coarse textured soil, while in the medium and fine textured soil, it appears to have increased initially then slowly decreased. It is unclear why this may have happened but could be due to volatilization of ammonium, denitrification of nitrate, or immobilization of N into organic forms. More tests are needed and will be completed later in 2019.
| Table 1. Initial characteristics of three soil types used in this study: coarse textured soil from Becker, MN; medium textured soil from Rochester, MN; and a fine-textured soil from Morris, MN. | |||
|---|---|---|---|
| Soil Characteristics | Soil Textural Class | ||
| Coarse | Medium | Fine | |
| Organic matter (%) | 1.1 | 1.0 | 3.3 |
| pH | 5.1 | 5.2 | 7.9 |
| Phosphorus – Olsen (ppm) | 11 | 8 | 7 |
| Potassium (ppm) | 95 | 101 | 140 |
| Magnesium (ppm) | 42 | 49 | 570 |
| Calcium (ppm) | 274 | 310 | 3482 |
| Ammonium (ppm) | 3.4 | 2.8 | 8.6 |
| Nitrate (lb/acre) | 3.0 | 2.5 | 8.5 |
| Table 2. Initial characteristics of eight manure types used in this study. The units of nutrients are in pounds per ton for solid manure and in pounds per 1000 gallons for liquid manure. | |||||||
|---|---|---|---|---|---|---|---|
| Species Type | Manure Type | Moisture | Total N | Ammonium-N | Total P (as P2O5) | Total K (as K2O) | C:N Ratio |
| (%) | (lbs per unit) | (lbs per unit) | (lbs per unit) | (lbs per unit) | |||
| Beef | Bedded Pack, Solid | 60.5 | 13.43 | 2.37 | 9.59 | 18.01 | 22:1 |
| Deep Pit, Liquid | 86.6 | 56.72 | 36.7 | 23.43 | 30.83 | 9:1 | |
| Dairy | Separated, Liquid | 93.2 | 32.7 | 15.8 | 13.31 | 29.26 | 7:1 |
| Raw, Liquid | 88.9 | 33.17 | 15.66 | 13.08 | 31.29 | 13:1 | |
| Swine | Finisher, Liquid | 86.8 | 59.16 | 41.63 | 37.63 | 27.35 | 9:1 |
| Sow, Liquid | 99.3 | 16.5 | 15.69 | 1.38 | 11.34 | 1:1 | |
| Poultry | Chicken Layer, Solid | 48.6 | 55.51 | 14.39 | 35.78 | 25.91 | 7:1 |
| Turkey Litter, Solid | 53.0 | 28.2 | 13.16 | 26.69 | 28.65 | 12:1 | |
Future plans
We plan to analyze all the 25 °C samples for nitrogen and phosphorus as well as samples from experiment at 15 and 5 °C this year. We also collected ammonia (NH3) gas samples from the headspace of each jars. We plan to analyze these samples to understand the effects of manure application on ammonia volatilization losses. In addition, on a separate set of experiments we deployed anion and cation exchange resins in each jar. These resins were replaced each week on average. We plan to extract these resins for N and P.
Authors
Dr. Suresh Niraula
Postdoctoral Associate
Department of Soil, Water, and Climate
University of Minnesota (sniraula@umn.edu)
Dr. Melissa Wilson
Assistant Professor and Extension Specialist
Manure Management & Water Quality
Department of Soil, Water, and Climate
University of Minnesota
(Corresponding author email: mlw@umn.edu)
Acknowledgements
This material is based on work that is supported by the Sugarbeet Research and Education Board of Minnesota and North Dakota as well as the Agricultural Fertilizer Research and Education Council of Minnesota.
Additional information
Hernandez JA, Schmitt MA. 2012. Manure management in Minnesota. Saint Paul (MN): University of Minnesota Extension [accessed 24 Nov 2017].
Pagliari PH, Laboski CAM. 2014. Effects of manure inorganic and enzymatically hydrolyzable phosphorus on soil test phosphorus. Soil Soc. of Am. J. 78(4): 1301-1309.
Russelle MP, Blanchet KM, Randall GW, Everett LA. 2009. Characteristics and nitrogen value of stratified bedded pack dairy manure. Crop Management 8(1). https://dl.sciencesocieties.org/ publications/cm/abstracts/8/1/2009-0717-01-RS.
The authors are solely responsible for the content of these proceedings. The technical information does not necessarily reflect the official position of the sponsoring agencies or institutions represented by planning committee members, and inclusion and distribution herein does not constitute an endorsement of views expressed by the same. Printed materials included herein are not refereed publications. Citations should appear as follows. EXAMPLE: Authors. 2019. Title of presentation. Waste to Worth. Minneapolis, MN. April 22-26, 2019. URL of this page. Accessed on: today’s date.
Survey of Pennsylvania Manure Hauler and Broker Certification Program
This presentation will provide an overview of Pennsylvania’s Commercial Manure Hauler and Broker Certification program and highlight results of the industry survey. Pennsylvania’s Manure Hauler and Broker Certification Program was mandated by state law in 2006. The unique program has five certification levels, each with unique education requirements (Table 1). In 2018, a survey was completed by 218 certified individuals at eleven Continuing Education Credit events.
Analysis of the survey revealed a significant positive relationship between certification level and score on knowledge questions. Company owners, managers and supervisors are required to attend more educational programs, and these individuals scored higher on knowledge questions than their employees. Those individuals surveyed worked on an average of 38.5 farms per year. Results of the survey indicated that the program empowers industry professionals with science-based knowledge. Thus, enabling wise field-level decisions across many farms, acres, and manure handling scenarios with positive implications on water quality.
The goals of the survey were to 1) gather descriptive information about certified individuals, 2) test certified individual on key program competencies, and 3) use test results as a tool for evaluation of educational impact and shortfalls to guide future programming. Furthermore, results can validate program effectiveness in discussions with local, state, and federal agencies. Such a body of facts is pertinent and timely as governmental agencies and agricultural interest groups work together to meet goals established for the Chesapeake Bay and beyond.
Program educators feel that survey results supported their thoughts that educational efforts and certification help the industry to continually improve responsible handling of manure nutrients in the state and affirm that these programs have real favorable impacts on water and air quality.
A peer-reviewed journal article is expected to be available later in 2019 that will include greater depth of information on the program and survey.
| Table 1: Description of Certification Levels and Continuing Education Credit (CEC) requirements of Pennsylvania’s Commercial Manure Hauler and Broker Certification Program. | |||
|---|---|---|---|
| Certification Level | Brief Description | Certification Education Requirements | Continuing Education Credit (CEC) Requirements |
| Manure Hauler Level 1 | Transport but not land-apply manure. | Completes verification form and understanding checklist. | None. Must complete checklist annually. |
| Manure Hauler Level 2 | Transport and land-apply manure. Must be supervised. | Studies workbook and completes examination at county office. | 6 CECs in 3-year period. |
| Manure Hauler Level 3 | Owner or manager. Can supervise Hauler Level 2 ‘s. | Attends Act 49 Orientation certification class and completes examination. | 9 CECs in 3-year period. |
| Manure Broker Level 1 | Assumes ownership of manure and determines its end-use. Cannot write Nutrient Balance Sheet. Can supervise Hauler Level 2 ‘s. | Attends Act 49 Orientation certification class and completes examination. | 9 CECs in 3-year period. |
| Manure Broker Level 2 | Assumes ownership of manure and determines its end-use. Can write Nutrient Balance Sheet. Can supervise Hauler Level 2 ‘s. Can take additional course to write P-Index plans. | Attends Act 49 Orientation certification class and completes examination. Attends Nutrient Balance Sheet class and completes examination. | 12 CECs in 3-year period, 3 or more of which must be specific to Nutrient Balance Sheets. |
Author:
Robert Meinen
Senior Extension Associate
Department of Animal Science
The Pennsylvania State University
The authors are solely responsible for the content of these proceedings. The technical information does not necessarily reflect the official position of the sponsoring agencies or institutions represented by planning committee members, and inclusion and distribution herein does not constitute an endorsement of views expressed by the same. Printed materials included herein are not refereed publications. Citations should appear as follows. EXAMPLE: Authors. 2019. Title of presentation. Waste to Worth. Minneapolis, MN. April 22-26, 2019. URL of this page. Accessed on: today’s date.
Comparison between Different Approaches to Estimating Nutrient Balances in Livestock Production Watersheds
Nutrient budgets have been historically developed on livestock farms to improve nutrient use efficiency and reduce field losses. There is growing interest in developing nutrient budgets, particularly for nitrogen and phosphorus, on larger spatial scales such as watersheds and river basins to guide water quality improvement efforts. A big obstacle to developing such budgets is the lack of access to management practices on individual farms. On the other hand, publicly-available data for larger spatial scales, such as survey and census data compiled by the U.S. Department of Agriculture, is typically aggregated to the county or state level. There is a need for a methodology that reliably estimates nutrient budgets in individual watersheds across different production conditions. This study investigates the potential of incorporating spatial data products to refine estimated nutrient budgets. Three different approaches for nutrient budget development will be evaluated across different watersheds, HUC-10 level. Sources of uncertainty in the developed nutrient budgets will be assessed and their respective contribution to the overall budgets will be quantified.
Corresponding Author
Sharara Mahmoud, North Carolina State University, m_sharara@ncsu.edu
Other authors
Horacio Aguirre-Villegas, University of Wisconsin-Madison
Rebecca Larson, University of Wisconsin-Madison
The authors are solely responsible for the content of these proceedings. The technical information does not necessarily reflect the official position of the sponsoring agencies or institutions represented by planning committee members, and inclusion and distribution herein does not constitute an endorsement of views expressed by the same. Printed materials included herein are not refereed publications. Citations should appear as follows. EXAMPLE: Authors. 2019. Title of presentation. Waste to Worth. Minneapolis, MN. April 22-26, 2019. URL of this page. Accessed on: today’s date.
Can Manure Improve Soil Health?
Recently there have been significant effort put into promoting soil health, emphasizing management practices such as low or no tillage, cover crop, and increasing soil organic matter content. A state-wide effort in Missouri has been taken to encourage adoption of cover crops, to improve water quality and soil health. The program presents a unique opportunity for systematic evaluation of soil health indicators, crop rotation and yield, and manure application. Participants are required to submit soil samples to University of Missouri Soil Health Assessment Center (https://cafnr.missouri.edu/soil-health/), on an annual basis, along with critical crop, soil, and manure nutrient management information. The objective of this effort is to assemble and analyze soil health indicators and manure application data.
What did we do?
A team of agricultural engineers and soil scientists in Missouri correlated data of soil health variables and manure land application details, for state-wide and research plot data. For the first dataset (2016-17) collected, the team examined the overall effects of manure land application on soil characteristics, especially those that have more implication in soil health. In addition to the typical soil nutrient (nitrogen and phosphorus) variables, many key soil health indicators that were included in the program are total organic carbon, active carbon, exchangeable cations, bulk density, and water stable aggregates. Some of the important management information collected from the program included field location, crop rotation, tillage use, and if there was previous cover crop use, etc. Manure land application information included manure type, application rate, and method applied.
In order to better examine the effects of manure land application on soil characteristics, another set of data from research plots was examined. The controlled, experimental field plots had consistent tillage and repeated crop and fertilizer treatments. Some of the plot management considered included full fertilizer, no fertilizer, manure application (6 tons manure/acre), and green manure (red clover). A wide range of cropping systems were conducted, ranging from continuous corn, continuous soybean, continuous wheat, continuous Timothy, to three-year rotation of corn-wheat-red clover, and four-year rotation of corn-soybean-wheat-red clover.
What we have learned?
A significant difference was found only for phosphorus for the state-wide samples. The lack of correlation is mostly likely because of relatively few samples were associated with manure application, and the samples were highly variable in tillage, soil type, crop, and manure type, application rate and methods. However, when the effects of manure land application was compared within the counties, the manure applications increased the active carbon contents (p<0.01) for two of the top three counties where manure application data was collected. The manure application also significantly increased (p <0.05) organic carbon, phosphorus, potentially mineralizable nitrogen, and water stable aggregate values for Stoddard county.
For the central Missouri research plot data, the manure land application clearly affected several key variables. The manure application has resulted in higher soil organic carbon, active carbon, phosphorus, and water stable aggregates, and lower bulk density, Figures 1 and 2.
Include impacts/implications of the project or research.
These findings confirm that the benefits of manure application in increasing soil organic materials and improving soil aggregate ability can be seen at least from fields that were consistently treated. While considering measurable economic and environmental impacts of nutrient and manure management, especially for increasing the carbon content in the crop fields, manure land application can be one of the recommended practices.
What should people remember as take-home messages from your presentation?
Manure application can be considered an effective management to increase soil organic carbon, active carbon, and water stable aggregates, and decrease soil bulk density, although the results have also shown to increase soil phosphorus content. The findings regarding manure use and important soil health indicators are important to management of the soil and can be contributing to many factors need to be considered for increasing food production on a limited land base.
Future plans
Continue analyzing the growing management and soil analysis dataset, and cross examining the correlation between the different variables. The team will promote the findings and encourage management that can result in better soil health and resource preservation.
Authors
Lim, Teng (Associate Professor and Extension Agricultural Engineer, Agricultural Systems Management, University of Missouri, limt@missouri.edu)
Wang, Allen Haipeng (Heilongjiang Bayi Agricultural University); Brandt, Donna, (University of Missouri); Norkaew, Saranya, (University of Missouri); Miles, Randy (University of Missouri); and Rick Koelsch, (University of Nebraska, Lincoln).
Additional information
Please visit https://soilhealthnexus.org/can-manure-improve-soil-health/ to find more information and download the data brief and final report.
Acknowledgements
Funding for this data analysis and report were provided by the North Central Region Water Network – a 12-state collaboration between Extension water resource professionals and university, federal, state, NGO and industry partners; and Soil Health Institute (http://soilhealthinstitute.org/).


The authors are solely responsible for the content of these proceedings. The technical information does not necessarily reflect the official position of the sponsoring agencies or institutions represented by planning committee members, and inclusion and distribution herein does not constitute an endorsement of views expressed by the same. Printed materials included herein are not refereed publications. Citations should appear as follows. EXAMPLE: Authors. 2019. Title of presentation. Waste to Worth. Minneapolis, MN. April 22-26, 2019. URL of this page. Accessed on: today’s date.
Pasture-based Dairy Impact on Nitrogen and Phosphorus Cycling in Response to Grazing Grass-Legume Mixtures over Monocultures
There are over 3.5 million milk cows in the Western United States, making dairy one of the dominant sectors of western agriculture. Organic milk production is the fastest growing segment of U.S. organic agriculture and as a result there has been an increase in pasture-based milk production. To meet this increasing demand, improved grass-legume pastures that require fewer inputs, have high forage production and nutritive value, improve ruminant utilization of nitrogen, and have high dry matter intake are critical to the economic viability of pasture-based organic dairies. While grazing has many benefits, it may accelerate nutrient cycling and potentially increase nitrate leaching along with being a significant contributor of ammonia (NH3) and greenhouse gases (GHG). Dietary changes can impact emissions. This study examines the effect of condensed tannins (CT) on nutrient cycling in the grass-legume versus grass monoculture grazing systems. The nitrogen content in urine and feces of cattle grazing forages with, and without CT, was also examined and compared to a traditional TMR diet.
What did we do?
Four grasses, with and without the addition of a tannin-containing legume, birdsfoot trefoil (Lotus corniculatus), are examined in this study. The treatments include tall fescue (Lolium arundinaceum); meadow bromegrass (Bromus biebersteinii); orchardgrass (Dactylis glomerata); perennial ryegrass (Lolium perenne) planted as monocultures; and each of the four grasses planted with birdsfoot trefoil for a total of eight treatments. Treatments were grazed by Jersey heifers using a rotational grazing system(1 week intervals). All treatments were fertilized with Chilean nitrate in April of 2017 and 2018. Grass monocultures were fertilized with feather meal in June 2017 and March 2018, and Chilean nitrate in July 2017 and 2018.
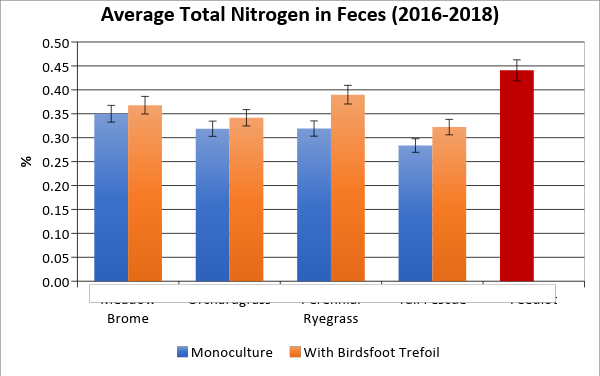
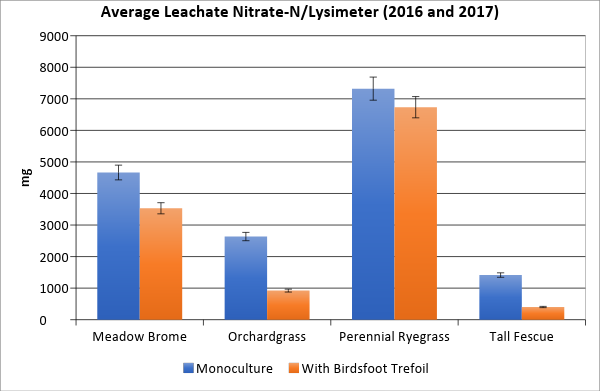
Grab fecal and urine samples were collected at the beginning of the grazing season and additionally every five weeks at the end of grazing rotations. Fecal samples were analyzed for total nitrogen by combustion method. Leachate was collected weekly by means of suction cup lysimeters and bi-weekly by means of zero-tension lysimeters and analyzed for nitrate-nitrogen using method 10-107-04-1-R on a Lachat FIA analyzer.
What we have learned?
Urea in urine, and fecal nitrogen were highest in the feedlot system (TMR diet). Urea and fecal nitrogen in the grazing systems were higher in the grass-legume mixtures than the grass monocultures even though tannins have been shown to shift nitrogen from the urine to the feces. This is most likely due to the higher protein (nitrogen) content of the grass-legume mixtures compared to the grass monocultures (data not shown). Despite the higher protein content of the grass-legume mixtures, the treatments containing birdsfoot trefoil exhibited less nitrogen loss due to leaching than the grass monocultures. Grass-legume mixtures have the potential to greatly improve the economic viability of a grazing operation while reducing the environmental impacts.

Future plans
This study will be repeated for another year using Holstein heifers instead of Jersey heifers to see if there is a difference in nitrogen utilization between breeds. Treatments that are not being grazed will be harvested and fed in a feedlot setting to see if the benefits of birdsfoot trefoil remain when it is fed as silage.
Authors
Jennifer Long, Agricultural Systems Technology and Education Dept.; Utah State University
Jennifer.Long@aggiemail.usu.edu
Rhonda Miller, Ph.D.; Agricultural Systems Technology and Education Dept.; Utah State University
Blair Waldron, Ph.D.; USDA-ARS Forage and Ranger Research Lab
Clay Isom, Ph.D.; Animal, Dairy and Veterinary Sciences Dept.; Utah State University
Kara Thornton, Ph.D.; Animal, Dairy and Veterinary Sciences Dept.; Utah State University
Kerry Rood, Ph.D.; Animal, Dairy and Veterinary Sciences Dept.; Utah State University
Michael Peel, Ph.D.; USDA-ARS Forage and Range Research Lab
Earl Creech, Ph.D; Plants, Soils, and Climate Dept.; Utah State University
Jacob Hadfield; Animal, Dairy and Veterinary Sciences Dept.; Utah State University
Marcus Rose; Plant, Soils, and Climate Dept.; Utah State University
The authors are solely responsible for the content of these proceedings. The technical information does not necessarily reflect the official position of the sponsoring agencies or institutions represented by planning committee members, and inclusion and distribution herein does not constitute an endorsement of views expressed by the same. Printed materials included herein are not refereed publications. Citations should appear as follows. EXAMPLE: Authors. 2019. Title of presentation. Waste to Worth. Minneapolis, MN. April 22-26, 2019. URL of this page. Accessed on: today’s date.
Renewable Energy Set-asides Push Biogas to Pipeline
Proceedings Home | W2W Home 
Purpose
Deriving the most value from the harvesting of organic wastes, particularly waste produced through farming operations, can be quite challenging. This paper describes an approach to overcome the challenges of realizing the best value from harvested farming wastes through aggregation. Included in this description is an overview of the first swine waste-to-energy project in North Carolina based on aggregation of the value stream rather than aggregation of the feedstock, or manure. Also included in the description are an overview of the challenges encountered, approaches to overcome these challenges, and the solutions developed for this breakthrough approach that will foster further development of successful ventures to maximize the value derived from recycled farming wastes.
What did we do?
Increasingly, our civilization is turning to bioenergy sources as an environmentally-friendly, sustainable alternative to harvesting long-buried fossil fuel sources to supply our energy needs. As the land that farmers have cultivated for years becomes encroached more and more by non-farming land uses, society seeks innovations to address its concerns for our future food needs produced in a manner that addresses environmental concerns associated with modern food production, including nutrient recovery, water conservation and reuse, and controlling odors and emissions from agricultural wastes and manures. Collectively, these innovations have been described as ‘sustainable farming’ approaches.
North Carolina is a significant agricultural producer, and as such, a large producer of agricultural wastes. This state also became the first state in the Southeast to adopt a Renewable Energy Portfolio Standard, and is the only state in the U.S. to require a certain percentage of that renewable energy must be generated from agriculture waste recovery, with specific targets for swine and poultry waste. Naturally, the plentiful resources coupled with a regulatory driver for renewable energy worked together to create attention and efforts toward cost-effective and efficient means of supplying our energy needs through organic waste recovery, or bioenergy approaches.
We are only beginning to see a surge in commercial development for the recovery of additional value stream from the waste, such as through the recovery of nutrients, enzymes, and monetized environmental attributes associated with pollution abatement. While many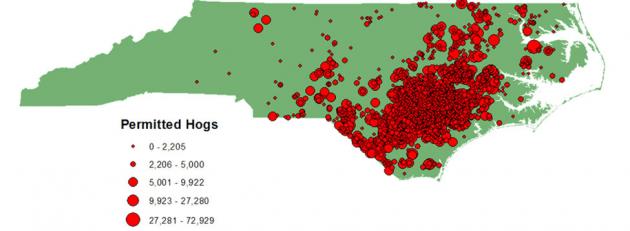 forward-thinking farmers have learned that their waste is valuable for supplying renewable energy, it has been unfortunately difficult for an individual farmer to implement and manage advanced value recovery systems primarily due to costs of scale. Rather, it seems, success may be easier achieved through the aggregation of these products from several farms and through the collaborative efforts of project developers, product offtakers, and policy. A shining example of such aggregation and collaboration can be observed from the Optima-KV swine waste to pipeline renewable gas project, located in eastern North Carolina in an area of dense swine farm population.
The Optima-KV project combines, or aggregates, the biogas created from the anaerobic digestion of swine waste from five (5) adjacently located farms housing approximately 60,000 finishing pigs. The Optima-KV project includes the construction of an in-ground anaerobic digester at each farm. The resulting biogas is captured from each farm, and routed to an adjacent, centralized biogas upgrading facility, or refinery, where the biogas undergoes purification and cleaning to pipeline quality specifications. The renewable natural gas produced from this system will be sold to an electric utility subject to the requirements of the North Carolina Renewable Energy Portfolio Standards, and will result in reduced emissions from both the receiving electricity generating unit and the farms, reduced emissions of odors from the farms, and reduced fossil fuel consumption for the production of electricity. The upgraded biogas (RNG) will be transmitted to the electricity generating unit through existing natural gas pipeline infrastructure.
What have we learned?
The innovative design, permitting, and financing for the project is very different than a conventional feedstock aggregation approach, and thus much has been learned. To deliver the RNG to the end user, in this case, multiple contracts with multiple utilities were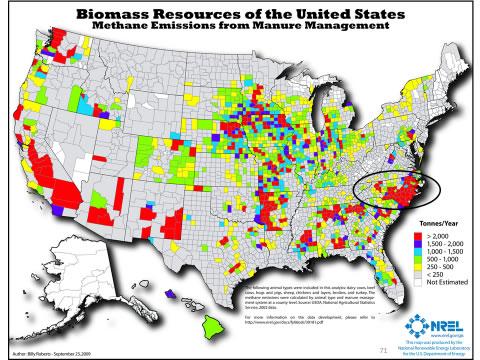 required, which presented challenges of negotiating multiple utility connections and agreements. This learning curve was steepened as, at the time of the inception of Optima KV, the state of North Carolina lacked formal pipeline injection standards, so the final required quality and manner of gas upgrading was established through the development of the project.
The project is currently in the beginning stages of construction, and completion is expected by the end of 2017. Given this schedule, the Optima KV project will provide the first pipeline injection of gas – from any source – in the state of North Carolina (all natural gas presently consumed in the state is sourced from out of state).
Future Plans
North Carolina’s potential for agricultural waste-to-energy projects is enormous, given its vast agricultural resources. Combining the potential from agriculture with the bioenergy potential from wastewater treatment plants and landfills, it is estimated to be third in capacity behind only California and Texas. The unique approach to aggregation of value streams from multiple sources, as exhibited by this project, will open the doors for similar aggregation strategies, including the anaerobic digestion of mixed feedstocks such as food waste, poultry and swine waste, animal mortality, fats, oils and grease and energy crops.
Corresponding author, title, and affiliation
Gus Simmons, P.E., Director of Bioenergy, Cavanaugh & Associates, P.A.
Corresponding author email
gus.simmons@cavanaughsolutions.com
Additional information
http://www.cavanaughsolutions.com/bioenergy/
1-877-557-8923
gus.simmons@cavanaughsolutions.com
https://www.biocycle.net/2016/11/10/anaerobic-digest-67/
The authors are solely responsible for the content of these proceedings. The technical information does not necessarily reflect the official position of the sponsoring agencies or institutions represented by planning committee members, and inclusion and distribution herein does not constitute an endorsement of views expressed by the same. Printed materials included herein are not refereed publications. Citations should appear as follows. EXAMPLE: Authors. 2017. Title of presentation. Waste to Worth: Spreading Science and Solutions. Cary, NC. April 18-21, 2017. URL of this page. Accessed on: today’s date.