Recently there have been significant effort put into promoting soil health, emphasizing management practices such as low or no tillage, cover crop, and increasing soil organic matter content. A state-wide effort in Missouri has been taken to encourage adoption of cover crops, to improve water quality and soil health. The program presents a unique opportunity for systematic evaluation of soil health indicators, crop rotation and yield, and manure application. Participants are required to submit soil samples to University of Missouri Soil Health Assessment Center (https://cafnr.missouri.edu/soil-health/), on an annual basis, along with critical crop, soil, and manure nutrient management information. The objective of this effort is to assemble and analyze soil health indicators and manure application data.
What did we do?
A team of agricultural engineers and soil scientists in Missouri correlated data of soil health variables and manure land application details, for state-wide and research plot data. For the first dataset (2016-17) collected, the team examined the overall effects of manure land application on soil characteristics, especially those that have more implication in soil health. In addition to the typical soil nutrient (nitrogen and phosphorus) variables, many key soil health indicators that were included in the program are total organic carbon, active carbon, exchangeable cations, bulk density, and water stable aggregates. Some of the important management information collected from the program included field location, crop rotation, tillage use, and if there was previous cover crop use, etc. Manure land application information included manure type, application rate, and method applied.
In order to better examine the effects of manure land application on soil characteristics, another set of data from research plots was examined. The controlled, experimental field plots had consistent tillage and repeated crop and fertilizer treatments. Some of the plot management considered included full fertilizer, no fertilizer, manure application (6 tons manure/acre), and green manure (red clover). A wide range of cropping systems were conducted, ranging from continuous corn, continuous soybean, continuous wheat, continuous Timothy, to three-year rotation of corn-wheat-red clover, and four-year rotation of corn-soybean-wheat-red clover.
What we have learned?
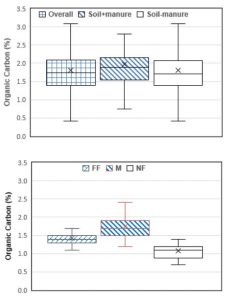
A significant difference was found only for phosphorus for the state-wide samples. The lack of correlation is mostly likely because of relatively few samples were associated with manure application, and the samples were highly variable in tillage, soil type, crop, and manure type, application rate and methods. However, when the effects of manure land application was compared within the counties, the manure applications increased the active carbon contents (p<0.01) for two of the top three counties where manure application data was collected. The manure application also significantly increased (p <0.05) organic carbon, phosphorus, potentially mineralizable nitrogen, and water stable aggregate values for Stoddard county.
For the central Missouri research plot data, the manure land application clearly affected several key variables. The manure application has resulted in higher soil organic carbon, active carbon, phosphorus, and water stable aggregates, and lower bulk density, Figures 1 and 2.
Include impacts/implications of the project or research.
These findings confirm that the benefits of manure application in increasing soil organic materials and improving soil aggregate ability can be seen at least from fields that were consistently treated. While considering measurable economic and environmental impacts of nutrient and manure management, especially for increasing the carbon content in the crop fields, manure land application can be one of the recommended practices.
What should people remember as take-home messages from your presentation?
Manure application can be considered an effective management to increase soil organic carbon, active carbon, and water stable aggregates, and decrease soil bulk density, although the results have also shown to increase soil phosphorus content. The findings regarding manure use and important soil health indicators are important to management of the soil and can be contributing to many factors need to be considered for increasing food production on a limited land base.
Future plans
Continue analyzing the growing management and soil analysis dataset, and cross examining the correlation between the different variables. The team will promote the findings and encourage management that can result in better soil health and resource preservation.
Authors
Lim, Teng (Associate Professor and Extension Agricultural Engineer, Agricultural Systems Management, University of Missouri, limt@missouri.edu)
Wang, Allen Haipeng (Heilongjiang Bayi Agricultural University); Brandt, Donna, (University of Missouri); Norkaew, Saranya, (University of Missouri); Miles, Randy (University of Missouri); and Rick Koelsch, (University of Nebraska, Lincoln).
Additional information
Please visit https://soilhealthnexus.org/can-manure-improve-soil-health/ to find more information and download the data brief and final report.
Acknowledgements
Funding for this data analysis and report were provided by the North Central Region Water Network – a 12-state collaboration between Extension water resource professionals and university, federal, state, NGO and industry partners; and Soil Health Institute (http://soilhealthinstitute.org/).


The authors are solely responsible for the content of these proceedings. The technical information does not necessarily reflect the official position of the sponsoring agencies or institutions represented by planning committee members, and inclusion and distribution herein does not constitute an endorsement of views expressed by the same. Printed materials included herein are not refereed publications. Citations should appear as follows. EXAMPLE: Authors. 2019. Title of presentation. Waste to Worth. Minneapolis, MN. April 22-26, 2019. URL of this page. Accessed on: today’s date.

