
Early Stage Economic Modeling of Gas-permeable Membrane Technology Applied to Swine Manure after Anaerobic Digestion


Proceedings Home W2W Home w2w17 logo

Purpose

The objective of this study was to conduct cost versus design analysis for a gas-permeable membrane system using data from a small pilot scale experiment and projection of cost versus design to farm scale.

What did we do?

This reported work includes two major steps. First, the design of a small pilot scale batch gas-permeable membrane system was scaled to process effluent volumes from a commercial pig farm. The scaling design maintained critical process operating parameters of the experimental membrane system and introduced assumed features to characterize effluent flows from a working pig farm with an anaerobic digester. The scaled up design was characterized in a spreadsheet model. The second step was economic analysis of the scaled-up model of the membrane system. The objective of the economic analysis was to create information to guide subsequent experiments towards commercial development of the technology. The economic analysis was performed by introducing market prices for components, inputs, and products and then calculating effects on costs and on performance of changes in design parameters.

What have we learned?

First, baseline costs and revenues were calculated for the scaled up experimental design. The commercial scale design of a modular gas-permeable membrane system was modeled to treat 6 days accumulation of digester effluent at 16,300 gallons per day resulting in a batch capacity of 97,800 gallons. The modeled large scale system is 19,485 times the capacity of the 5.02 gallon experimental pilot system. The installation cost of the commercial scale system was estimated to be $903,333 for a system treating 97,800 gallon batches over a 6 day period.

At $1/linear ft. and 7.9 ft./gallon of batch capacity, membrane material makes up 86% of the estimated installation cost. Other installation costs include PVC pipes, pumps, aerators, tanks, and other parts and equipment used to assemble the system, as well as water to dilute the concentrated acid prior to initiating circulation. The annual operating cost of the system includes concentrated sulfuric acid consumed in the process. Using limited experimental data on this point, we assume a rate of 0.009 gallons (0.133 pounds) of acid per gallon of digester effluent treated. At a price of $1.11 per gallon ($0.073/lb) of acid, acid cost per gallon of effluent treated is $0.010. Other operating costs include electric power, labor, and repairs and maintenance of the membrane and other parts of the system estimated at 2% of investment cost for non-moving parts and 6% of investment for moving parts. Potential annual revenue from the system includes the value of ammonium sulfate produced. Over the 6 day treatment period, if 85% of the TAN-N in the digester effluent is removed by the process, and if 100% of the TAN-N removed is recovered as ammonium sulfate, and given the TAN-N concentration in digester effluent was 0.012 pounds per gallon (1401 mg/l), then 0.01 pounds of TAN-N are captured per gallon of effluent treated. At an ammonium sulfate fertilizer price of $588/ton or $0.294/pound and ammonium sulfate production of 0.047 pounds (0.01 pounds TAN-N equivalent), potential revenue is $0.014 per gallon of effluent treated. No price is attached here for the elimination of internal and external costs associated with potential release to the environment of 0.01 pounds TAN-N per gallon of digester effluent or 59,073 pounds TAN-N per year from the system modeled here.

Several findings and questions, reported here, are relevant to next steps in experimental evaluation and commercial development of this technology.

1. Membrane price and/or performance can be improved to substantially reduce installation cost. Membrane material makes up 86% of the current estimated installation cost. Each 10% reduction in the product of membrane price and length of membrane tube required per gallon capacity reduces estimated installation cost per gallon capacity by 8.6%.

2. The longevity and maintenance requirements of the membrane in this system were not examined in the experiment. Installation cost recovery per gallon of effluent decreases at a declining rate with longevity. For example, Cost Recovery Factors (percentage of initial investment charged as an annual cost) at 6% annual interest rate vary with economic life of the investment as follows: 1 year life CRF = 106%, 5 year life CRF = 24%, 10 year life CRF = 14% . Repair costs are often estimated as 2% of initial investment in non-moving parts. In the case of the membrane, annual repair and maintenance costs may increase with increased longevity. Longevity and maintenance requirements of membranes are important factors in determining total cost per gallon treated.

3. Based on experimental performance data (TAN removal in Table 1) and projected installation cost for various design treatment periods ( HRT = 2, 3, 4, 5, or 6 days), installation cost per unit mass of TAN removal decreases and then increases with the length of treatment period. The minimum occurs at HRT = 4 days when 68% reduction of TAN-N in the effluent has been achieved.

Table 1. Comparison of installation cost and days of treatment capacity

4. Cost of acid relative to TAN removal from the effluent and relative to fertilizer value of ammonium sulfate produced per gallon of effluent treated are important to operating cost of the membrane system. These coefficients were beyond the scope of the experiment although some pertinent data were generated. Questions are raised about the fate of acid in circulation. What fraction of acid remains in circulation after a batch is completed? What fraction of acid reacts with other constituents of the effluent to create other products in the circulating acid solution? What fraction of acid escapes through the membrane into the effluent? Increased efficiency of TAN removal from the effluent per unit of acid consumed will reduce the cost per unit TAN removed. Increased efficiency of converting acid to ammonium sulfate will reduce the net cost of acid per gallon treated.

5. Several operating parameters that remain to be explored affect costs and revenues per unit of effluent treated. Among those are parameters that potentially affect TAN movement through the membrane such as: a) pH of the effluent and pH of the acid solution in circulation, b) velocity of liquids on both sides of the membrane, and c) surface area of the membrane per volume of liquids; effluent and acid solution, in the reactor. Similarly, the most profitable or cost effective method of raising pH of the digester effluent remains to be determined, as it was beyond the scope of the current study. Aeration was used in this experiment and in the cost modeling. Aeration may or may not be the optimum method of raising pH and the optimum is contingent on relative prices of alternatives as well as their effect on overall system performance. Optimization of design to maximize profit or minimize cost requires knowledge of these performance response functions and associated cost functions.

6. Management of ammonium sulfate is a question to be addressed in future development of this technology. Questions that arise include: a) how does ammonium sulfate concentration in the acid solution affect rates of TAN removal and additional ammonia sulfate production, b) how can ammonium sulfate be removed from, or further concentrated in, the acid solution, c) can the acid solution containing ammonium sulfate be used without further modification and in which processes, d) what are possible uses for the acid solution after removal of ammonium sulfate, e) what are the possible uses for the effluent after removal of some TAN, and f) what are the costs and revenues associated with each of the alternatives. Answers to these questions are important to designing the membrane system and associated logistics and markets for used acid solution and ammonium sulfate. The realized value of ammonium sulfate and the cost (and revenue) of used acid solution are derived from optimization of this p art of the system.

7. LCA work on various configurations and operating parameters of the membrane system remains to be done. Concurrent with measurement of performance response functions for various parts of the membrane system, LCA work will quantify associated use of resources and emissions to the environment. Revenues may arise where external benefits are created and markets for those benefits exist. Where revenues are not available, marginal costs per unit of emission reduction or resource extraction reduction can be calculated to enable optimization of design across both profit and external factors.

Future Plans

A series of subsequent experiments and analyses are suggested in the previous section. Suggested work is aimed at improving knowledge of performance response to marginal changes in operating parameters and improving knowledge of the performance of various membranes. Profit maximization, cost minimization, and design optimization across both financial and external criteria require knowledge of performance response functions over a substantial number of variables. The economic analysis presented here addresses the challenge of projecting commercial scale costs and returns with data from an early stage experimental small pilot; and illustrates use of such preliminary costs and returns projections to inform subsequent experimentation and development of the technology. We will continue to refine this economic approach and describe it in future publications.

Corresponding author, title, and affiliation

Kelly Zering, Professor, Agricultural and Resource Economics, North Carolina State University

Corresponding author email

kzering@ncsu.edu

Other authors

Yijia Zhao, Graduate Student at BAE, NCSU; Shannon Banner, Graduate Student at BAE, NCSU; Mark Rice, Extension Specialist at BAE, NCSU; John Classen, Associate Professor and Director of Graduate Programs at BAE, NCSU

Acknowledgements

This project was supported by NRCS CIG Award 69-3A75-12-183.

Recovery of Proteins and Phosphorus from Manure

Proceedings Home W2W Home w2w17 logo

*Purpose

The recovery of phosphorus and proteins from manure could be advantageous to both offset costs and to improve and lessen the environmental impacts of manure storage and treatment. Phosphorous in manure can contaminate rivers, lakes, and bays through runoff, if applied onto cropland at excessive rates. Thus, recovering phosphorous from manure can not only help reduce phosphorus loss in runoff, but also reduces the use of commercial fertilizer based upon phosphate rock. Phosphorus mines have limited reserves and viable alternatives for replacing rock phosphate as fertilizer do not exist. Protein is a natural resource used in a wide range of commercial applications from pharmaceuticals to dietary supplements, foods, feeds, and industrial applications.

What Did We Do?

A new method for simultaneous extraction of proteins and phosphorus from biological materials has been developed and is presented.  The experiments used swine manure solids fraction after solids-liquid separation.  From raw manure, wet solids are dissolved in acidic solution and then treated with a basic solution so phosphorus will precipitate and be reclaimed.  The proteins in the washed solids can be extracted and concentrated with ultrafiltration and flocculation.

Test tubes filled with proteins from manure

What Have We Learned?

On a dry-weight basis, it was found that the separated manure solids contained 15.2-17.4% proteins and 3.0% phosphorus.  Quantitative extraction of phosphorus and proteins from manures was possible with this new system. The phosphorus was first separated from the solids in a soluble extract, then the proteins were separated from the solids and solubilized with an alkali solvent.  Both phosphorus and protein recovery were enhanced about 19 and 22%, respectively, with the inclusion of a rinse after the washing. The recovered phosphorus solids had 20.4% phosphates (P2O5).  The protein extract was concentrated using ultrafiltration (UF) and lyophilization to obtain a protein solids concentrate.  UF of 5 and 10 kDa captured all the proteins, but 30 kDa resulted in 22% loss.  The protein solids were converted into amino-acids using acid hydrolysis.  Further, the system was proved effective in extracting phosphorus and proteins from other biological materials, such as algae or crops. The recovered proteins could be used for production of amino acids and the recovered phosphorus could be used as a recycled material that replaces commercial phosphate fertilizers.  This could be a potential new revenue stream from wastes.

Future Plans

Further research will be conducted to reduce process costs and separate the amino acids.

Corresponding author (name, title, affiliation)

Matias Vanotti, USDA-ARS

Corresponding author email address

matias.vanotti@ars.usda.gov

Other Authors

A.A. Szogi, P.W. Brigman

Additional Information

Vanotti, M.B. and Szogi, A.A.  (2016).  Extraction of amino acids and phosphorus from biological materials. US Patent Application SN 15/350,283. U.S. Patent & Trademark Office.

USDA-ARS Office of Technology Transfer, Invention Docket No: 080.15, Contact: thomas.valco@ars.usda.gov

Acknowledgements

This research is part of USDA-ARS Project 6082-12630-001-00D “Improvement of Soil Management Practices and Manure Treatment/Handling Systems of the Southern Coastal Plains.”  We acknowledge the field and laboratory assistance of William Brigman and Chris Brown, USDA-ARS, Florence, SC.  Support by The Kaiteki Institute, Mitsubishi Chemical Holdings Group through ARS Cooperative Agreement 58-6082-5-006-F is acknowledged.

Renewable Energy Set-asides Push Biogas to Pipeline

Proceedings Home W2W Home w2w17 logo

Purpose

Deriving the most value from the harvesting of organic wastes, particularly waste produced through farming operations, can be quite challenging. This paper describes an approach to overcome the challenges of realizing the best value from harvested farming wastes through aggregation. Included in this description is an overview of the first swine waste-to-energy project in North Carolina based on aggregation of the value stream rather than aggregation of the feedstock, or manure. Also included in the description are an overview of the challenges encountered, approaches to overcome these challenges, and the solutions developed for this breakthrough approach that will foster further development of successful ventures to maximize the value derived from recycled farming wastes.

What did we do?

Increasingly, our civilization is turning to bioenergy sources as an environmentally-friendly, sustainable alternative to harvesting long-buried fossil fuel sources to supply our energy needs. As the land that farmers have cultivated for years becomes encroached more and more by non-farming land uses, society seeks innovations to address its concerns for our future food needs produced in a manner that addresses environmental concerns associated with modern food production, including nutrient recovery, water conservation and reuse, and controlling odors and emissions from agricultural wastes and manures. Collectively, these innovations have been described as ‘sustainable farming’ approaches.

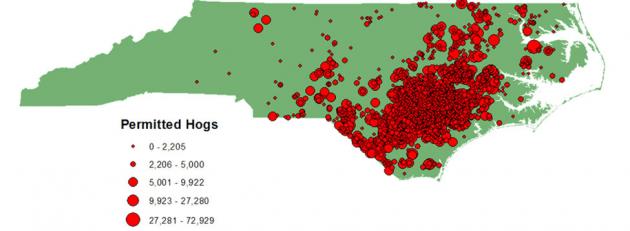
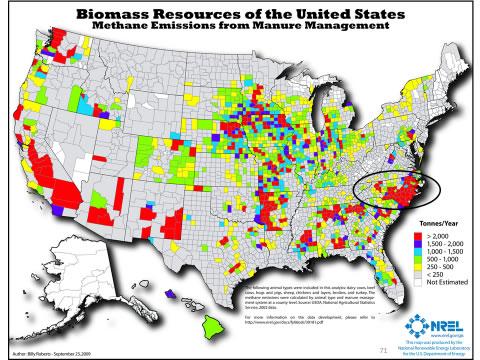
North Carolina is a significant agricultural producer, and as such, a large producer of agricultural wastes. This state also became the first state in the Southeast to adopt a Renewable Energy Portfolio Standard, and is the only state in the U.S. to require a certain percentage of that renewable energy must be generated from agriculture waste recovery, with specific targets for swine and poultry waste. Naturally, the plentiful resources coupled with a regulatory driver for renewable energy worked together to create attention and efforts toward cost-effective and efficient means of supplying our energy needs through organic waste recovery, or bioenergy approaches.

We are only beginning to see a surge in commercial development for the recovery of additional value stream from the waste, such as through the recovery of nutrients, enzymes, and monetized environmental attributes associated with pollution abatement. While manyOptima-KV swine waste to pipeline RNG project forward-thinking farmers have learned that their waste is valuable for supplying renewable energy, it has been unfortunately difficult for an individual farmer to implement and manage advanced value recovery systems primarily due to costs of scale. Rather, it seems, success may be easier achieved through the aggregation of these products from several farms and through the collaborative efforts of project developers, product offtakers, and policy. A shining example of such aggregation and collaboration can be observed from the Optima-KV swine waste to pipeline renewable gas project, located in eastern North Carolina in an area of dense swine farm population.

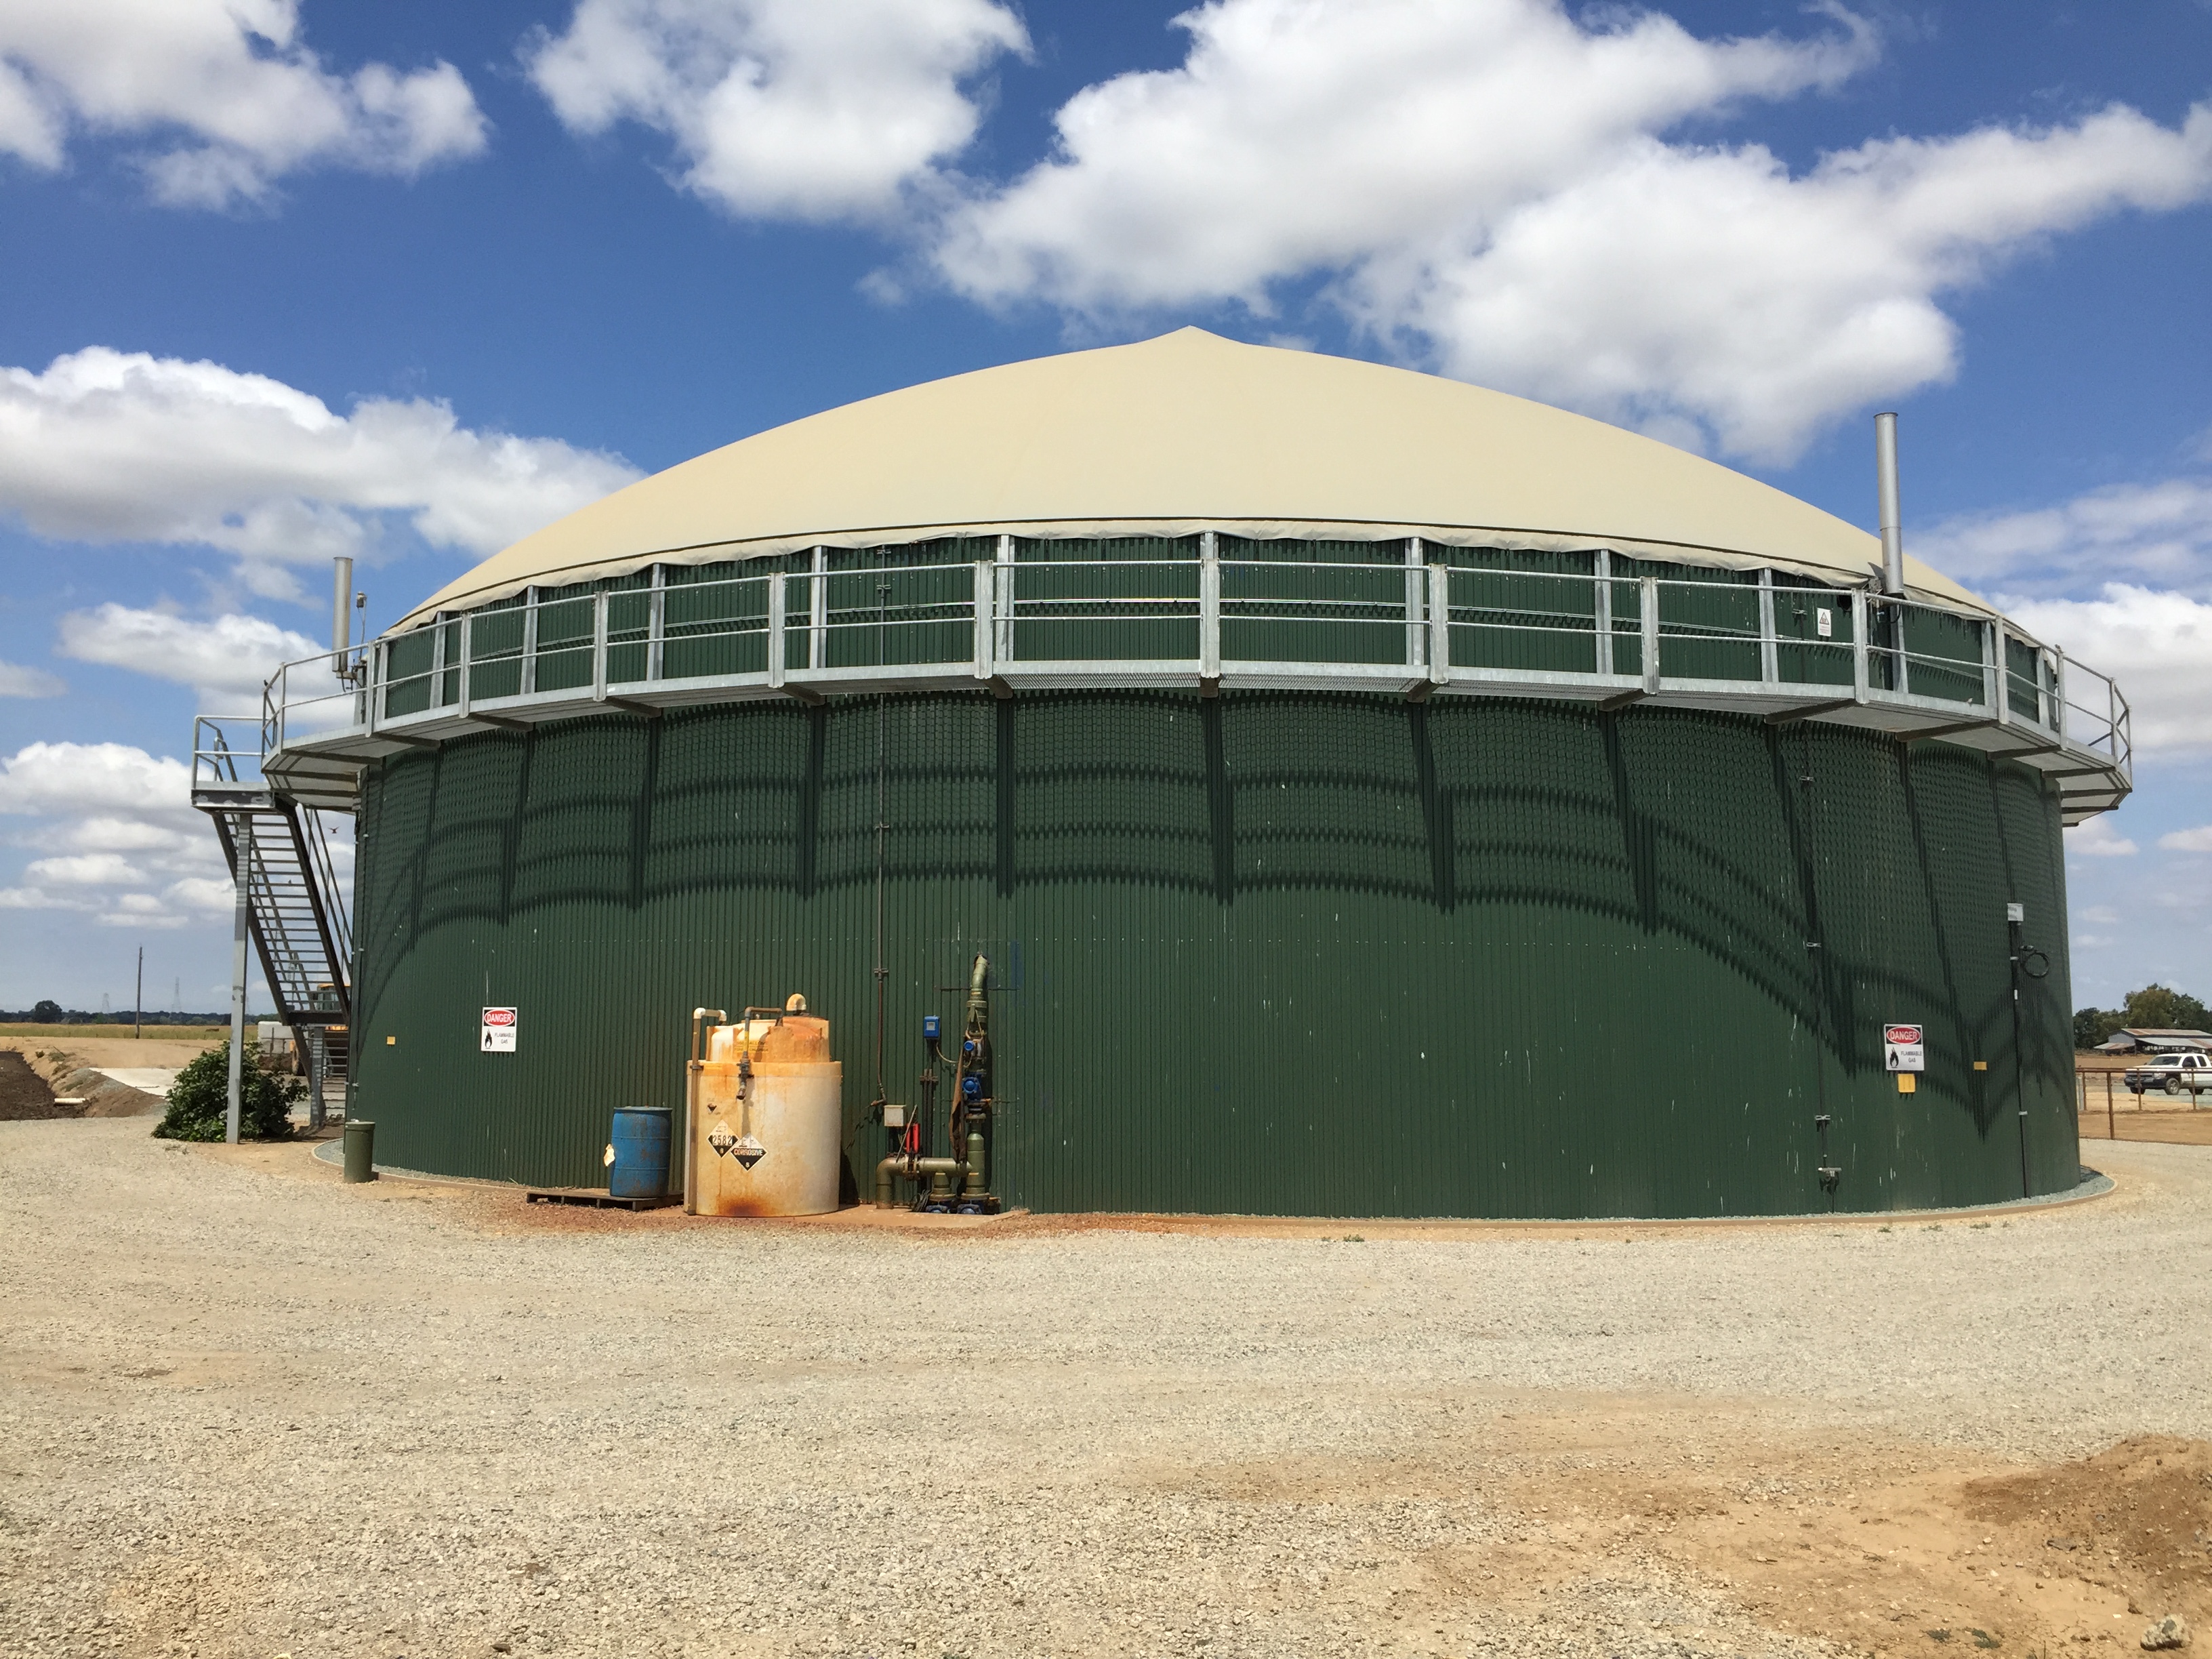
The Optima-KV project combines, or aggregates, the biogas created from the anaerobic digestion of swine waste from five (5) adjacently located farms housing approximately 60,000 finishing pigs. The Optima-KV project includes the construction of an in-ground anaerobic digester at each farm. The resulting biogas is captured from each farm, and routed to an adjacent, centralized biogas upgrading facility, or refinery, where the biogas undergoes purification and cleaning to pipeline quality specifications. The renewable natural gas produced from this system will be sold to an electric utility subject to the requirements of the North Carolina Renewable Energy Portfolio Standards, and will result in reduced emissions from both the receiving electricity generating unit and the farms, reduced emissions of odors from the farms, and reduced fossil fuel consumption for the production of electricity. The upgraded biogas (RNG) will be transmitted to the electricity generating unit through existing natural gas pipeline infrastructure.

What have we learned?

The innovative design, permitting, and financing for the project is very different than a conventional feedstock aggregation approach, and thus much has been learned. To deliver the RNG to the end user, in this case, multiple contracts with multiple utilities wereGraphic showing how it works required, which presented challenges of negotiating multiple utility connections and agreements. This learning curve was steepened as, at the time of the inception of Optima KV, the state of North Carolina lacked formal pipeline injection standards, so the final required quality and manner of gas upgrading was established through the development of the project.

The project is currently in the beginning stages of construction, and completion is expected by the end of 2017. Given this schedule, the Optima KV project will provide the first pipeline injection of gas – from any source – in the state of North Carolina (all natural gas presently consumed in the state is sourced from out of state).

Future Plans

North Carolina’s potential for agricultural waste-to-energy projects is enormous, given its vast agricultural resources. Combining the potential from agriculture with the bioenergy potential from wastewater treatment plants and landfills, it is estimated to be third in capacity behind only California and Texas. The unique approach to aggregation of value streams from multiple sources, as exhibited by this project, will open the doors for similar aggregation strategies, including the anaerobic digestion of mixed feedstocks such as food waste, poultry and swine waste, animal mortality, fats, oils and grease and energy crops.

Corresponding author, title, and affiliation

Gus Simmons, P.E., Director of Bioenergy, Cavanaugh & Associates, P.A.

Corresponding author email

gus.simmons@cavanaughsolutions.com

Additional information

http://www.cavanaughsolutions.com/bioenergy/

1-877-557-8923

gus.simmons@cavanaughsolutions.com

https://www.biocycle.net/2016/11/10/anaerobic-digest-67/

The authors are solely responsible for the content of these proceedings. The technical information does not necessarily reflect the official position of the sponsoring agencies or institutions represented by planning committee members, and inclusion and distribution herein does not constitute an endorsement of views expressed by the same. Printed materials included herein are not refereed publications. Citations should appear as follows. EXAMPLE: Authors. 2017. Title of presentation. Waste to Worth: Spreading Science and Solutions. Cary, NC. April 18-21, 2017. URL of this page. Accessed on: today’s date.

Microarthropods as Bioindicators of Soil Health Following Land Application of Swine Slurry


Proceedings Home W2W Home w2w17 logo

*Purpose 

As producers of livestock and agricultural crops continue to focus significant efforts on improving the environmental, economic, and social sustainability of their systems, increasing the utilization of livestock manure in cropping systems to offset inorganic fertilizer use benefits both sectors of agriculture. However, promoting manure based purely upon nutrient availability may not be sufficient to encourage use of organic versus inorganic fertilizer. The value of livestock manure could increase significantly with evidence of improved soil fertility and quality following manure application. Therefore, understanding the impact of manure addition and application method on both soil quality and biological health is an important step towards improving the value and desirability of manure for agricultural cropping systems.

For edaphic ecosystems, collection, analysis, and categorization of soil microarthropods has proven to be an inexpensive and easily quantified method of gathering information about the biological response to anthropogenic changes to the environment (Pankhurst et al., 1995; Parisi et al., 2005). Arthropods include insects, crustaceans, arachnids, and myriapods; nearly all soils are inhabited by a vast number of arthropod species. Agricultural soils may contain between 1,000 and 100,000 arthropods per square meter (Wallwork, 1976; Crossley et al., 1992; Ingham, 1999). Soil microarthropods show a strong degree of sensitivity to land management practices (Sapkota et al., 2012) and specific taxa are positively correlated with soil health (Parisi et al., 2005). These characteristics make soil microarthropods exceptional biological indicators of soil health.

This study focused on assessing the chemical and biological components of soil health, described in terms of soil arthropod population abundance and diversity, as impacted by swine slurry application method and time following slurry application.

What did we do? 

A field study was conducted near Lincoln, Nebraska from June 2014 through June 2015 on a site that has been operated under a no-till management system with no manure application since 1966. Experimental treatments included two manure application methods (broadcast and injected) and a control (no manure applied).

Soil samples were collected twelve days prior to treatment applications, one and three weeks post-application of manure, and every four weeks, thereafter, throughout the study period. Samples were not collected during winter months when soil was frozen.

Two types of soil samples were collected. Samples obtained with a 3.8-cm diameter soil probe were divided into 0-10 and 10-20 cm sections for each of the plots for nutrient analysis at a commercial laboratory. Samples measuring 20 cm in diameter and 20 cm in depth, yielding a soil volume of 6,280 cm3, were stored in plastic buckets with air holes in the lids, placed in coolers with ice packs, and transported to the University of Nebraska-Lincoln West Central Research & Extension Center in North Platte, Nebraska within 12 h of collection. These samples were then transferred to Berlese-Tullgren funnels for extraction of arthropods, a commonly used technique to assess microarthropods in the soil (Ducarme et al., 2002). A 70% ethanol solution was used to preserve the organisms for later analysis.

The QBS method of classification was employed to assign an eco-morphological index (EMI) score on the basis of soil adaptability level of each arthropod order or family (Parisi et al., 2005). Preserved arthropods from each soil sample were identified and quantified using a Leica EZ4 stereo microscope (Leica Biosystems, Inc., Buffalo Grove, IL) and a dichotomous key (Triplehorn and Johnson, 2004). Arthropods were classified to order or family based on the level of taxonomic resolution necessary to assign an EMI value as described by Parisi et al. (2005). For some groups, such as Coleoptera, characteristics of edaphic adaptation were used to assign individual EMI scores.

The impacts of swine slurry application method and time following manure application on soil arthropod populations and soil chemical characteristics was determined by performing tests of hypotheses for mixed model analysis of variance using the general linear model (GLM) procedure (SAS, 2015). The samples were tested for significant differences resulting from time and treatment, as well as for variations within the treatment samples. Following identification of any significant differences, the least significant differences (LSD) test was employed to identify specific differences among treatments. P <0.05 was considered statistically significant.

What have we learned? 

A total of 13,311 arthropods representing 19 orders were identified, with Acari (38.7% of total arthropods), Collembola: Isotomidae (26.8%), Collembola: Hypogastruridae (10.4%), Coleoptera larvae (1.6%), Diplura (1.2%), Diptera larvae (0.9%), and Pseudoscorpiones (0.6%) being the most abundant soil-dwelling taxa. These taxa had the greatest relative abundance in samples throughout the study and were, therefore, chosen for statistical analysis of their response to manure application method and time since application.

The most significant responses to application method were found for collembolan populations, specifically for Hypogastruridae and Isotomidae. However, Pseudoscorpiones were also significantly affected by application method. Time following slurry application had a significant impact on most of the analyzed populations including Hypogastruridae, Isotomidae, mites, coleopteran larvae, diplurans, and dipteran larvae. The positive response of Hypogastruridae and Isotomidae collembolans to broadcast swine slurry application was likely due to the addition of nutrients (in the form of OM and nitrates) to the soil provided by this form of agricultural fertilizer.

Future Plans   

Research focused on the role of livestock manure in cropping systems for improved soil quality and fertility is underway with additional soil characteristics being monitored under multiple land treatment practices with and without manure.

Corresponding author, title, and affiliation       

Dr. Amy Millmier Schmidt, Assistant Professor, University of Nebraska – Lincoln

Corresponding author email 

aschmidt@unl.edu

Other authors   

Nicole R. Schuster, Julie A. Peterson, John E. Gilley and Linda R. Schott

Additional information               

Dr. Amy Millmier Schmidt can also be reached at (402) 472-0877.

Dr. Julie Peterson, Assistant Professor of Entomology, University of Nebraska – Lincoln can be reached at (308) 696-6704 or Julie.Peterson@unl.edu.

Acknowledgements      

Eric Davis, Ethan Doyle, Mitchell Goedeken, Stuart Hoff, Kevan Reardon, and Lucas Snethen are gratefully acknowledged for their assistance with field data collection. Kayla Mollet, Ethan Doyle, and Ashley Schmit are acknowledged for their assistance with data processing. This research was funded, in part, by faculty research funds provided by the Agricultural Research Division within the University of Nebraska-Lincoln Institute of Agriculture and Natural Resources.


The authors are solely responsible for the content of these proceedings. The technical information does not necessarily reflect the official position of the sponsoring agencies or institutions represented by planning committee members, and inclusion and distribution herein does not constitute an endorsement of views expressed by the same. Printed materials included herein are not refereed publications. Citations should appear as follows. EXAMPLE: Authors. 2017. Title of presentation. Waste to Worth: Spreading Science and Solutions. Cary, NC. April 18-21, 2017. URL of this page. Accessed on: today’s date.

Field Technology & Water Quality Outreach

Proceedings Home | W2W Home waste to worth 2017 logo

Purpose

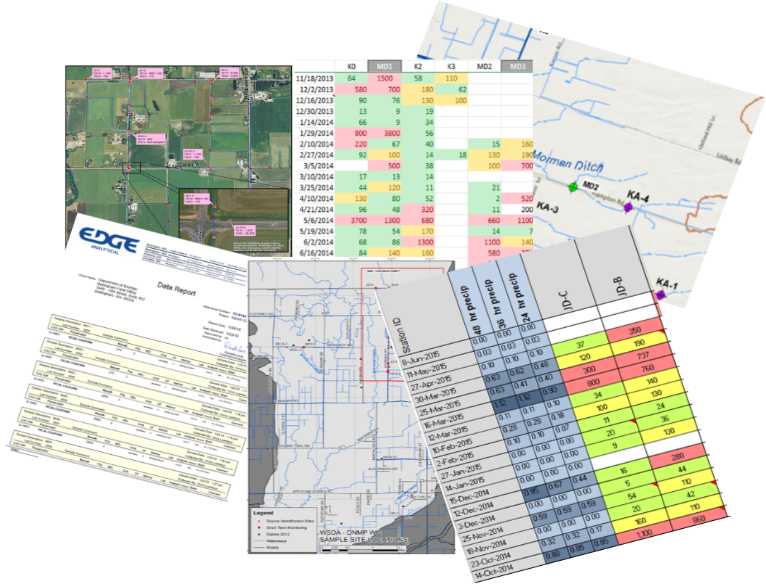
In 2015, Washington State Department of Agriculture (WSDA) partnered with local and state agencies to help identify potential sources of fecal coliform bacteria that were impacting shellfish beds in northwest Washington.  WSDA and Pollution Identification and Correction (PIC) program partners began collecting ambient, as well as rain-driven, source identification water samples. Large watersheds with multiple sub-basins, changing weather and field conditions, and recent nutrient applications, meant new sites were added almost daily. The increased sampling created an avalanche of new data. With this data, we needed to figure out how to share it in a way that was timely, clear and could motivate change. Picture of water quality data via spreadsheet, graphs, and maps.

Conveying complex water quality results to a broad audience can be challenging. Previously, water quality data would be shared with the public and partners through spreadsheets or graphs via email, meetings or quarterly updates. However, the data that was being shared was often too late or too overwhelming to link locations, weather or field conditions to water quality. Even though plenty of data was available, it was difficult for it to have meaningful context to the general public.

Ease of access to results can help inform landowners of hot spots near their home, it can link recent weather and their own land management practices with water quality, as well as inform and influence decision-making.

What Did We Do?

Using basic GIS tools we created an interactive map, to share recent water quality results. The map is available on smartphones, tablets and personal computers, displaying near-real-time results from multiple agencies.  Viewers can access the map 24 hours a day, 7 days a week.

We have noticed increPicture of basic GIS tool.ased engagement from our dairy producers, with many checking the results map regularly for updates. The map is symbolized with graduated stop light symbology, with poor water quality shown in red and good in green. If they see a red dot or “hot spot” in their neighborhood they may stop us on the street, send an email, or call with ideas or observations of what they believe may have influenced water quality. It has opened the door to conversations and partnerships in identifying and correcting possible influences from their farm.

The map also contains historic results data for each site, which can show changes in water quality. It allows the viewer to evaluate if the results are the norm or an anomaly. “Are high results after a rainfall event or when my animals are on that pasture?”

The online map has also increased engagement with our Canadian neighbors to the north. By collecting samples at the US/Canadian border we have been able to map streams where elevated bacteria levels come across the border. This has created an opportunity to partner with our Canadian counterparts to continue to identify and correct sources.

What Have We Learned?

You do not need to be a GIS professional to create an app like this for your organization. Learning the system and fine-tuning the web application can take some time, but it is well worth the investment. GIS skills derived from this project have proven invaluable as the app transfers to other areas of non-point work.  The web application has created great efficiencies in collaboration, allowing field staff to quickly evaluate water quality trends in order to spend their time where it is most needed. The application has also provided transparency to the public regarding our field work, demonstrating why we are sampling particular areas.

From producer surveys, we have learned that viewers prefer a one-stop portal for information. Viewers are less concerned about what agency collected the data as they are interested in what the data says. This includes recent, as well as historical water quality data, field observations; such as wildlife or livestock presence or other potential sources. Also, a brief weekly overview of conditions, observations and/or trends has been requested to provide additional context.

Future Plans

The ease and efficiency of the mobile mapping and data sharing has opened the door to other collaborative projects. Currently we are developing a “Nutrient Tracker” application that allows all PIC partners to easily update a map from the field. The map allows the user to log recent field applications of manure. Using polygons to draw the area on the field, staff can note the date nutrients were identified, type of application, proximity to surface water, if it was a low-, medium- or high-risk application, if follow-up is warranted, and what agency would be the lead contact. This is a helpful tool in learning how producers utilize nutrients, to refer properties of concern to the appropriate agency, and to evaluate recent water quality results against known applications.

Developing another outreach tool, WSDA is collecting 5 years of fall soil nitrate tests from all dairy fields in Washington State. The goal is to create a visual representation of soil data, to demonstrate to producers how nitrate levels on fields have changed from year to year, and to easily identify areas that need to be re-evaluated when making nutrient application decisions.

As part of a collaborative Pollution Identification and Correction (PIC) group, we would like to create a “Story Map” that details the current situation, why it is a concern, explain potential sources and what steps can be taken at an individual level to make a difference. A map that visually demonstrates where the watersheds are and how local neighborhoods really do connect to people 7 miles downstream.  An interactive map that not only shows sampling locations, but allows the viewer to drill down deeper for more information about the focus areas, such as pop-ups that explain what fecal coliform bacteria are and what factors can increase bacteria levels. We envision a multi-layer map that includes 24-hour rainfall, river rise, and shellfish bed closures. This interactive map will also share success stories as well as on-going efforts.

Author

Kerri Love, Dairy Nutrient Inspector, Dairy Nutrient Management Program, Washington State Department of Agriculture

klove@agr.wa.gov

Additional Information

Results Map Link: http://arcg.is/1Q9tF48

Washington Shellfish Initiative: http://www.governor.wa.gov/issues/issues/energy-environment/shellfish

Mobile Mapping Technology presentation by Michael Isensee, 2016 National CAFO Roundtable

Sharing the Data: Interactive Maps Provide Rapid Feedback on Recent Water Quality and Incite Change by Educating the Public, Kyrre Flege, Washington State Department of Agriculture and Jessica Kirkpatrick, Washington State Department of Ecology,  2016 National Non-Point Source Monitoring Workshop

Whatcom County PIC Program: http://www.whatcomcounty.us/1072/Water-Quality

Skagit County, Clean Samish Initiative: https://www.skagitcounty.net/Departments/PublicWorksCleanWater/cleansamish.htm

Lower Stillguamish PIC Program: http://snohomishcountywa.gov/3344/Lower-Stilly-PIC-Program

GIS Web Applications: http://doc.arcgis.com/en/web-appbuilder/

Acknowledgements

The web application was a collaborative project developed by Kyrre Flege, Washington State Department of Agriculture and Jessica Kirkpatrick, Washington State Department of Ecology.

The authors are solely responsible for the content of these proceedings. The technical information does not necessarily reflect the official position of the sponsoring agencies or institutions represented by planning committee members, and inclusion and distribution herein does not constitute an endorsement of views expressed by the same. Printed materials included herein are not refereed publications. Citations should appear as follows. EXAMPLE: Authors. 2017. Title of presentation. Waste to Worth: Spreading Science and Solutions. Cary, NC. April 18-21, 2017. URL of this page. Accessed on: today’s date.

Comprehensive Physiochemical Characterization of Poultry Litter: A First Step Towards Manure Management Plans in Argentina


Proceedings Home W2W Home w2w17 logo

Purpose 

For the last decade, Argentinian CAFO’s have been increasing in number and size. Poultry farming showed remarkable growth and brought to light the absence of litter and nutrient management plans. Land application of poultry litter is the most common practice, but there is insufficient data to support recommended agronomic rates of application.

In this study, we developed the first comprehensive physiochemical characterization of poultry litter to accurately state average nutrient concentrations and data variability to support development of future litter best management practices. Simultaneously, we estimated the crop fertilization potential of poultry litter in Entre Rios Province.

What did we do? 

Entre Rios Province contributes 51% of total Argentinian broiler production, holding over 2,600 chicken farms. Thus, the Ministry of Agriculture Industry contacted integrated broiler farmers, which all seemed to share a modern production protocol related to housing conditions, feed ration, and bedding management, and who were willing to participate in the sampling project. A sampling protocol was written following recognized literature sources (Zhang and Hamilton) and hands-on training sessions were developed with producers in charge of poultry litter sampling. A total of 55 broiler farms were sampled with 3 replicates per farm.

The following parameters were selected for analysis: organic matter, total nitrogen, ammoniacal nitrogen, organic nitrogen, phosphorus, potassium, calcium, magnesium, sodium, zinc, copper, electrical conductivity, pH and moisture content. Analytical procedures were stated with a certified local lab following recommended methods for manure analysis. A survey was also conducted at each sampling farm to assess variability on bedding age and material.

What have we learned? 

The average stocking density was 11.3 chickens/m2. The number of flocks grown on the litter before house cleaning ranged from 1 to 11 with an average of 4.7. However, 47.3% of the farms’ litter had less than 5 flocks while 52.7% presented 5 or more flocks. There was no significant correlation between the physiochemical parameters measured and bird density, nor with the number of flocks raised on the litter.

Table 1. Litter Type

Litter Type Farms (%)
Woodchips 50.91
Rice hulls 23.64
Woodchips + rice hulls 21.82
Peanut hulls  3.63

While total nitrogen (TN) and phosphorus means were comparable to normal values reported in U.S. literature (Britton and Bullard; Zhang et al.), the variability of data was significant. Table 2 shows a summary of the most relevant analytical results obtained.

Table 2. Physical and Chemical Average Litter Composition (Dry Basis). SEM*: Standard Error of the Mean

  Mean SEM* St. Deviation C.V. (%)
Organic matter (%) 79.13 0.62 4.61 5.82
Total nitrogen (%) 2.96 0.05 0.38 12.86
Phosphorus (%) 0.97 0.04 0.30 30.83
Sodium (%) 0.41 0.02 0.16 39.42
Electrical conductivity (mmhos/cm) 8.63 0.49 3.66 42.48
pH (I.U.) 7.56 0.04 0.31 4.07
Moisture content (%) 31.50 0.63 4.65 14.78

The coefficients of variation were especially high for phosphorus, sodium and electrical conductivity. This could be a critical factor governing poultry litter land application rates that promote neither phosphorus loss via surface runoff nor buildup of salts or sodium in the soil profile.

Raising over 359 million chickens annually, broiler litter value in Entre Rios Province would surpass 51 million dollars if it were fully used as commercial fertilizer substitute. Based upon the average nutrient content, 51,100 tons of nitrogen, 17,100 tons of phosphorus and 23,600 tons of potassium would be available; enough to fertilize 349,000 hectares of corn based upon crop nitrogen requirements whilst a plan based upon phosphorus would supply 629,000 hectares. Other critical factors like storage duration of litter outdoors, land application method, and the availability of litter nitrogen will impact the final calculation of plant available nitrogen (PAN), which is generally assumed to be 50% of TN when surface applied (Chastain et al.). Entre Rios farmers sow around 245,000 hectares of corn annually, hence 71% of the planted area could potentially be fully nitrogen fertilized using broiler litter instead of commercial fertilizer.

These results showed that while there is strong potential for litter land application at agronomic rates in Entre Rios, individual litter samples properly taken and analyzed are still needed to sustain environmentally sound nutrient management plans due to the large variability of the analytical results.

Future Plans    

The information presented will be utilized as input data for developing draft Broiler Farms’ Nutrient Management Plans that will serve as a model for other Argentinian CAFO. Currently, laboratory results from Buenos Aires Province hen farms are being analyzed.

Corresponding author, title, and affiliation        

Roberto Maisonnave, President at AmbientAgro – International Environmental Consulting

Corresponding author email   

robermaison@hotmail.com

Other authors   

Karina Lamelas, Director of Poultry and Swine Production at Ministry of Agriculture (Argentina). Gisela Mair, Ministry of Agriculture (Argentina). Norberto Rodriguez, Ministry of Agricultrue and University of Tres de Febrero (Argentina).

Additional information 

Britton, J. and G. Bullard. 1998 Summary of Poultry Litter Samples in Oklahoma. Oklahoma Cooperative Extension Service. CR-8214.

J. Chastain, J. Camberato and P. Skewes. Poultry manure production and nutrient content. Poultry Training Manual. Clemson University. http://www.clemson.edu/extension/camm/manuals/poultry_toc.html

Maisonnave, R.; Lamelas, K. y G. Mair. Buenas prácticas de manejo y utilización de cama de pollo y guano. Ministerio de Agroindustria de la Nación Argentina. 2016.

Zhang, H. and D. Hamilton. Sampling animal manure. Oklahoma Cooperative Extension Service. PSS-2248.

Zhang, H.; Hamilton, D. and J. Payne. Using Poultry Litter as Fertilizer. Oklahoma Cooperative Extension Service. PSS-2246.

Acknowledgements       

Dr. Jorge Dillon and Ing. José Noriega (SENASA)

Ing. Agr. Juan Martin Gange and Lic. Corina Bernigaud (INTA)

Ing. Agr. Alan Nielsen and M. Vet. Juan Nehuén Rossi (Granja Tres Arroyos)

Lic. Pablo Marsó (Las Camelias)

Sra. Nancy Dotto (Soychú)

Recommendations for Manure Injection and Incorporation Technologies for Phase 6 Chesapeake Bay Watershed Model


Proceedings Home W2W Home w2w17 logo

Purpose

A Best Management Practice (BMP) Expert Panel was convened under guidance of the Chesapeake Bay Program’s (CBP) Water Quality Goal Implementation Team to assess and quantify Nitrogen and Phosphorus load reductions for use in the Phase 6 Chesapeake Bay Watershed Model when manure is injected or incorporated into agricultural lands within the watershed. (Further description of Expert Panels and processes can be found in the 2017 Waste to Worth Proceedings and Presentation by Jeremy Hanson and Mark Dubin).

What Did We Do?

The Expert Panel first created definitions of injection and incorporation practices, which allowed technologies utilized in research to be categorized within each definition. Categorization considered the manner in which manure was placed beneath the soil surface as well as the level of surface disturbance. Manure injection was defined as a specialized category of placement in which organic nutrient sources (including manures, biosolids, and composted materials) are mechanically applied into the root zone with surface soil closure at the time of application with soil surface disturbance of 30% or less. Manure incorporation was defined as the mixing of dry, semi-dry, or liquid organic nutrient sources (including manures, biosolids, and compost) into the soil profile within a specified time period from application by a range of field operations (≤24hr for full ammonia loss reduction credit and 3 days for P reduction credit(s)). Incorporation was divided into categories of high disturbance (<30% residue retention) and low disturbance (>30% residue retention). Both liquid and solid manures were considered.

The panel conducted an extensive literature review of research that allowed comparison of nutrient loss after manure injection and incorporation with a baseline of surface manure application without incorporation. These comparisons were assembled in a large categorical table in percentage form, that reflected loss reduction efficiency. Many manuscripts offered a percentage comparison of application treatments to the surface application baseline. For research reports that did not provide a percentage comparison, the panel interpreted results into a percentage comparison when possible.

Consideration to soil variability and location in the Chesapeake Bay Watershed was considered on a very broad basis and in a manner consistent with work of other panels and modeling team recommendations. Loss reduction efficiencies were provided for soils or locations listed as either Coastal or Upland regions. Nitrogen efficiencies did not vary between the regions, but Phosphorus efficiencies did.

What Have We Learned?

Nitrogen and Phosphorus loss reduction efficiency reported or derived from literature varied within categories. For some categories, the volume of literature was small. Research providing these efficiencies is often conducted on small plots with simulated rainfall. Literary reduction results were often provided as a range and not as a single value. Professional scrutiny and judgment was applied to each value provided from literature and to all values within injection and incorporation categories to determine loss reduction efficiencies to be used in the broad categories of the model. The final loss reduction efficiencies of the Expert Panel’s final report are provided in Tables 1 (Upland Region) and 2 (Coastal Region).

Table 1. Loss reduction efficiency values for Upland regions of the Chesapeake Bay Watershed.


Category

Nitrogen

Phosphorus

Time to Incorporation

Ammonia Emission Reduction

Reduction in N Loading1

Time to Incorporation

Reduction in P Loading2

Injection

0

85%

12%

0

36%

Low Disturbance Incorporation

≤24 hr

24-72 hr

50%

34%


8%

8%

≤72 hr


24%

High Disturbance Incorporation

≤24 hr

24-72 hr

75%

50%


8%

8%

≤72 hr


0%3

1 Reduction in N loading water achieved only for losses with surface runoff. The portion of total N loss through leaching is not impacted by the practices.  25% of total N losses to water are assumed to be lost with runoff (both dissolved N and sediment-associated organic matter N).

2 Reduction in P loading water achieved only for losses with surface runoff. The portion of total N loss through leaching is not impacted by the practices.  80% of total P losses to water are assumed to be lost with runoff (both dissolved  and sediment-bound P) in upland regions of the watershed.

3 Reduction in dissolved P losses typically offset by greater sediment-bound P losses due to greater soil erosion with tillage incorporation in upland landscapes.


Table 2. Loss reduction efficiency values for Coastal Plain region of the Chesapeake Bay Watershed.


Category

Nitrogen

Phosphorus

Time to Incorporation

Ammonia Emission Reduction

Reduction in N Loading1

Time to Incorporation

Reduction in P Loading2

Injection

0

85%

12%

12%

0

22%

Low Disturbance Incorporation

≤24 hr

24-72 hr

50%

34%


8%

8%

≤72 hr


14%

High Disturbance Incorporation

≤24 hr

24-72 hr

75%

50%


8%

8%

≤72 hr


14%

1 Reduction in N loading water achieved only for losses with surface runoff. The portion of total N loss through leaching is not impacted by the practices.  25% of total N losses to water are assumed to be lost with runoff (both dissolved N and sediment-associated organic matter N).

2 Reduction in P loading water achieved only for losses with surface runoff. The portion of total N loss through leaching is not impacted by the practices.  48% of total P losses to water are assumed to be lost with runoff (both dissolved and sediment-bound P) in Coastal Plain.

Future Plans

The report of the Manure Injection and Incorporation Panel were accepted by the Chesapeake Bay Program’s Agricultural Workgroup in December 2016. The values will be utilized in Phase 6 of the Chesapeake Bay Watershed Model. Future panels may revisit the efficiencies as future model improvements are made.

Corresponding author (name, title, affiliation) 

Robert Meinen, Senior Extension Associate, Penn State University

Corresponding author email address  

rjm134@psu.edu

Other Authors 

Curt Dell (Panel Chair), Soil Scientist, USDA-Agricultural Research Service

Art Allen, Associate Professor and Associate Research Director, University of Maryland – Eastern Shore

Dan Dostie, Pennsylvania State Resources Conservationist, USDA-Natural Resources Conservation Service

Mark Dubin, Agricultural Technical Coordinator, Chesapeake Bay Program Office, University of Maryland

Lindsey Gordon, Water Quality Goal Implementation Team Staffer, Chesapeake Research Consortium

Rory Maguire, Professor and Extension Specialist, Virginia Tech

Don Meals, Environmental Consultant, Tetra Tech

Chris Brosch, Delaware Department of Agriculture

Jeff Sweeney, Integrated Analysis Coordinator, US EPA

For More Information

Two related presentations given at the same session at Waste to Worth 2017

Acknowledgements

Funding for this panel was provided by the US EPA Chesapeake Bay Program and Virginia Tech University through an EPA Grant.

The authors are solely responsible for the content of these proceedings. The technical information does not necessarily reflect the official position of the sponsoring agencies or institutions represented by planning committee members, and inclusion and distribution herein does not constitute an endorsement of views expressed by the same. Printed materials included herein are not refereed publications. Citations should appear as follows. EXAMPLE: Authors. 2017. Title of presentation. Waste to Worth: Spreading Science and Solutions. Cary, NC. April 18-21, 2017. URL of this page. Accessed on: today’s date.

Manure Management Technology Selection Guidance

Proceedings Home W2W Home w2w17 logo

Purpose

Manure is an inevitable by-product of livestock production. Traditionally, manure has been land applied for the nutrient value in crop production and improved soil quality.With livestock operations getting larger and, in many cases, concentrating in certain areas of the country, it is becoming more difficult to balance manure applications to plant uptake needs. In many places, this imbalance has led to over-application of nutrients with increased potential for surface water, ground water and air quality impairments. No two livestock operations are identical and manure management technologies are generally quite expensive, so it is important to choose the right technology for a specific livestock operation. Information is provided to assist planners and landowners in selecting the right technology to appropriately address the associated manure management concerns.

What did we do?

As with developing a good conservation plan, knowledge of manure management technologies can help landowners and operators best address resource concerns related to animal manure management. There are so many things to consider when looking at selecting various manure treatment technologies to make sure that it will function properly within an operation. From a technology standpoint, users must understand the different applications related to physical, chemical, and biological unit processes which can greatly assist an operator in choosing the most appropriate technology. By having a good understanding of the advantages and disadvantages of these technologies, better decisions can be made to address the manure-related resource concerns and help landowners:

• Install conservation practices to address and avoid soil erosion, water and air quality issues.

• In the use of innovative technologies that will reduce excess manure volume and nutrients and provide value-added products.

• In the use of cover crops and rotational cropping systems to uptake nutrients at a rate more closely related to those from applied animal manures.

• In the use of local manure to provide nutrients for locally grown crops and, when possible, discourage the importation of externally produced feed products.

• When excess manure can no longer be applied to local land, to select options that make feasible the transport of manure nutrients to regions where nutrients are needed.

• Better understand the benefits and limitations of the various manure management technologies.

Picture of holding tank

Complete-Mix Anaerobic Digester – option to reduce odors and pathogens; potential energy production

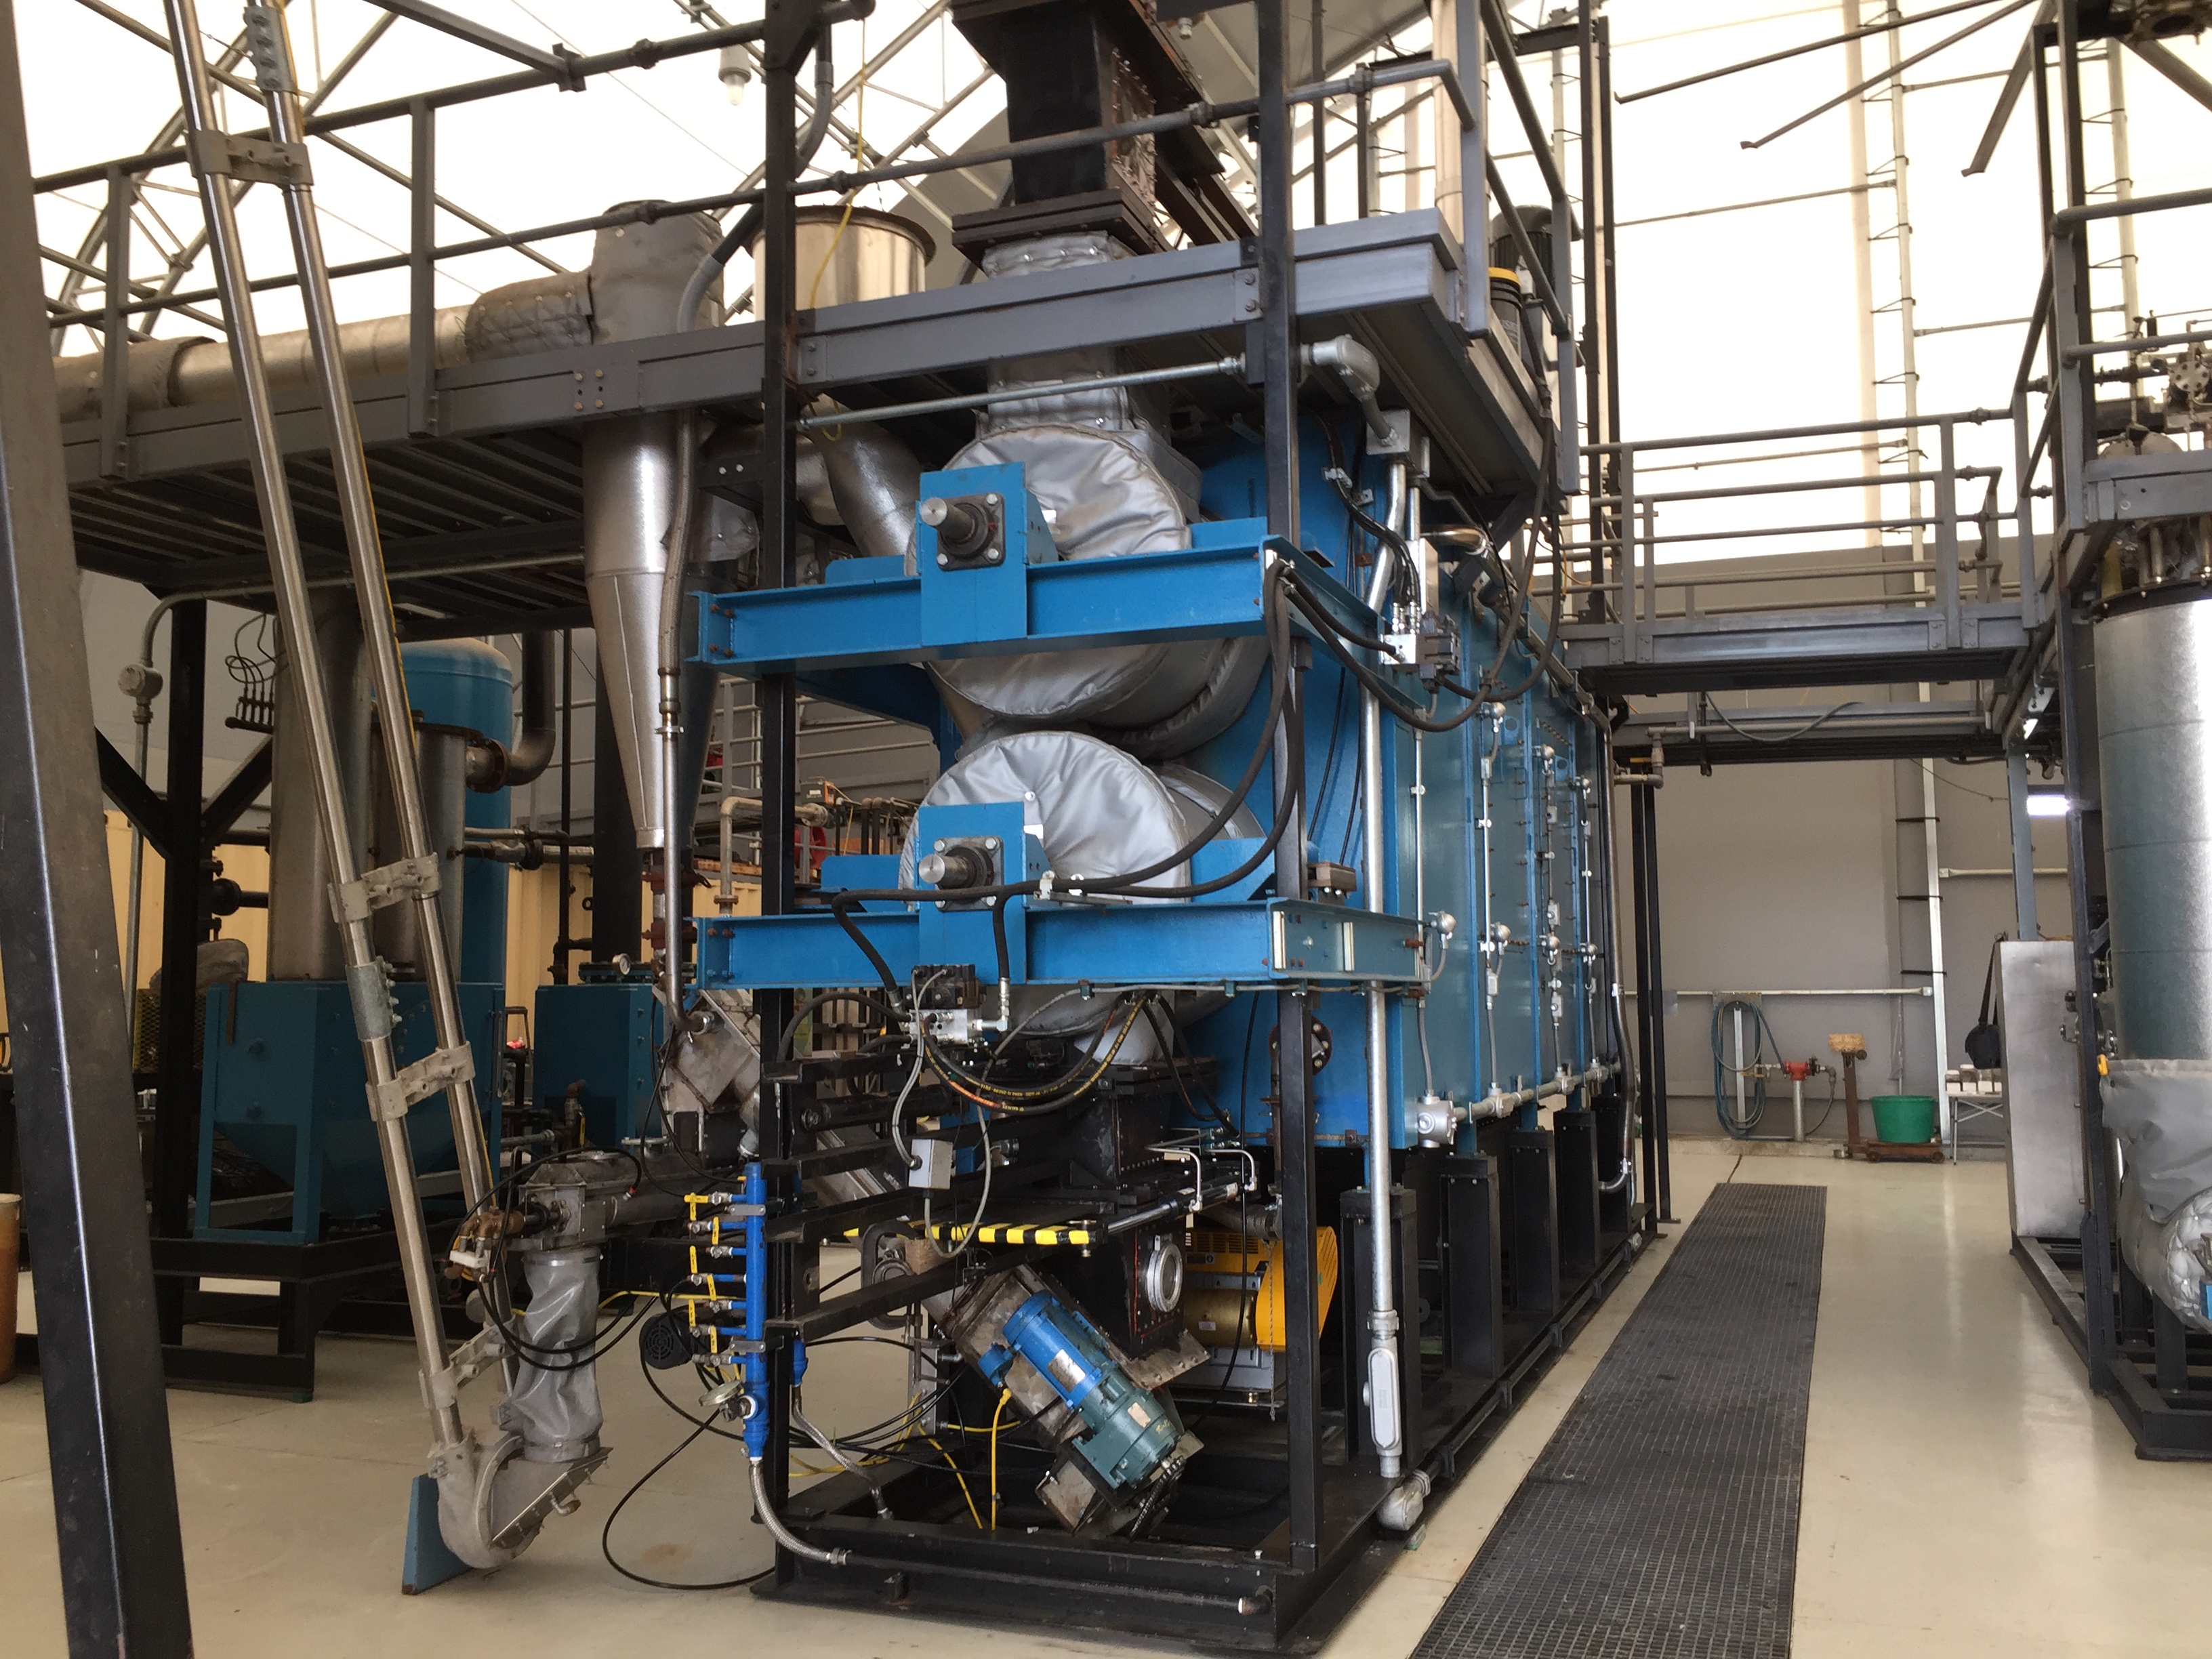
Picture of mechanical equipment

Gasification (pyrolysis) system – for reduced odors; pathogen destruction; volume reduction; potential energy production.

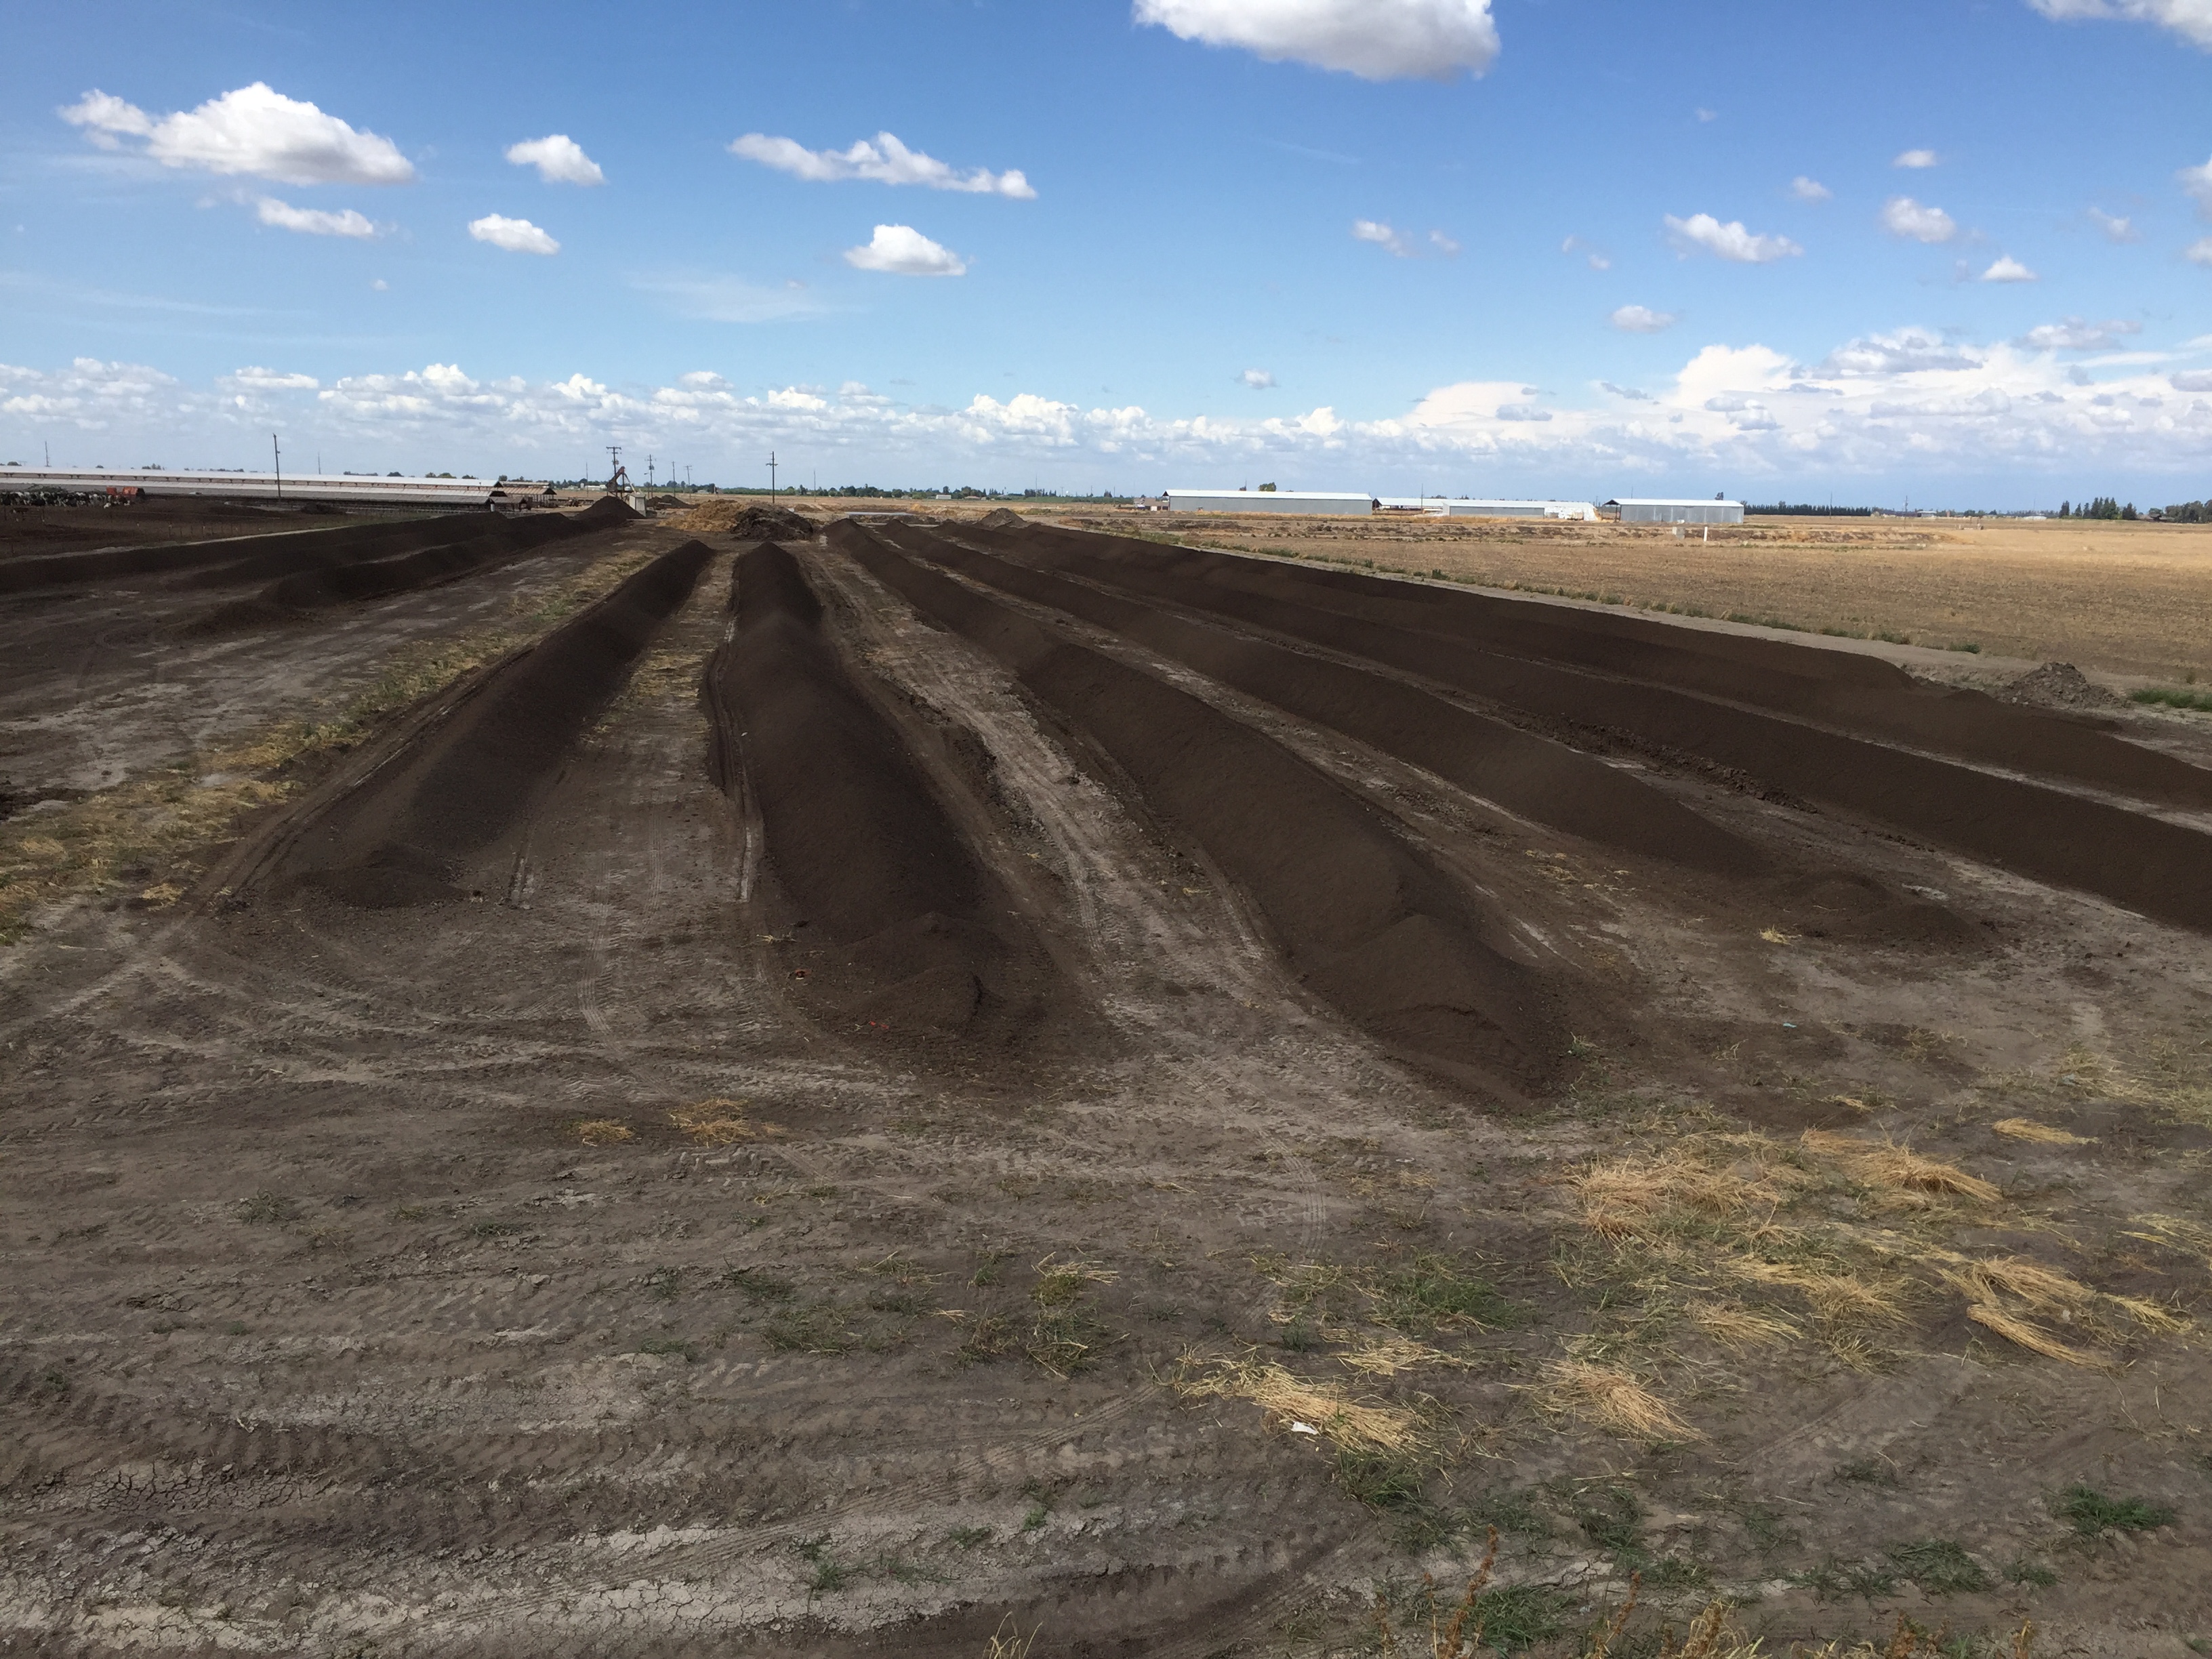
Picture of field

Windrow composting – reduce pathogens; volume reduction

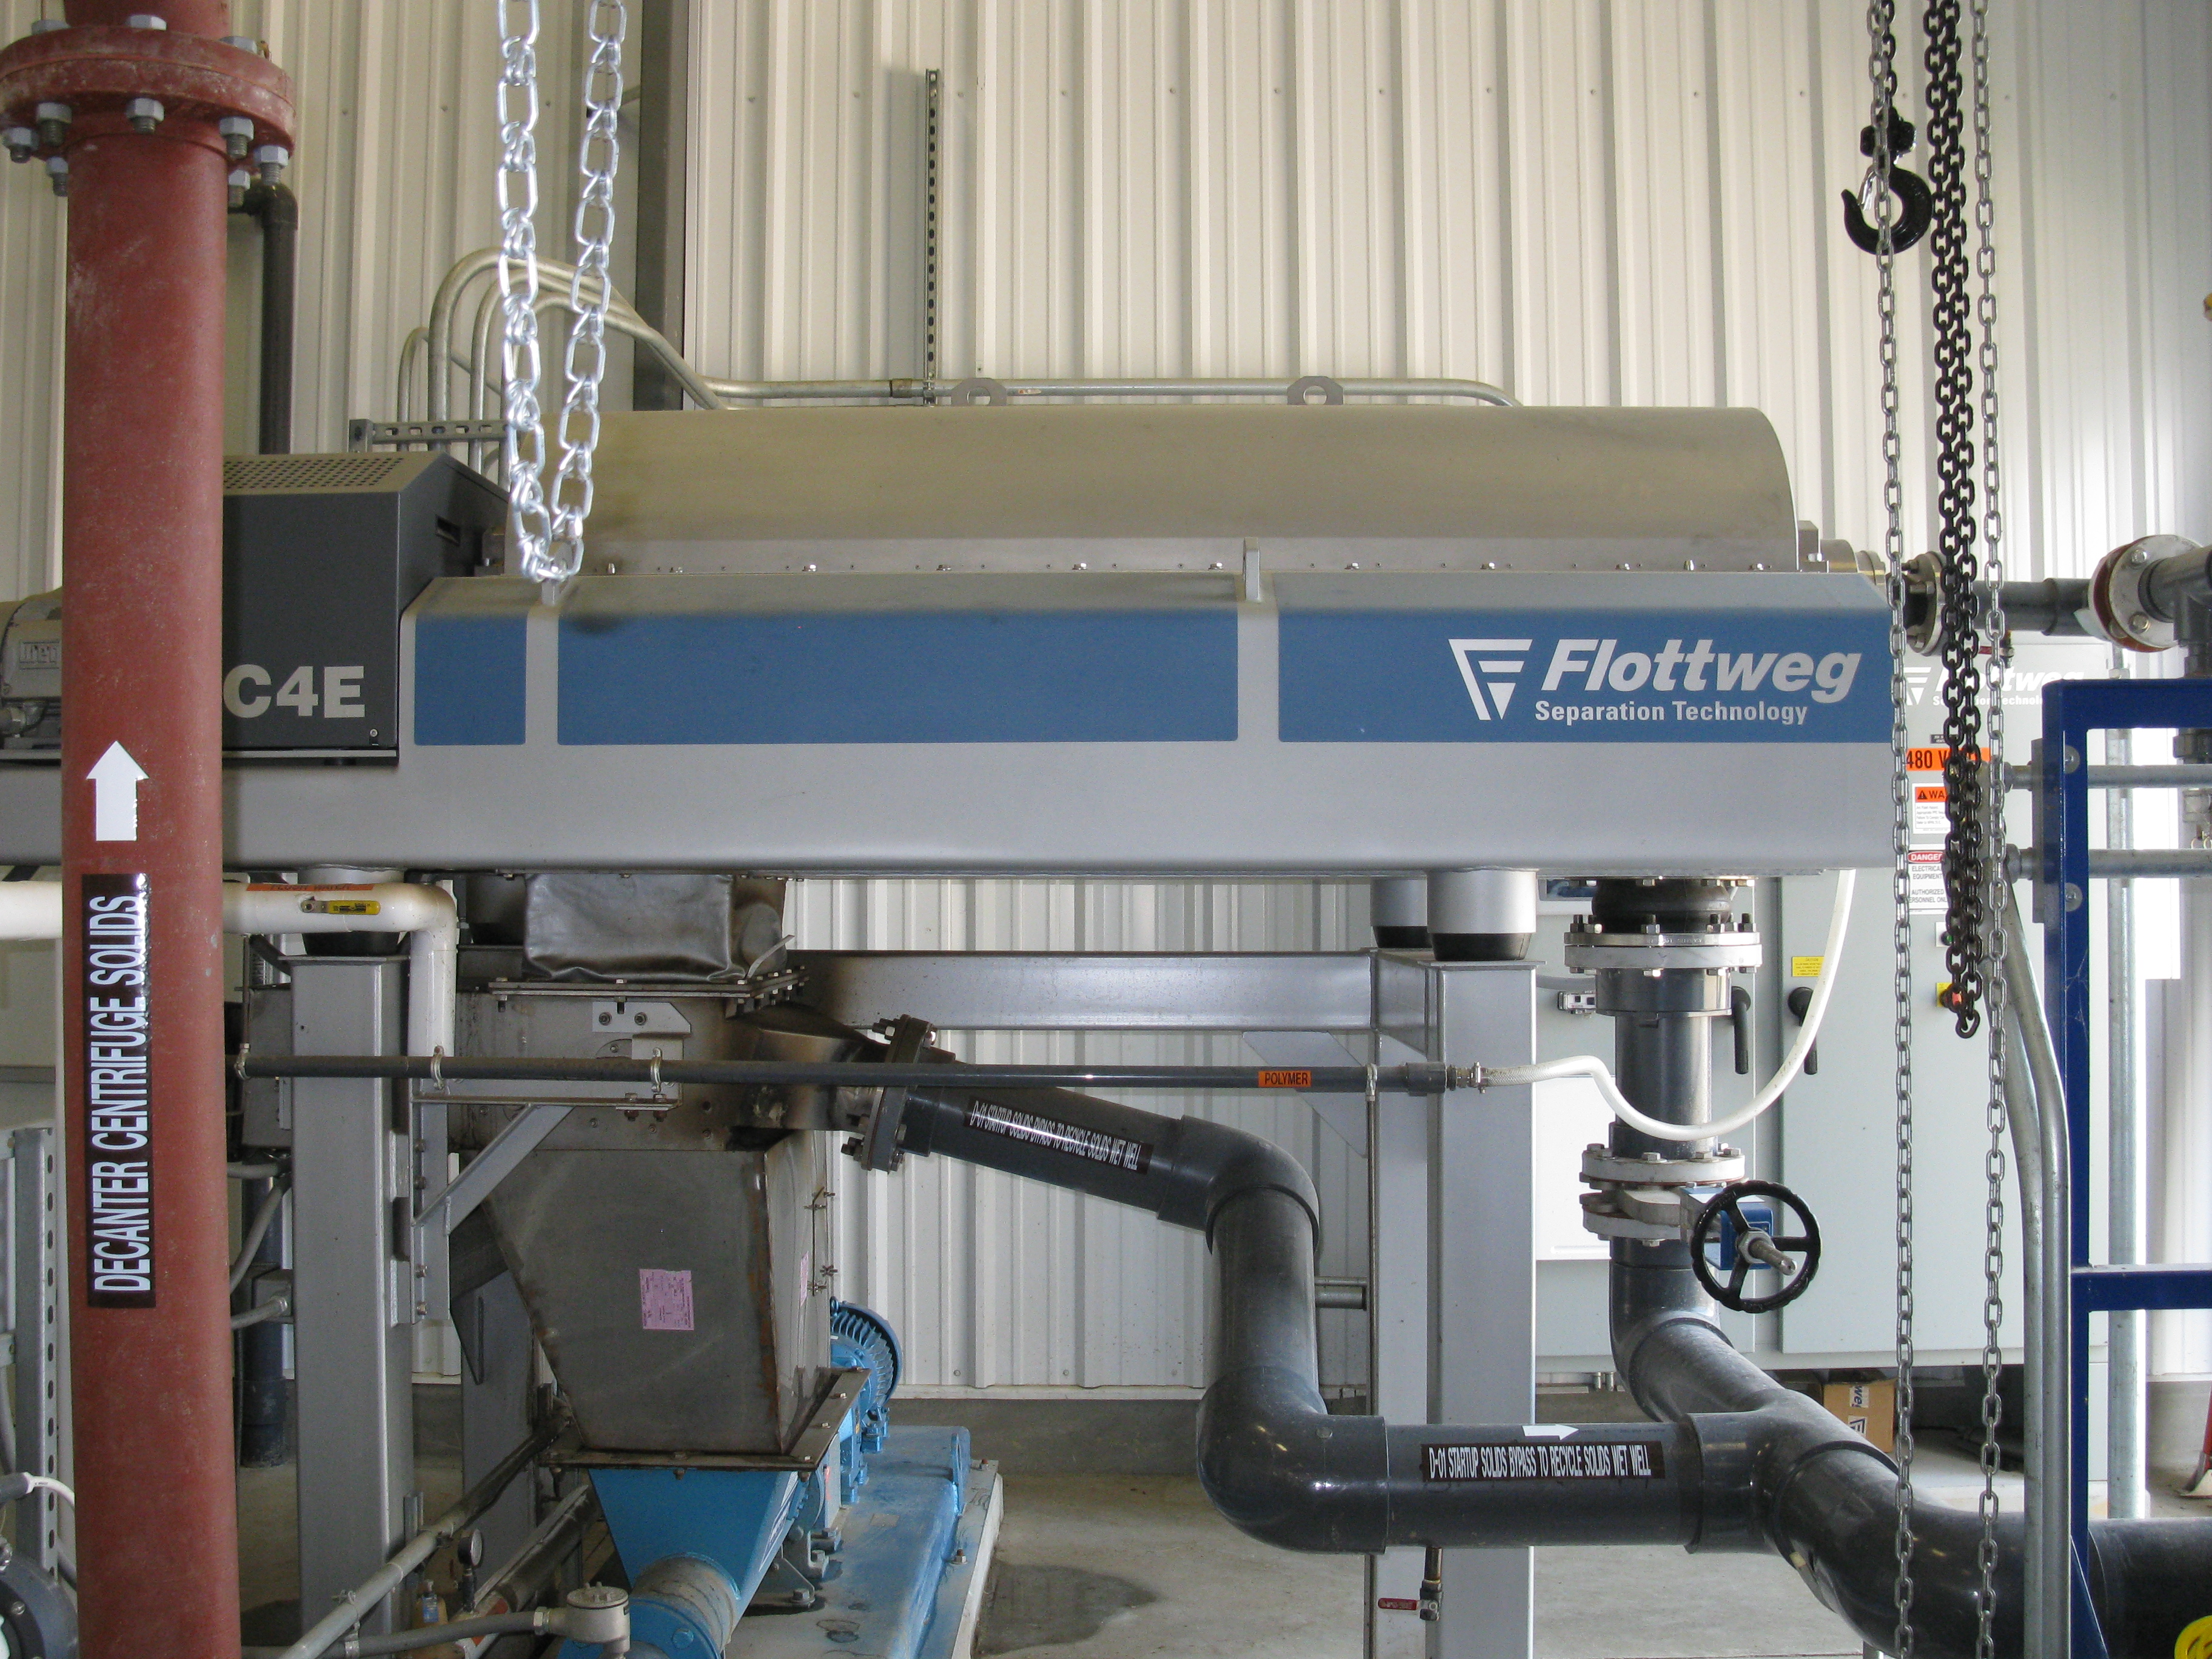
Picture of Flottweg separation technology

Centrifuge separation system – multiple material streams; potential nutrient
partitioning.

What have we learned?

• There are several options for addressing manure distribution and application management issues. There is no silver bullet.

• Each livestock operation will need to be evaluated separately, because there is no single alternative which will address all manure management issues and concerns.

• Option selections are dependent on a number of factors such as: landowner objectives, manure consistency, land availability, nutrient loads, and available markets.

• Several alternatives may need to be combined to meet the desired outcome.

• Soil erosion, water and air quality concerns also need to be addressed when dealing with manure management issues.

• Most options require significant financial investment.

Future Plans

Work with technology providers and others to further evaluate technologies and update information as necessary. Incorporate findings into NRCS handbooks and fact sheets for use by staff and landowners in selecting the best technology for particular livestock operations.

Corresponding author, title, and affiliation

Jeffrey P. Porter, P.E.; National Animal Manure and Nutrient Management Team Leader USDA-Natural Resources Conservation Service

Corresponding author email

jeffrey.porter@gnb.usda.gov

Other authors

Darren Hickman, P.E., National Geospatial Center of Excellence Director USDA-Natural Resources Conservation Service; John Davis, National Nutrient Management Specialist USDA-Natural Resources Conservation Service, retired

Additional information

References

USDA-NRCS Handbooks – Title 210, Part 651 – Agricultural Waste Management Field Handbook

USDA-NRCS Handbooks – Title 210, Part 637 – Environmental Engineering, Chapter 4 – Solid-liquid Separation Alternatives for Manure Handling and Treatment (soon to be published)

Webinars

Evaluation of Manure Management Systems – http://www.conservationwebinars.net/webinars/evaluation-of-manure-management-systems/?searchterm=animal waste

Use of Solid-Liquid Separation Alternatives for Manure Handling and Treatment – http://www.conservationwebinars.net/webinars/use-of-solid-liquid-separation-alternatives-for-manure-handling-and-treatment/?searchterm=animal waste

The authors are solely responsible for the content of these proceedings. The technical information does not necessarily reflect the official position of the sponsoring agencies or institutions represented by planning committee members, and inclusion and distribution herein does not constitute an endorsement of views expressed by the same. Printed materials included herein are not refereed publications. Citations should appear as follows. EXAMPLE: Authors. 2017. Title of presentation. Waste to Worth: Spreading Science and Solutions. Cary, NC. April 18-21, 2017. URL of this page. Accessed on: today’s date.

An Economical Method to Install Industrial Wastewater Storage Pond Liners


Proceedings Home W2W Home w2w17 logo

Purpose 

Over the past four decades, the number of custom slaughterhouses in Michigan has steadily decreased as the number of livestock producers declined. Those who remain are growing larger as they capitalize on the buy local food craze by providing fresh USDA-approved boxed meats at a meat counter or by adding value to the meats by further processing (i.e., sausages, hams, etc.). All slaughterhouses in the State are regulated by the Michigan Department of Environmental Quality (MDEQ) who issues permits for the proper disposal of the process wastewater for those operations that are not connected to a municipal sewer.

Typical disposal of the process wastewater involves removal of the solids through septic tank filtration and screens followed by storage of the process wastewater in ponds for eventual disposal on crop ground at agronomic rates. Facilities operating in this manner are issued a Groundwater Discharge Permit from MDEQ. However, because the state classifies slaughterhouses as an industry, the storage ponds require double liners and must meet a hydraulic conductivity of 1 x 10⁻⁷ centimeters/second.

A process wastewater storage pond is being designed for a slaughterhouse located in Coopersville, Michigan. The existing process wastewater holding pond is not sufficient to hold process water generated at the facility due to the recent expansions in slaughterhouse operations. Therefore, modifications to the existing holding pond and construction of a new holding pond to accommodate the process water generated is underway. The construction of the ponds is scheduled for spring 2017.

This paper evaluates the applicability, economic feasibility compared to geomembrane liners and constructability of pond liners using AquaBlok.

AquaBlok is a man-made clay pellet material that handles like gravel and is placed in varying thicknesses depending on the desired hydraulic conductivity and then hydrated to create a low permeable liner. Advertised as a “composite particle system” each AquaBlok particle contains an individual piece of limestone as its core. When a continuous layer of individual particles is applied, the clay (i.e., a high-quality sodium bentonite coating) surrounding each stone hydrates, swells, and binds together to produce a low-permeable earthen liner when introduced to a water environment.

What did we do? 

Based on the current operations and future growth forecast, the slaughterhouse requires a pond(s) with total holding capacity of approximately 1.6 million gallons of process wastewater. This accounts for process wastewater generated in total of eight (8) months period. Soil borings were taken at the site and soil samples were collected to determine geotechnical parameters including hydraulic conductivity. Total of eight (8) soil borings were advanced to an approximate depth of fifty (50) feet below ground surface. Based on the laboratory testing results, the hydraulic conductivity of the native clay did not meet the MDEQ’s minimum 1 x 10⁻⁷ cm/s requirement. These results indicate a need for a composite liner for the existing pond as well as the new pond. Two candidate liner materials are being evaluated. They are 1) clay liner that is constructed of AquaBlok and 2) geomembrane liner. Geomembrane are commonly being used for wastewater! holding ponds. AquaBlok is not being frequently used as liners for holding ponds. However, once constructed appropriately, this material would provide a liner with hydraulic conductivity of less than 1 x 10⁻⁸ cm/s and appropriate shear and compressive strength. Currently, the economic feasibility of the two methods is being evaluated. Also, the constructability of the AqaBlok liners is being investigated. The ponds are scheduled to be constructed in Spring 2017.

What have we learned? 

The evaluation of AquaBlok as a liner material for process wastewater holding ponds is being evaluated. The construction of the ponds is scheduled for Spring 2017. This material has promising geotechnical parameters and can provide a liner with a very low permeability once constructed appropriately. A detailed discussion of the material evaluation, liner construction methodology, economic analysis, and regulatory compliance will be presented during the oral presentation.

Use of a geotextile liner is an approved method to construct industrial wastewater storage ponds in Michigan but cost and liner installer availability is typically a detriment to fast installations.

Future Plans    

Due to a plant expansion, the design drawings and application to expand the process wastewater pond capacity and to meet the state requirements for minimum liner permeability are currently in review by the state MDEQ. Construction of the new storage pond is planned for spring 2017 pending MDEQ review and approval.

Corresponding author, title, and affiliation        

Matthew J. Germane, PE, Senior Project Engineer at Environmental Resources Group, LLC

Corresponding author email    

Matt.Germane@ERGrp.net

Other authors   

Mala Hettiarachchi, Ph.D, PE, Senior Engineer at Environmental Resources Group, LLC

Additional information                

Additional information on Michigan’s rules for liner construction of industrial wastewater is available at:

http://www.michigan.gov/documents/deq/wb-groundwater-P22GuidshtIV_248171_7.pdf

Acknowledgements       

The authors wish to acknowledge DeVries Meats, Inc., in Coopersville, MI and their owner, Ken DeVries, whose site the design work and cost evaluations were completed for.

Nutrient Recovery Membrane Technology: Best Applications and Role in Conservation

Proceedings Home | W2W Home w2w17 logo

Purpose

Animal manure contains nutrients and organic matter that is valuable to crop producers if it can be efficiently applied to nearby fields, however this can be a significant source of environmental contamination if managed incorrectly. In most cases, concentrated animal production facilities are rarely close to sufficient cropland to fully utilize these resources and management becomes a disposal issue rather than a utilization opportunity. The goal of this work is to design and test a pilot-scale system to implement a hydrophobic, gas permeable, expanded polytetraflouroethylene (ePTFE) membrane (U.S. patent held by USDA) to recover ammonia from swine wastewater in a solution of sulfuric acid. The pilot-scale system results are described elsewhere; the purpose of this presentation is to explore the best applications for this and other recovery technologies in animal feeding operations.

What did we do?

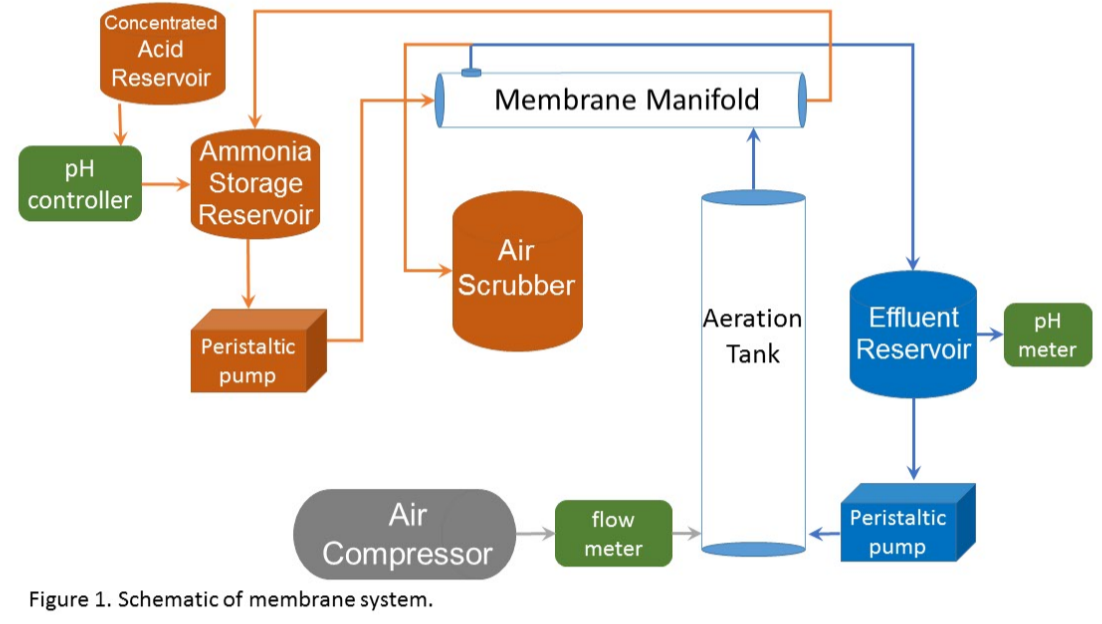
The reactor test (figure 1) system consisted of 19 membrane tubes (ID of 0.16 in, wall thickness of 0.023 in) within a 2.01 in diameter, 24.7 in long reactor giving a membrane density of 3.83 in2 in-3 of reactor. Wastewater first passed through a CO2 stripping column (4.016 in diameter, 55 in length) where a small air stream (0.0614 ft 3 min-1) stripped CO2 from the wastewater and raised the pH one full unit, shifting the equilibrium to NH3 and enhancing transport across the membrane. Batch tests (0.706 ft3) were run for 9-12 days with wastewater recirculating at a rate of 0.16 gal min-1. The recovery fluid inside the tubular membranes was a 0.01 N sulfuric acid solution with the pH automatically maintained below 4.0 standard units and recirculating at a rate of 1/100th the wastewater flowrate. Freshly collected settled wastewater and anaerobic digester effluent were tested to determine the mass of ammonia collected, the acid required to main! tain the low pH of the recovery solution and potential ammonia losses to the atmosphere.

Figure 1. Schematic of membrane system

What have we learned?

The batch volumes of the two sources contained about the same mass of nitrogen (35.6 g in freshly collected settled wastewater and 33.2 g in digester effluent) but the higher fraction of ammonia in digester effluent resulted in greater recovery (77% vs. 33%).

Future Plans

The best use of this and other recovery technologies cannot be determined by simply comparing the cost of installation and operation with the price of the recovered product. The question of where and how to implement such recovery technologies requires knowledge of the value added by each process and further needs an understanding of how various practices interact and contribute to a sustainable system. Process interactions will suggest one step come before another because of the characteristics produced by one and needed by the other. Anaerobic digestion effluent has different characteristics than the output of a hydrothermal process. As seen in the membrane results, freshly collected liquid waste has a different ammonia : organic nitrogen ratio than digester effluent. Source separated manure solids have high levels of organic phosphorus but digester effluent has high concentrations of dissolved phosphate.

Product recovery is only the beginning of the valuation process; as an industry and as a society, we value conservation for other reasons. We do not yet have a well-accepted way to quantify that value. The avoided cost of nitrogen removal from surface waters is a good start to estimate the value of keeping nitrogen out of drainage and runoff but what is the quantified value of preserving the ecosystem services that excess nitrogen disrupts? The cost of recovered phosphorus may be high relative the current price of virgin phosphate from ore but the value of that recovery process includes the avoided problems in rivers, lakes, and estuaries caused by excess nutrients. The fertilizer value of recovered ammonia that was prevented from escaping to the atmosphere may be small compared to the avoided cost of particulate pollution and the associated health problems.

In addition to improved operation of the membrane reactor system, at least three things are needed to fully realize the value of resource recovery:

1. Cost-effective dewater processes. Rejecting inert water can reduce the capital and/or operating cost of almost all waste management processes;

2. Process to quantify the value of ecosystem services and avoided costs of recovery;

3. Cooperation of and investment from major stakeholders in the form of research funding as well as collaboration regarding processes and feed stocks for fertilizer and feed formulations. Animal production companies have historically been involved but fertilizer companies, feed mill operators, animal nutritionists and others must also be involved.

Corresponding author, title, and affiliation

John J. Classen, Associate professor, Biological and Agricultural Engineering, NC State University

Corresponding author email

john_classen@ncsu.edu

Other authors

J. Mark Rice, Extension Specialist, Biological and Agricultural Engineering, NC State University, Kelly Zering, Professor and Extension Specialist, Agricultural and Resource Economics, NC State University

Additional information

John J. Classen

Biological and Agricultural Engineering

Campus Box 7625

North Carolina State University

919-515-6755

Acknowledgements

This project was supported by NRCS CIG Award 69-3A75-12-183. The authors are grateful for the analytical work of the BAE Environmental Analysis Laboratory, Dr. Cong Tu, manager.

The authors are solely responsible for the content of these proceedings. The technical information does not necessarily reflect the official position of the sponsoring agencies or institutions represented by planning committee members, and inclusion and distribution herein does not constitute an endorsement of views expressed by the same. Printed materials included herein are not refereed publications. Citations should appear as follows. EXAMPLE: Authors. 2017. Title of presentation. Waste to Worth: Spreading Science and Solutions. Cary, NC. April 18-21, 2017. URL of this page. Accessed on: today’s date.