Can Solid and Liquid Manure Fractions Be Treated to Enhance Nutrient Management?
An important consideration of liquid manure solids separation is the fate and economic value of the resulting liquid and solids fractions. The desired properties of the separated fractions, operator preferences, regulatory considerations, and economics should determine the type and degree of treatment.
Research has shown that treatment with aluminum, iron, and calcium chemicals can concentrate phosphorus and manure solids into a lower moisture manure product. This research focuses on calcium to enhance phosphorous and solids precipitation. Concepts leading to this research were: creating calcium phosphorus compounds with liming and phosphorus fertilizer soil amendment value; retaining nitrogen for on farm use; enhancing/maintaining manure market value to offset treatment/transportation costs; reducing phosphate extraction from global mineral reserves; and investigating the impacts on energy and bio-char production from manure solids.
This research treated liquid swine manure with hydrated lime [Ca(OH)2] and agricultural lime [CaCO3]. The hydrated lime was added as both a liquid slurry and as a dry powder. The agricultural lime was added as dry granules. The 3 calcium sources were added to the manure at 3 treatment levels with 3 replicates. A non-treatment control for each chemical source and additional final non-treatment control were also processed. The resulting 31 mixtures were sampled prior to separation via filter bags. After separation, the filter bag contents and the leachate were also sampled. The filter bags and leachate were then stored under ambient conditions but protected from precipitation for 10 days before being sampled again.
The analysis of all 155 samples included % solids, TKN, NH4-N, NO3-N, P, WEP, K, and Ca. This manuscript presents an analysis of the results of the analytical tests performed. An associated provides an assessment of the separated solids as a feed stock for thermo energy conversion and bio-char production.
Author
VanDevender, Karl kvan@uaex.edu Univ of Ark, Div of Ag, Extension, BAEG
The authors are solely responsible for the content of these proceedings. The technical information does not necessarily reflect the official position of the sponsoring agencies or institutions represented by planning committee members, and inclusion and distribution herein does not constitute an endorsement of views expressed by the same. Printed materials included herein are not refereed publications. Citations should appear as follows. EXAMPLE: Authors. 2015. Title of presentation. Waste to Worth: Spreading Science and Solutions. Seattle, WA. March 31-April 3, 2015. URL of this page. Accessed on: today’s date.
There is major interest from producers and the public in implementing best control technologies that would abate ammonia (NH3) emissions from confined livestock and poultry operations by capturing and recovering the nitrogen (NH3-N).
What did we do?
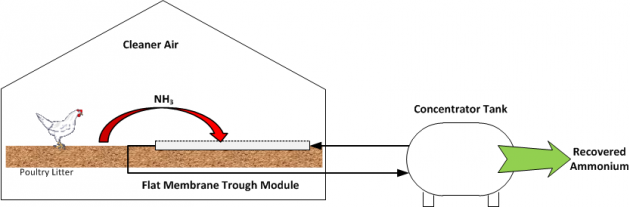
In this study, we continued investigating development of gas-permeable membrane modules as components of new processes to capture and recover gaseous ammonia inside poultry houses, composting facilities, and other livestock installations. The overall research objective was to improve poultry houses with the introduction of nitrogen emission capture technology. There were two milestones during the initial phase of the study: 1) to test ammonia recovery with gas-permeable membranes in a bench system using Maryland’s poultry manure; and 2) to construct and install a pilot ammonia recovery system at the UMES Poultry Research facility.
Figure 1. System for the recovery of gaseous ammonia from poultry waste using gas-permeable membrane module.
What have we learned?
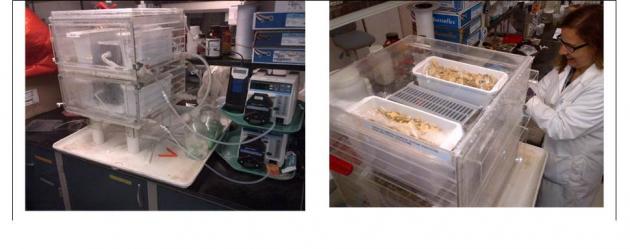
The prototype ammonia recovery bench system using gas-permeable modules was moved from ARS-Florence to ARS-BARC in Sept. 2013 and tested during three consecutives runs using turkey and chicken manure mixes. The bench unit had two chambers: one was used with recirculating acid solution (1 N H2SO4) and the other was a control that used recirculating water. The control, which used water as the capture solution, was very effective at recovering the ammonia. This finding may lead to more economical ammonia recovery systems in the future.
Figure 2. Prototype ammonia recovery system using gas-permeable modules.
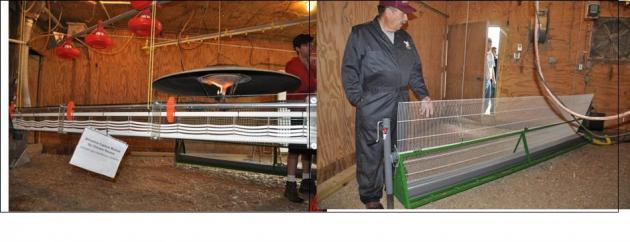
Two pilot ammonia recovery systems using gas-permeable membranes were constructed at ARS-Florence and installed at the UMES poultry research facility in June 2014. One ammonia recovery module was developed using flat membranes mounted on troughs. The other module was developed using tubular gas-permeable membranes. The recovery manifolds were placed inside the experimental barns (400 chickens) hanging from the roof and close to the litter. Both systems were installed with the ammonia concentrator tanks outside the barns. They were tested continuously for four months without chickens in the barns. The first flock of birds was placed in the facility Feb. 2015 and also in a control facility without the ammonia recovery modules. The installed modules will demonstrate the ammonia recovery and the potential poultry production benefits from cleaner air.
Figure 3. Pilot ammonia recovery systems installed in a chicken barn at UMES Poultry Research Facility. At left is a recovery module that uses tubular gas-permeable membranes. At right is a recovery module that uses flat gas-permeable membranes.
Future plans?
The N recovery modules are being demonstrated at the University of Maryland Eastern Shore’s Poultry Research facility.
1USDA-ARS Coastal Plains Soil Water and Plant Research Center, Florence, SC, USA
2USDA-ARS Environmental Microbial and Food Safety, Beltsville, MD, USA
3University of Valladolid, School of Agric. Engineering, Palencia, Spain
4University of Maryland Eastern Shore, Dept. of Agriculture, Food and Resource Sciences, Princess Anne, MD, USA
Additional information
Szogi, A.A., Vanotti, M.B., and Rothrock, M.J. 2014. Gaseous ammonia removal system. US Patent 8,906,332 B2, issued Dec. 9, 2014. US Patent and Trademark Office, Washington, DC.
Rothrock Jr, M.J., Szogi, A.A., Vanotti, M.B. 2013. Recovery of ammonia from poultry litter using flat gas permeable membranes. J. of Waste Management. 33:1531-1538
We acknowledge NIFA Project “Novel Integration of Solar Heating with Electricity Generation Technology and Biofiltered Poultry Litter Biofertilizer Production System” and ARS Project 6657-13630-001-00D “Innovative Animal Manure Treatment Technologies for Enhanced Environmental Quality”. Funding by University of Valladolid/Banco Santander for participation of Dr. Sanchez Bascones as Visiting Scientist is also acknowledged.
The authors are solely responsible for the content of these proceedings. The technical information does not necessarily reflect the official position of the sponsoring agencies or institutions represented by planning committee members, and inclusion and distribution herein does not constitute an endorsement of views expressed by the same. Printed materials included herein are not refereed publications. Citations should appear as follows. EXAMPLE: Authors. 2015. Title of presentation. Waste to Worth: Spreading Science and Solutions. Seattle, WA. March 31-April 3, 2015. URL of this page. Accessed on: today’s date.
While anaerobic digestion is often touted for producing renewable energy/fuels, producers at concentrated animal feeding operations (CAFOs) are often most concerned about nutrient loading, an issue that has garnered increasing regulatory scrutiny. Anaerobic digestion, while a carbon management tool capable of producing carbon fuels, does little in regard to nitrogen and phosphorus management. Thus digestion projects, if they are to meet producer needs, must incorporate downstream separation to recover nutrients and protect soils. This presentation highlights the key environmental issues and hurdles facing manure management and disposal and lays the framework for a needed focus on combined anaerobic digestion and nutrient recovery systems capable of meeting producer and regulatory needs regarding nutrient management.
Why Review Nutrient Recovery Technologies for Anaerobic Digestion?
A literature review and conversations with dairy farmers both suggest that improving manure nutrient management is a major concern for dairy producers. This supports the conclusion that ongoing research and development efforts to support development of nutrient recovery technologies, including those that can be used in concert with anaerobic digestion (AD), will be key to enhancing adoption rates for AD technology.
What did we do?
A literature review was used to support and enhance findings from conversations with farmers about anaerobic digestion technologies.
What have we learned?
Managing manure is major consideration for dairy producers, and one that comes with high potential costs in areas where there are few crop producers willing to accept manure (USDA ERS 2009). Dairies in many regions of the U.S. are facing increased pressure from growing public concern about nutrient-related water and air quality issues. In some cases, regulation of dairies has increased.
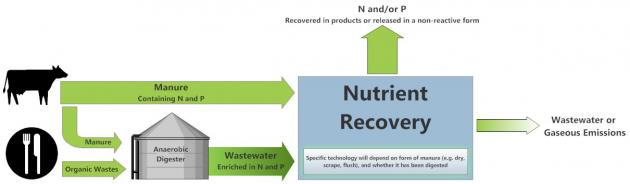
As a result, there is increased interest from dairy producers and others in nutrient recovery technologies. Although no technologies are widely commercialized at present, several emerging nitrogen and phosphorus recovery technologies exist. Some of these technologies are most appropriately used on specific forms of untreated dairy manure (e.g. scrape, flush), while others are more appropriate when combined with AD as part of an AD system (Figure 1).
Figure 1. Nutrient recovery fact sheet diagram
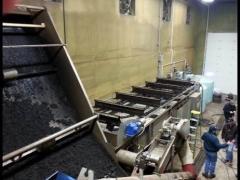
Figure 2. Overhead view of a nutrient recovery system for nitrogen and phosphorus.
Approaches also vary in that some recover both phosphorus and nitrogen (Figure 2), while others focus on only one nutrient (Figure 3). Some nutrient recovery processes dispose of these nutrients in form that is non-reactive, and therefore not problematic environmentally. However, most nutrient recovery technologies produce concentrated nutrient products that can be transported more easily, and economically, than manure. The most promising technologies also make products with characteristics (e.g. homogenous and predictable nutrient content, easy to handle, reduced pathogen counts or pathogen-inert chemicals) that make them more appealing to crop producers than manure.
Figure 3. Commercial scale recovery of phosphorus.
With further technological and market development, these technologies have the potential to transform dairy manure nutrient management. They may also become a cost-effective approach to improving nutrient management at a watershed level, through the replacement of imported chemical nutrients by crop-farms with manure-derived nutrients already in the watershed. However, nutrients can still be lost from nutrient recovery products or from the wastewater that normally is a by-product of nutrient recovery. This is especially true if these are applied with improper application rates or timing. Nutrient recovery technologies therefore need to be used as part of a comprehensive watershed-level strategy that addresses nutrient balance, equitable distribution of costs and benefits, and improved nutrient application timing and methodology.
Nutrient recovery could also encourage adoption of anaerobic digestion technologies. Although anaerobic digestion changes the form of nitrogen and phosphorus in manure, it does not appreciably decrease the total amount of nutrients, most of which are concentrated in the liquid effluent that is a product of the AD process (Frear et al. 2012). Also, co-digestion of dairy manure with additional organic food wastes can import nutrients to the farm, exacerbating existing nutrient management issues. Nutrient recovery can make AD more appealing to dairy producers by addressing one of their most important concerns. Meanwhile, potential income from the sale of recovered nutrients can contribute to the economic feasibility of an AD project.
Future Plans
The authors and collaborators are continuing efforts to review existing information about nutrient recovery systems (see talk by Jingwei Ma et al., Nutrient Recovery Technologies—A Primer on Available and Emerging Nitrogen, Phosphorus, and Salt Recovery Approaches, their Performance and Cost). They are also continuing technological development and commercialization efforts for specific nutrient recovery technologies.
Authors
Georgine Yorgey, Research Associate at Center for Sustaining Agriculture and Natural Resources, Washington State University yorgey@wsu.edu
Craig Frear, Assistant Professor in the Department of Biological Systems Engineering, Washington State University, and Chad Kruger, Director, Center for Sustaining Agriculture and Natural Resources, Washington State University
Frear, C., W. Liao, T. Ewing, and S. Chen. 2012. Evaluation of Co-digestion at a Commercial Dairy Anaerobic Digester. Clean Water, Air, and Soil, 39 (7): 697-704.
USDA-ERS. 2009. Manure Use for Fertilizer and for Energy. Report to Congress. United States Economic Research Service. Washington, DC.
Acknowledgements
This work was supported by funding from USDA National Institute of Food and Agriculture, Contract #2012-6800219814; National Resources Conservation Service, Conservation Innovation Grants #69-3A75-10-152; and Biomass Research Funds from the WSU Agricultural Research Center.
The authors are solely responsible for the content of these proceedings. The technical information does not necessarily reflect the official position of the sponsoring agencies or institutions represented by planning committee members, and inclusion and distribution herein does not constitute an endorsement of views expressed by the same. Printed materials included herein are not refereed publications. Citations should appear as follows. EXAMPLE: Authors. 2015. Title of presentation. Waste to Worth: Spreading Science and Solutions. Seattle, WA. March 31-April 3, 2015. URL of this page. Accessed on: today’s date.
Significant efforts are required to abate NH3 emissions from livestock operations. In addition, the costs of fertilizers have rapidly increased in recent years, especially nitrogen fertilizer such as anhydrous ammonia which is made from natural gas. Thus, new technologies for abatement of ammonia emissions in livestock operations are being focussed on N recovery. This presentation shows a novel system that uses gas-permeable membranes to capture and recover ammonia from liquid manure, reducing ammonia emissions from livestock operations, and recovering concentrated liquid nitrogen that could be sold as fertilizer.
What Did We Do?
Nitrogen recovery from swine manure was investigated using a new technology that uses gas-permeable membranes at low pressure. The new process includes the passage of gaseous ammonia contained in the liquid manure through a microporous hydrophobic membrane and capture and concentrate with circulating diluted acid on the other side of the membrane. The membranes can be assembled in modules or manifolds. Membrane manifolds are submerged in the manure and the ammonia is removed from the liquid before it escapes into the air. The process involves manure pH control to increase ammonium recovery rate that is normally carried out using an alkali chemical. In this study a new strategy was tested to avoid the use of alkali chemicals. Instead of the chemical, we applied low-rate aeration and nitrification inhibitor to raise the pH and promote ammonia capture by the membrane system.
Figure 1. Diagram of ammonia recovery system using with gas permeable membranes and low-rate aeration
What Did We Learn?
Two studies were conducted to recover N from liquid swine manures containing high ammonia concentrations using a USDA patented gas-permeable membrane system. One study used raw liquid manure from the pit under slatted floor of a farrowing sow’s barn in Segovia, Spain. The second study used liquid swine manure effluent from a covered lagoon digester in North Carolina, USA. The new strategy that used low-rate aeration and nitrification inhibition worked quite well in both situations. In the first study using raw manure, the pH increased and the ammonium concentration was almost depleted: it declined from 2270 mg N/L to 20 mg N/ in 18 days. The ammonia that was removed was recovered efficiently in the concentrator tank (99% recovery efficiency). Using the same membrane manifold without the aeration protocol, the ammonium concentration in the manure decreased at a slower rate from 2330 mg N/L to 790 mg N/L in 18 days. The results obtained were consistent in the second study that used digested swine effluent. When low-rate aeration and nitrification inhibitor were added to the gas-permeable membrane reactor, ammonium concentration in the digester effluent decreased rapidly, from 3130 mg N/L to 96 mg N/L, in 5 days. The recovery efficiency was 98%. This N removal rate was 5 times faster than a control that used the same membrane reactor and conditions but operated without the aeration protocol. Overall results obtained in this work indicate the low-rate aeration is an economical alternative to chemical addition to increase ammonia availability and the capture of ammonia by gas-permeable membrane systems. This conclusion is supported by the very high removal and recovery efficiencies obtained resulting in an overall recovery of 95 to 98% of the initial ammonia in the manure.
Future Plans
On-farm demonstration studies will be conducted in 2015 in cooperation with Dr. John Classen, North Carolina State University, through an NRCS Conservation Innovation Grant (CIG) “Ammonia recovery from swine wastewater with selective membrane technology”. A mobile pilot unit will demonstrate recovery of ammonia from liquid manure effluents using the gas-permeable technology in three different manure collection systems: under floor belt system, scraper system, and anaerobic digester.
USDA seeks a commercial partner to develop and market this invention (Systems and Methods for Reducing Ammonia Emissions form Liquid Effluents and for Recovering Ammonia. US Patent Appl. SN 13/164,363 allowed Dec. 19, 2014) http://www.ars.usda.gov/business/docs.htm?docid=763&page=5
Vanotti,M.B., Szogi,A.A. “Systems and Methods for Reducing Ammonia Emissions form Liquid Effluents and for Recovering Ammonia”. US Patent Appl. SN 13/164,363, filed June 20, 2011, allowed December 19, 2014. US Patent and Trademark Office, Washington, DC.
Garcia-Gonzalez, M.C., Vanotti, M.B., Szogi, A.A. 2015. “Recovery of ammonia from swine manure using gas-permeable membranes: Effect of aeration”. Journal of Environmental Management 152:19-26
Acknowledgements
This research was part of USDA-ARS National Program 214 Agricultural and Industrial Byproducts, Research Project 6657-13630-005-00D “Innovative Bioresource Management Technologies for Enhanced Environmental Quality and Value optimization”. Funding by INIA/FEDER Project CC09-072 is gratefully acknowledged.
The authors are solely responsible for the content of these proceedings. The technical information does not necessarily reflect the official position of the sponsoring agencies or institutions represented by planning committee members, and inclusion and distribution herein does not constitute an endorsement of views expressed by the same. Printed materials included herein are not refereed publications. Citations should appear as follows. EXAMPLE: Authors. 2015. Title of presentation. Waste to Worth: Spreading Science and Solutions. Seattle, WA. March 31-April 3, 2015. URL of this page. Accessed on: today’s date.
Pasture is a good source of nutrition and 94% of U.S. equine operations allow horses to access pastures [8]. Proper management of equine operations requires the adoption of Best Management Practices (BMPs) to balance nutrient production and prevent erosion. Government agencies are concerned about non-point sources of water pollution and have focused on agriculture, including equine operations, as a major contributor to water quality issues. Many states’ laws have regulated equine farms, requiring farm managers to incorporate BMPs. Best Management Practice utilization on horse farms needs to be quantified before regulations are adopted. The objectives of these various states’ surveys were to quantify and assess the use of the equine industry’s BMPs in pasture management and erosion control and to examine potential environmental impacts. The object of this abstract is to compare and look for some similarities in the ways horse farms are managed to mitigate negative environmental impacts. Few studies have investigated horse BMPs in the regions. More research is needed to assess the effect of horse farm management on the nation’s water quality.
What did we do?
Over the past five years, state university extension equine specialist participating on the NE-1441: Environmental Impacts of Equine Operations, multi-state project, have conducted surveys of their state equine industry. Many of the state surveys were conducted to quantify and assess the use of the equine industry’s BMPs in pasture management and erosion control and to examine potential environmental impacts.
In all cases a written survey instrument was developed and the questions were reviewed by experts in the field for content and face validity. Some of the surveys used the multiple waves, (postage) mailing techniques, while some used online survey mailings, and others used an SRS clicker feedback style quiz during a program or event [1,3,7,10]. Several states developed a large list of names and email addresses consisting of horse owners/farm managers from within their state. All used follow-up reminders sent to non-responding addresses to increase return rates. All of the state’s surveys analyzed the data for descriptive statistics. Frequencies and percentages were determined for all surveys. Cross tabulations were used to determine the relationship between management practices and farm management demographics. There is difficulty in comparing the different surveys because they are all different in methodology and in the way they were conducted and analyzed.
What have we learned?
Size and scope of the equine industry-
The New Jersey equine industry consists of 7,200 horse farms with 29% having 8 or more horses. In NJ more than 50% of the farms had 5 or fewer horses and 56% of the farms had 4.05 hectors (10 ac) or less and 18.6% had more than 8.09 ha. [10] The Maryland Equine Industry consists of 87,000 horses located on 20,200 operations, averaging 11.6 ha of pasture [3]. The Pennsylvania study averaged housing 13.4 horses on 21 ha (52.7 ac) of pasture and has 32,000 operations [7]. The Tennessee study reported the average herd size of 5, with 25.6 ac designated for pasture [6]. Forty-two percent of Vermont’s horse operation house over 9 horses on 25 ac of land.
Methods horse farms used to manage pasture quality-
Results of a Pennsylvania horse farm survey showed, that during the growing season, as many as 65% reported using a rotational pasture system and 25% continuously grazing horses [7]. A Maryland survey found that only 30% of horse farm operators used rotational grazing on their farms [3]. In a Tennessee survey, continuous grazing was practiced by 51.5% of respondents. Only 23.8% of TN respondents allowed pasture to recover to a recommended grazing height and 45.3% reported sometimes resting pastures [6]. The New Jersey survey reported 54% practicing some form of rotational grazing [9]. A study conducted on farms in Minnesota and Wisconsin revealed farms had an average stocking density of 1.75 acres per horse [1]. Designated sacrifice lots were present on 84% of farms, while the average ground cover was 88% in NJ [10]. The PA study, reported 23.8% allowed pasture to recover to a recommended grazing height and 45.3% reported sometimes resting pastures. Most respondents, 75.4% assessed their pasture vegetative cover at 80% or better, and 5% reported poor vegetative cover [7].
Methods horse farms used to manage soil and weeds-
Pasture weed problems were reported to be a major issue by 78.1% of TN owners. Half of TN farm operators (49.8%) indicated they have never performed soil fertility tests [6]. While in NJ, 31% of horse farms indicated they soil test [10]. PA horse farm operators (49.8%) indicated they have never performed soil fertility tests on their pastures, with only 25.4% testing soil every 1-3 yrs [7]. In the NJ survey 89% reported mowing pastures [10].
Methods horse farms used to manage manure-
The PA survey reported that farms composting and using compost on the farm (34.1%), hauled off the farm fresh (10.9%), spread fresh on crop/pasture fields daily (10.6%), composted and hauled off farm (7.7%), horses pastured 24 hr/d with manure harrowed or removed (16.4%), horses pastured 24 hr/d with manure never managed (7.1%) [7]. New Jersey farms, 54% indicated they spread manure on their farmland, and 74% indicated that they have a designated area for storing manure. NJ farm with greater pasture acreage were positively correlated with having manure storage [10]. The TN survey, reported, that stall waste was stored on bare ground in uncovered piles (89.8%) and either stored indefinitely or spread regularly on pastures [6].
How do farm managers receive/obtain information-
Several studies showed, horse managers are receiving most of their educational information from publications, magazine articles and the internet [7]. Therefore, Extension needs to reach horse farm managers with what we do best, factsheets, popular press articles and meetings. In the PA survey, resources participants used for information included books, magazines, publications (79.4%), internet resources (79.1%), acquaintances (65%), agencies (60.5%), multi-media (27.8%), private businesses (15.7%), and 2% reported using none. Participants indicated that the primary limitation to them altering current management practices was finances (75%), knowledge (37.5%), regulations (13.7), and an inability to obtain services (11.7%) [7].
In a South Dakota study, 29% of participants indicated that their primary need for information was regarding horse pasture management and 12% wanted to figure out how to increase grazing for horses as a primary goal. Many new SD landowners were present at an Extension event with 38% having owned their acreage for less than 3 years, and only 19% had owned their acreages for more than 10 years [5].
Future Plans
Knowledge of the current scope and nature of equine industry management practices are important when developing regulations and laws that will govern land management on equine operations. Recently, several state environmental regulations are having a direct impact on equine operations. However, horse farms frequently manage horses on fewer acres per animal unit and have the potential to pose a significant environmental risk. A NJ study reported that the rate of spreading manure decreased on farms with over 20 horses [10].
Most states surveys data shows that many horse farms are utilizing BMPs to help reduce environmental impact. However, many of these studies determined that landowners of small acreages have little knowledge of natural resources management [2,5,7]. There are several areas, such as soil testing and the use of sacrifice loafing areas in pasture management, where educational programming and cost share funding are needed to target specific BMPs underutilized by the equine industry. Nearly all survey respondents reported having some pasture and nutrient management questions [2,5,7,10].
In order to help stable managers understand the principles of sustainable best management practices, Cooperative Extension can conduct state-wide “Environmental Stewardship Short Courses.” These educational programs need to be a comprehensive series of educational programs (face-to-face meeting or webinars) to promote adoption of best management practices on equine operations. In addition, what is really needed is a comparative surveys instrument that can be used nation-wide to quantify and assess the use of the equine industry’s BMPs on horse farms.
Authors
Ann Swinker, Extension Horse Specialist, Pennsylvania State University aswinker@psu.edu
Betsy Greene, Extension Equine Specialist, University of Vermont
Amy Burk, Extension Horse Specialist, University of Maryland
Rebecca Bott, Extension Equine Specialist, South Dakota State University
Bridget McIntosh, Extension Equine Specialist, Virginia
Additional information
Earing J, Allen E, Shaeffer CC, Lamb JA, Martinson KL. Best Management Practices on Horse Farms in Minnesota and Wisconsin. J Anim. Sci. 2012; 90:52.
Fiorellino, N., McGrath , J., Momen, B., Kariuki, S., Calkins, M., Burk, A., 2014. Use of Best Management Practices and Pasture and Soil Quality on Maryland Horse Farms, J. Eq. Vet. Sci. 34:2, 257-264.
Fiorellino, N.M., K.M. Wilson, and A.O. Burk. 2013. Characterizing the use of environmentally friendly pasture management practices by horse farm operators in Maryland. J. Soil Water Conserv. 68:34-40.
Henning J, Lacefield G, Rasnake M, Burris R, Johns J, et al. Rotational grazing. University of Kentucky, Cooperative Extension Service 2000; (IS-143).
Hubert, M., Bott, R.C., Gates, R.N., Nester, P.L., May 2013. Development and Branding of Educational Programs to Meet the Needs of Small Acreage Owners in South Dakota, J. of NACAA. 6:1, 2158-9429.
McIntosh, B. and S. Hawkins, Trends in Equine Farm Management and Conservation Practices ASAS, Phoenix, AZ. 2/13/12.
Swinker, A., S. Worobey, H. McKernan, R. Meinen, D. Kniffen, D. Foulk, M. Hall, J. Weld, F. Schneider, A. Burk, M. Brubaker, 2013, Profile of the Equine Industry’s Environmental, Best Management Practices and Variations in Pennsylvania, J. of NACAA. 6:1, 2158-9429.
USDA: Aphis” VS, (1998). National Animal Health System, Highlights of Equine: part III, p. 4.
Westendorf, M. L., T. Joshua, S. J. Komar, C. Williams, and R. Govindasamy. 2010. Manure Management Practices on New Jersey Equine Farms. Prof. Anim. Sci. 26:123-129.
Westendorf, M. L., P. Venkata, C. Williams, J. Trpu and R. Govindasamy. 2012. Dietary and Manure Management Practices on Equine Farms in Two New Jersey Watersheds, Eq. Vet. Sci. 33:8,601-606.
Acknowledgements
The State University Extension Equine Specialist that make up the NE-1441: Environmental Impacts of Equine Operations, Multi-State Program. USDA, NRCS-CIG grant for funding the Pennsylvania project.
The authors are solely responsible for the content of these proceedings. The technical information does not necessarily reflect the official position of the sponsoring agencies or institutions represented by planning committee members, and inclusion and distribution herein does not constitute an endorsement of views expressed by the same. Printed materials included herein are not refereed publications. Citations should appear as follows. EXAMPLE: Authors. 2015. Title of presentation. Waste to Worth: Spreading Science and Solutions. Seattle, WA. March 31-April 3, 2015. URL of this page. Accessed on: today’s date.
Why Is It Important to Study Availability of Manure Nitrogen?
Application of fresh and composted manure as a fertilizer source in corn production has long been a useful practice in many sustainable crop production systems especially when phosphorus, and not nitrogen (N), is the primary nutrient of interest. But when manure is applied as the primary source of N, despite several agronomic advantages associated with manure use, there is a high risk of ground water pollution, and often times, would produce lower yields and grain protein than inorganic fertilizers. Nitrogen mineralization and availability from manure is difficult to predict. Therefore estimating the amount of crop N uptake that may be attributed to manure applied in the same year or to its residual impact, can be a useful approach towards quantifying a supplementary quantity of inorganic N fertilizer with the manure.
What did we do?
This study measured in situ relative soil N mineralization rates (flux) during three growing seasons of continuous no-till (2013 and 2014) corn in Carrington, ND. We applied fresh (FM) and composted beef feedlot manure (CM) only once in spring 2012 at N rates of 90, 180, and 240lbs/A as FM, and 90 and 180lbs as CM. These rates were applied based on the calculation that 50% of N from FM and 25% of N from CM, would be available the first year. Other treatments were urea at 90, 150, 180, and 240lbs N/A, plus a check at 0lbs/A. In 2013 and 2014 urea was applied to respective plots, based on soil test, to raise the N levels to the respective 2012 N levels. We used the randomized complete block design with four replicates. Three replicates were used to measure soil N (NO3- + NH4+) mineralization rates bi-monthly with Plant Root Simulator probes (PRS™), from the urea fertilized and manured plots at the 0, 90 and 180lb levels at 4-6 leaf growth stage. Four pairs of PRS™ probes were buried in the top 6 inches near corn roots and replaced every two weeks for four sampling dates. We measured yields, protein content, and N uptake.
What have we learned?
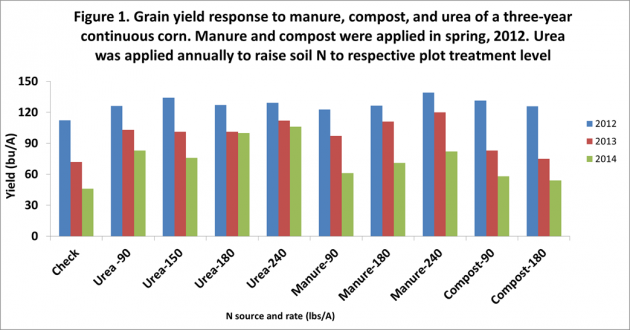
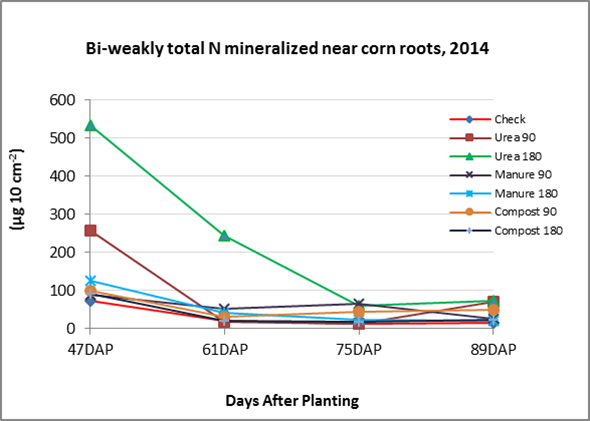
Yields were generally low in all three years of this study, well below the average for this region. Bi-monthly N mineralization was significantly higher as N increases with urea as N source during the early sampling dates (Figures 2 and 3) and subsequently declined to similar levels as the manure treatments. It is therefore possible that the plants benefited from higher early uptake of N from urea up to the early stages of peak corn N uptake but not enough to produce significantly higher yields than the manure treatments. Analysis of variance showed no significant treatment effects for yields in 2012 (α = 0.05) but grain protein differences were significant. These differences were observed only between the check and 180 lbs N in 2012. The highest mean grain yield was recorded with the 90 lbs N treatment where, the residual soil N at planting was just 33 lbs. The protein level was also significantly higher than the check and CM plot that received 180 lbs N in 2012, and with a soil residual N prior to 2013 planting, at 35 lbs. Each year, grain yields responded positively to N rates (applied as urea) and residual N levels from FM but not with CM. Since corn was grown for three continuous years, unsurprisingly yields declined with years of production since N was not applied to the FM and CM treatments after first application in year one. Similarly, yield decline was observed with urea over the three years but not as steep as the FM and CM treatments. The FM at 240 lbs N, and urea at 180 and 240 lbs treatments produced significantly higher grain protein than the check in 2012 (data not shown). Lower N mineralization and very likely, lower N availability was observed with the CM treatments especially at 180 lbs N, which consistently scored the lowest mean yield and protein in 2013 and 2014. Grain yields were consistently higher at 90 lbs N than 180 lbs N with the CM treatment. Summer droughts of 2012 and 2013 at this site and possibly, factors associated with continuous corn production (e.g. disease, temporal N immobilization) compounded the effects of urea treatments even though N uptake was consistently higher with urea. Total N taken up in corn grains from the FM and CM treatments increased with N rates but decreased with time (Table 1). From this study, corn grains took up more N from the plots treated with FM than the CM over the three-year period of the study. Subsequent changes in soil conditions such as moisture, N leaching, temperature, can sometimes limit the efficiency of inorganic fertilizer uses, and favoring low cost alternative uses such as manure especially if the prevailing conditions enhance N mineralization from manure or soil organic matter. Based on N input plus soil N status at the beginning of planting every year, corn N uptake efficiency was in the order: Check>FM>CM>Urea, with efficiency decreasing at higher N rates. The minimum proportion of grain N uptake by any treatment to the single highest N uptake for any urea-N treatment (considered as a reference) in a given year, was 42% for the check in 2013.
Future Plans
Relative contribution of nitrogen from the fresh and composted manure treatments and residual N will be used to estimate the percentage of N coming from these treatments over a three-year period. This will be used to establish new studies to assess different levels of fertilizer N to apply with manure to improve on the grain protein content and yields.
Authors
Jasper M Teboh, Soil Scientist, Carrington Research Extension Center, North Dakota State University Jasper.Teboh@ndsu.edu
North Dakota Corn Growers Association, Western Ag Innovations, Mr. Ron Wiederholt, Mr. Blaine G Schatz (Director, CREC)
The authors are solely responsible for the content of these proceedings. The technical information does not necessarily reflect the official position of the sponsoring agencies or institutions represented by planning committee members, and inclusion and distribution herein does not constitute an endorsement of views expressed by the same. Printed materials included herein are not refereed publications. Citations should appear as follows. EXAMPLE: Authors. 2015. Title of presentation. Waste to Worth: Spreading Science and Solutions. Seattle, WA. March 31-April 3, 2015. URL of this page. Accessed on: today’s date.
Land disposal of manure is a challenging environmental problem in areas with intense confined pig production. When manure is land applied at optimal nitrogen rates for crop growth, phosphorus can accumulate in excess of soil assimilative capacity because of the disproportion of nitrogen and phosphorus contents in animal manures relative to plant biomass. In turn, excess manure phosphorus lost through soil leaching or runoff has the potential to reach and pollute water resources. To reduce manure phosphorus losses into the environment, a substantial amount of phosphorus needs to be moved off the pig farm but transporting manure to phosphorus-deficit croplands becomes less cost effective with increasing distance from the pig farm. Yet, conservation and recovery of phosphorus is a concern in modern agriculture because of the high cost and possible insufficient supply of mined phosphates in the future. Thus, manure management in regions with intense animal production could benefit from new technologies that would recover manure phosphorus in a concentrated, usable form. This approach would make more economical the long distance transfers of manure phosphorus while reducing both agronomic phosphorus imbalances and adverse effects of soil P losses on water resources.
What did we do?
A patented treatment process, called “Quick Wash”, was developed for extraction and recovery of phosphorus from animal manure solids, but research has shown that the approach is equally effective with municipal biosolids. In the Quick Wash process, phosphorus is selectively extracted from pig manure solids by using mineral or organic acid solutions. Following, phosphorus is recovered by addition of liquid lime and an organic poly-electrolyte to the liquid extract to form a calcium-containing P precipitate. The quick wash process generates two products: 1) manure solids low in phosphorus; and 2) recovered phosphorus material.
What have we learned?
The Quick Wash process selectively extracts and recovers as much as 90 % of the phosphorus from pig manure solids while leaving most of the nitrogen in the washed manure solids. Consequently, the washed solid residue has a more balanced nitrogen and phosphorus composition for crop production and is environmentally safer for land application. The concentrated phosphorus product contains more than 90% of its phosphorus in plant available form for use as crop fertilizer. The inclusion of this process in a waste management system offers pig producers a new and welcomed opportunity to minimize phosphorus losses into the environment, while recovering and recycling phosphorus as a valuable product.
Future Plans
USDA granted an exclusive license of the invention to Renewable Nutrients, LLC (Pinehurst, NC). The Quick Wash is being commercialized by Renewable Nutrients, LLC for the municipal wastewater treatment sector and its partner TRIEA Technologies, LLC (Frederick, MD) for phosphorus recovery in the animal agriculture market.
Authors
Ariel A. Szogi, Research Soil Scientist, USDA-ARS Coastal Plains Soil, Water, and Plant Research Center, Florence, SC ariel.szogi@ars.usda.gov
Matias B. Vanotti, Patrick G. Hunt – USDA-ARS Coastal Plains Soil, Water, and Plant
Szogi, A.A., Vanotti, M.B., Hunt, P.G., 2014. Process for removing and recovering phosphorus from animal waste. U.S. Patent 8,673,046 B1. U.S. Patent and Trademark Office.
Acknowledgements
This work is part of USDA-ARS National Program 214: Agricultural and Industrial Byproducts; ARS Project 6657-13630-005-00D “Innovative Bioresource Management Technologies for Enhanced Environmental Quality and Value Optimization.”
The authors are solely responsible for the content of these proceedings. The technical information does not necessarily reflect the official position of the sponsoring agencies or institutions represented by planning committee members, and inclusion and distribution herein does not constitute an endorsement of views expressed by the same. Printed materials included herein are not refereed publications. Citations should appear as follows. EXAMPLE: Authors. 2015. Title of presentation. Waste to Worth: Spreading Science and Solutions. Seattle, WA. March 31-April 3, 2015. URL of this page. Accessed on: today’s date.
This project was started to work with regional CIG projects to calibrate and harmonize Phosphorus Indices across the U.S., demonstrate their accuracy in identifying the magnitude and extent of phosphorus loss risk, and provide suggestions to refine or improve existing Indices. This research is important to provide consistency among state Phosphorus Indices and their subsequent recommendations.
What did we do?
We will combine and compare results from each of the four regional and state Phosphorus Index CIG-funded projects, in order to synthesize, summarize, and describe the science-based information and lessons learned from the individual Phosphorus Index assessment projects (i.e., Chesapeake Bay Watershed, Heartland Region, Southern States and Ohio Lake Erie Basin) and build a harmonized framework that yields consistent Phosphorus-based risk assessment across the U.S. by doing this, we plan to ensure that the refinement of Phosphorus Indices is grounded in the best available science, reflects local environmental and agronomic conditions, anticipates impacts to water quality and farm management, and provides consistent recommendations within and across varied physiographic regions of the U.S.
What have we learned?
Despite the success of the Phosphorus Index concept in state-level nutrient management planning strategies as part of the NRCS 590 Standard, there remain concerns about the effectiveness of the Indexing approach for attaining water quality goals. Different versions of the Phosphorus Index have emerged to account for regional differences in soil types, land management, climate, physiographic and hydrologic controls, manure management strategies, and policy conditions. Along with this development, differences in Phosphorus Index manure management recommendations under relatively similar site conditions have also emerged. To date, we have learned that the individual projects with slightly differing objectives have shown there to be a paucity of field measured runoff, against which to reliably compare Index performance. Thus, several off-the shelf and pre-calibrated models (e.g., APEX) were tested to provide adequate phosphorus runoff information to validate Indices. Use of off-the-shelf models can provide unreliable estimates of phosphorus runoff, while calibrate models can provide more reliable estimates when given adequate site information.
Future Plans
It is planned to have extend the research for one more year to the end of 2016 to continue model assessment, compile field runoff databases, conduct statistical and uncertainty analyses, and compile cross project findings.
Authors
Andrew Sharpley, Distinguished Professor, Division of Agriculture University of Arkansas System sharpley@uark.edu
Deanna Osmond, Professor and Soil Science Department Extension Leader; David Radcliff, Professor; Peter Kleinman, Research Leader; Doug Beegle, Distinguished Professor of Agronomy; John Lory, Associate Professor of Extension; and Nathan Nelson, Professor.
Additional information
Sharpley, A.N., D. Beegle, C. Bolster, L. Good, B. Joern, Q. Ketterings, J. Lory, R. Mikkelsen, D. Osmond, and P. Vadas. 2011. Revision of the 590 Nutrient Management Standard: SERA-17 Recommendations. Southern Cooperative Series Bulletin No. 412. Published by SERA-IEG-17, Virginia Tech. University, Blacksburg, VA. Available at https://sera17dotorg.files.wordpress.com/2015/02/590-sera-17-recommendations.pdf 2011.
Sharpley, A.N., D. Beegle, C. Bolster, L. Good, B. Joern, Q. Ketterings, J. Lory, R. Mikkelsen, D. Osmond, and P. Vadas. 2011. Revision of the 590 Nutrient Management Standard: SERA-17 Supporting Documentation. Southern Cooperative Series Bulletin No. 412. Published by SERA-IEG-17, Virginia Tech. University, Blacksburg, VA. Available at https://sera17dotorg.files.wordpress.com/2015/02/590-sera-17-recommendations.pdf
Sharpley, A.N., D.G. Beegle, C. Bolster, L.W. Good, B. Joern, Q. Ketterings, J. Lory, R. Mikkelsen, D. Osmond, and P.A. Vadas. 2012. Phosphorus indices: Why we need to take stock of how we are doing. J. Environ. Qual. 41:1711-1718.
Osmond, D.L., A.N. Sharpley, C. Bolster, M. Cabrera, S. Feagley, B. Lee, C. Mitchell, R. Mylavarapu, L. Oldham, F. Walker, and H. Zhang. 2012. Comparing phosphorus indices from twelve southern USA states against monitored phosphorus loads from six prior southern studies. J. Environ. Qual. 41:1741-1750.
The authors are solely responsible for the content of these proceedings. The technical information does not necessarily reflect the official position of the sponsoring agencies or institutions represented by planning committee members, and inclusion and distribution herein does not constitute an endorsement of views expressed by the same. Printed materials included herein are not refereed publications. Citations should appear as follows. EXAMPLE: Authors. 2015. Title of presentation. Waste to Worth: Spreading Science and Solutions. Seattle, WA. March 31-April 3, 2015. URL of this page. Accessed on: today’s date.
The Environmentally Friendly Farm program was developed by Penn State Equine Extension and is designed to recognize farms that adopt environmentally sound management practices that protect water quality and the environment. The program is supported by funds from the USDA Natural Resource Conservation Service (NRCS), Conservation Innovation Grant. Strategies are employed on Environmentally Friendly Farms to maintain productive pastures, reduce soil erosion, limit nutrient runoff from animal facilities and barnyards, safely store manure, recycle nutrients, and control animal access to surface waters. Excess sediment and nutrient runoff from manure poses health threats not only to the environment, but also to animals and people. Farm managers who practice environmental stewardship maintain healthy environments for their animals, their families, and their community.
What did we do?
Farm managers can apply for the program by request a copy of the application from Penn State Equine Extension by visiting us online at http://www.extension.psu.edu/equine, emailing or calling our extension office. Second, complete the Environmentally Friendly Farm application requesting background information about the farm operation.
Next, complete the Environmentally Friendly Farm Self-Assessment Checklist. Each statement is checked “yes” if the practice is in place on the farm, “no” if the practice is not in place or “non-applicable if the statement does not pertain to the farm operation. The checklist consists of a series of statements that identify potential on-farm practices in the following areas: Environmentally Sensitive Areas, Pastures, Animal Concentration Areas, Manure Storage, and Mechanical Manure Application.
Once the paperwork has been received, a farm site visit will be scheduled. Personnel from Penn State Extension, the County Conservation District, or the Natural Resource Conservation District (NRCS) will visit farms to verify that statements made in the application and checklists are accurate. At the same time, additional information and assistance will be provided to help improve farm management and develop any necessary plans for the farm.
The farm will be recognized by the public, conservation and agricultural agencies, and other farm managers as an operation that is committed to clean water and a healthy environment. Each farm manager will receive an Environmentally Friendly Farm sign that can be displayed on the farmstead. Farms that qualify will also be given permission to use the Environmentally Friendly Farm artwork on their website, brochure, and other marketing materials. Approved farms will be listed on the Penn State Equine Extension website.
This recognition will reflect the commitment of the farm manager to environmental stewardship and can serve as a marketing tool for the farm.
What have we learned?
After personnel visited farms to verify that statements made in the application and checklists are accurate. At the same time, additional information and assistance is provided to help improve farm management and develop any necessary plans for the farm. In addition, agency personal developed a personal relationship with the farm manager. The farm managers who practice environmental stewardship maintain healthy environments for their animals, their families, and their community.
Future Plans
This program will be continued through 2016. We hope to provide additional information and assistance to help improve farm management.
Donna Foulk, Helene McKernan, Pennsylvania State University, University Park, PA 16802
Additional information
Farms can request a copy of the application from the Penn State Extension Equine Team by visiting us online at http://www.extension.psu.edu/equine
Acknowledgements
This program was funded partly by a USDA NRCS-CIG grant.
The authors are solely responsible for the content of these proceedings. The technical information does not necessarily reflect the official position of the sponsoring agencies or institutions represented by planning committee members, and inclusion and distribution herein does not constitute an endorsement of views expressed by the same. Printed materials included herein are not refereed publications. Citations should appear as follows. EXAMPLE: Authors. 2015. Title of presentation. Waste to Worth: Spreading Science and Solutions. Seattle, WA. March 31-April 3, 2015. URL of this page. Accessed on: today’s date.
Why Study the Impacts of Poultry Litter on Phosphorus Cycling?
Livestock manures, including poultry litter, are often applied to soil as crop fertilizer or as a disposal mechanism near livestock housing. Manures can improve soil quality and fertility; however, over-application can result in negative environmental consequences, such as eutrophication of surface waters following runoff of soluble or particulate-associate phosphorus (P). In soil, P exists in many forms (inorganic/organic, labile/stable) and the fate of manure P is highly dependent upon soil properties, including soil texture and microbial activity. The Houston Black series is a calcareous (~17% calcium carbonate), high-clay soil that occupies roughly 12.6 million acres in east-central Texas. These Blackland vertizols are agronomically important for the production of cotton, corn, hay, and other crops, but their high calcium and clay content could lead to accumulation of P in forms that are not readily available for plant utilization. Accumulated P could serve as a source of legacy P if mineralized or otherwise transformed in situ or transported with soil particles in runoff.
Very few studies have investigated the long-term effects of manure or litter application on soil P distribution: almost no data exist on manure impacts on calcium-associated organic P in soil. Sequential fractionation techniques, coupled with phosphatase hydrolysis, have allowed for greater understanding of manure/litter effects on soil P distribution and transformation. A fairly standardized designation is separation of extracted P into labile P (H2O- and NaHCO3-P), moderately labile P (NaOH-P; assumed to be associated with amorphous Al/Fe oxides and organic matter), and stable P (HCl-P; assumed to be Ca-associated phosphates). Incubation of the extracted fractions with excess P hydrolyzing enzymes enables further characterization of organic P as phosphomonoester-like, nucleotide-like, phytate-like, or non-hydrolyzable organic P.
The specific objectives of this study were to investigate effects of long-term poultry litter application and land-use type (cultivated, grazed/ungrazed improved pasture, native rangeland) on soil P distribution in watershed-scale plots. The goal of this work is an improved understanding of how litter impacts P cycling and availability in these agronomically important calcareous soils.
What did we do?
We evaluated the effect of long-term (> 10 years) poultry litter (broiler and turkey litter) application at rates of 4.5, 6.7, 9.0, 11.2, and 13.4 Mg/ha (wet weight) on P distribution in cultivated (4.0 to 7.4 ha) and pasture (1.2 to 8.0 ha) watersheds near Riesel, Texas. The experiment was initiated in 2000 by the USDA-ARS Grassland Soil and Water Research Laboratory in Temple, Texas (Harmel et al., 2004), where cultivated fields were in a 3-year corn-corn-wheat rotation and received an annual application of poultry litter at predetermined rates. Litter was incorporated into cultivated plots with a disk or field cultivator. Improved pastures received surface-application of litter. Control treatments (no litter application) included cultivated, native rangeland, and grazed improved pasture.
Soil samples were collected from each watershed and subjected to sequential fractionation with water (H2O), sodium bicarbonate (0.5 M NaHCO3), sodium hydroxide (0.1 M NaOH), and hydrochloric acid (1.0 M HCl) (He et al., 2006; Waldrip-Dail et al., 2009). Total P in the extracts was determined by inductively coupled optical-emission plasma spectroscopy. Inorganic P was determined colorimetrically using a modified molybdenum blue method (He and Honeycutt, 2005). Concentrations of organic P forms (monoester-, DNA- phytate-like, and non-hydrolyzable organic P) were determined following enymatic hydrolysis with acid phosphomonoesterases and nuclease P1 (He and Honeycutt, 2001; He et al., 2003, 2004).
What have we learned?
This research clearly showed that use of poultry litter as a nutrient source for both cultivated and pasture watersheds increased concentrations of total P in all extractable fractions, especially at high litter application rates (Figure 1).
The majority of the total extractable P was found in the fractions that are associated with calcium in the soil (HCl and NaHCO3). An average of 68% of total P was extractable with HCl. However, differences were observed in extractable P distribution due to land-use type and litter application rate. In cultivated watersheds, the inorganic pools primarily affected were H2O- and NaHCO3-P, with some treatments having as much as four times more inorganic P in the labile pool compared with the stable pool. Whereas in the pastureland, increases in soil inorganic P were only found in pasture when either cattle was grazed or when poultry litter was applied at the highest rate.
The addition of litter increased all forms of labile, enzyme hydrolyzable organic P in cultivated plots, compared to plots that did not receive litter (Figure 2).
In cultivated fields, litter application significantly increased monoester-, DNA-, and phytate-like P; in contrast, only monoester-like P was increased in pasture, and phytate- and DNA-like P concentrations were actually lower in litter-amended pasture than native rangeland. The majority of the extractable organic P was non-hydrolyzable calcium-associated P (HCl-P), and this fraction was increased up to 217% by 10 years of poultry litter application. Thus, we concluded that repeated litter application increased levels of both soluble inorganic P and stable, non-hydrolyzable organic P, but specific response varied with application rate and management.
Future Plans
The fate of manure P in the environment is not yet well understood, and the fact that a large fraction of calcium-associated P was not accessible to the enzymes used in this study does not necessarily indicate that this fraction is not accessible to other soil phosphatases. Only very limited studies have been conducted on organic P in the HCl fraction, and more work is required to provide a clearer understanding of how this fraction interacts with soil minerals and organic matter. Results like this long-term study show the potential for high levels of accumulation of P that is not readily available for plant uptake and that could be transferred to surface or groundwaters. In addition, further applications of poultry litter, other livestock manure, or inorganic fertilizer, could lead to increased concentrations of labile P due to lack of available sorption sites in soil. Further study is warranted to evaluate the long-term effects on P distri bution and accumulation of legacy P following application of different manure types (e.g., beef and dairy cattle, swine) and on soils with contrasting physicochemical properties.
Paulo Pagliari, Univ. Minnesota; Zhongqi He, Research Chemist at USDA-ARS, New Orleans, LA; R. Daren Harmel, Agricultural Engineer at USDA-ARS, Temple, TX; N. Andy Cole, Animal Scientist at USDA-ARS, Bushland, TX; Mingchu Zhang, Univ. Alaska
Additional information
Heidi M. Waldrip, Research Chemist, USDA-ARS Conservation and Production Laboratory, PO Drawer 10, Bushland, TX 79012. Tel: 806-356-5764. email: heidi.waldrip@ars.usda.gov.
Harmel, R. D., H. A. Torbert, B. E. Haggard, R. Haney, and M. Dozier. 2004. Water quality impacts of converting to a poultry litter fertilization strategy. J. Environ. Qual. 33: 2229-2242.
References:
He, Z., T. S. Griffin, and C. W. Honeycutt. 2006. Soil phosphorus dynamics in response to dairy manure and inorganic fertilizer applications. Soil Sci. 171: 598-609.
He, Z., and C. W. Honeycutt. 2001. Enzymatic characterization of organic phosphorus in animal manure. J. Environ. Qual. 30: 1685-1692.
He, Z., and C. W. Honeycutt. 2005. A modified molybdenum blue method for orthophosphate determination suitable for investigating enzymatic hydrolysis of organic phosphates. Commun. Soil Sci. Plant Anal. 36: 1373-1385.
He, Z., C. W. Honeycutt, and T. S. Griffin. 2003. Enzymatic hydrolysis of organic phosphorus in extracts and resuspensions of swine manure and cattle manure. Biol. Fertil. Soils. 38: 78-83.
He, Z., T. S. Griffin, and C. W. Honeycutt. 2004. Enzymatic hydrolysis of organic phosphorus in swine manure and soils. J. Environ. Qual. 33: 367-372.
Waldrip-Dail, H., Z. He, M. S. Erich, and C. W. Honeycutt. 2009. Soil phosphorus dynamics in response to poultry manure amendment. Soil Sci. 174: 195-201
The authors are solely responsible for the content of these proceedings. The technical information does not necessarily reflect the official position of the sponsoring agencies or institutions represented by planning committee members, and inclusion and distribution herein does not constitute an endorsement of views expressed by the same. Printed materials included herein are not refereed publications. Citations should appear as follows. EXAMPLE: Authors. 2015. Title of presentation. Waste to Worth: Spreading Science and Solutions. Seattle, WA. March 31-April 3, 2015. URL of this page. Accessed on: today’s date.
Manage Cookie Consent
To provide the best experiences, we use technologies like cookies to store and/or access device information. Consenting to these technologies will allow us to process data such as browsing behavior or unique IDs on this site. Not consenting or withdrawing consent, may adversely affect certain features and functions.
Functional
Always active
The technical storage or access is strictly necessary for the legitimate purpose of enabling the use of a specific service explicitly requested by the subscriber or user, or for the sole purpose of carrying out the transmission of a communication over an electronic communications network.
Preferences
The technical storage or access is necessary for the legitimate purpose of storing preferences that are not requested by the subscriber or user.
Statistics
The technical storage or access that is used exclusively for statistical purposes.The technical storage or access that is used exclusively for anonymous statistical purposes. Without a subpoena, voluntary compliance on the part of your Internet Service Provider, or additional records from a third party, information stored or retrieved for this purpose alone cannot usually be used to identify you.
Marketing
The technical storage or access is required to create user profiles to send advertising, or to track the user on a website or across several websites for similar marketing purposes.



 This study measured in situ relative soil N mineralization rates (flux) during three growing seasons of continuous no-till (2013 and 2014) corn in Carrington, ND. We applied fresh (FM) and composted beef feedlot manure (CM) only once in spring 2012 at N rates of 90, 180, and 240lbs/A as FM, and 90 and 180lbs as CM. These rates were applied based on the calculation that 50% of N from FM and 25% of N from CM, would be available the first year. Other treatments were urea at 90, 150, 180, and 240lbs N/A, plus a check at 0lbs/A. In 2013 and 2014 urea was applied to respective plots, based on soil test, to raise the N levels to the respective 2012 N levels. We used the randomized complete block design with four replicates. Three replicates were used to measure soil N (NO3- + NH4+) mineralization rates bi-monthly with Plant Root Simulator probes (PRS™), from the urea fertilized and manured plots at the 0, 90 and 180lb levels at 4-6 leaf growth stage. Four pairs of PRS™ probes were buried in the top 6 inches near corn roots and replaced every two weeks for four sampling dates. We measured yields, protein content, and N uptake.
 Yields were generally low in all three years of this study, well below the average for this region. Bi-monthly N mineralization was significantly higher as N increases with urea as N source during the early sampling dates (Figures 2 and 3) and subsequently declined to similar levels as the manure treatments. It is therefore possible that the plants benefited from higher early uptake of N from urea up to the early stages of peak corn N uptake but not enough to produce significantly higher yields than the manure treatments. Analysis of variance showed no significant treatment effects for yields in 2012 (α = 0.05) but grain protein differences were significant. These differences were observed only between the check and 180 lbs N in 2012. The highest mean grain yield was recorded with the 90 lbs N treatment where, the residual soil N at planting was just 33 lbs. The protein level was also significantly higher than the check and CM plot that received 180 lbs N in 2012, and with a soil residual N prior to 2013 planting, at 35 lbs. Each year, grain yields responded positively to N rates (applied as urea) and residual N levels from FM but not with CM. Since corn was grown for three continuous years, unsurprisingly yields declined with years of production since N was not applied to the FM and CM treatments after first application in year one. Similarly, yield decline was observed with urea over the three years but not as steep as the FM and CM treatments. The FM at 240 lbs N, and urea at 180 and 240 lbs treatments produced significantly higher grain protein than the check in 2012 (data not shown). Lower N mineralization and very likely, lower N availability was observed with the CM treatments especially at 180 lbs N, which consistently scored the lowest mean yield and protein in 2013 and 2014. Grain yields were consistently higher at 90 lbs N than 180 lbs N with the CM treatment.
  Summer droughts of 2012 and 2013 at this site and possibly, factors associated with continuous corn production (e.g. disease, temporal N immobilization) compounded the effects of urea treatments even though N uptake was consistently higher with urea. Total N taken up in corn grains from the FM and CM treatments increased with N rates but decreased with time (Table 1). From this study, corn grains took up more N from the plots treated with FM than the CM over the three-year period of the study. Subsequent changes in soil conditions such as moisture, N leaching, temperature, can sometimes limit the efficiency of inorganic fertilizer uses, and favoring low cost alternative uses such as manure especially if the prevailing conditions enhance N mineralization from manure or soil organic matter. Based on N input plus soil N status at the beginning of planting every year, corn N uptake efficiency was in the order: Check>FM>CM>Urea, with efficiency decreasing at higher N rates. The minimum proportion of grain N uptake by any treatment to the single highest N uptake for any urea-N treatment (considered as a reference) in a given year, was 42% for the check in 2013.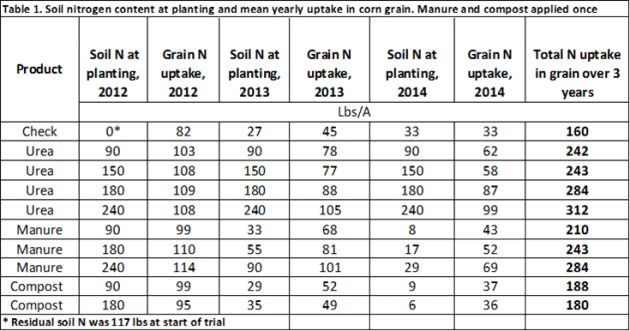
 A patented treatment process, called “Quick Wash”, was developed for extraction and recovery of phosphorus from animal manure solids, but research has shown that the approach is equally effective with municipal biosolids. In the Quick Wash process, phosphorus is selectively extracted from pig manure solids by using mineral or organic acid solutions. Following, phosphorus is recovered by addition of liquid lime and an organic poly-electrolyte to the liquid extract to form a calcium-containing P precipitate. The quick wash process generates two products: 1) manure solids low in phosphorus; and 2) recovered phosphorus material.
 Purpose

