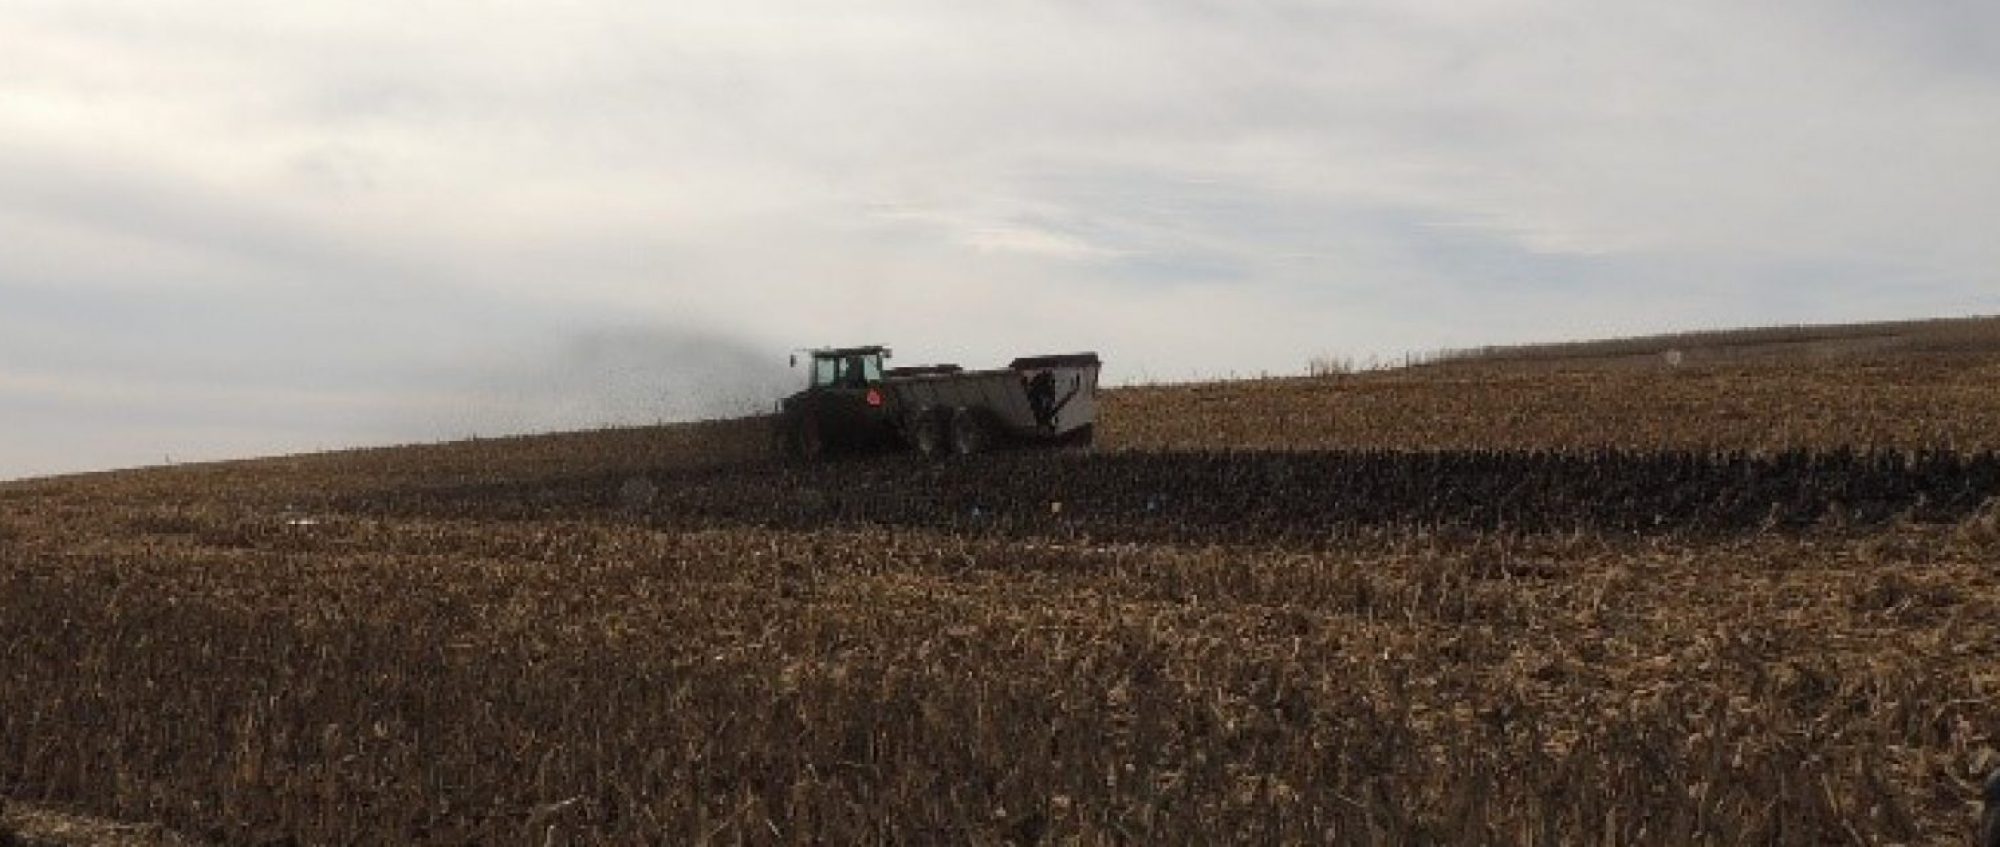
In this webinar, presenters share tips on what to look for, how to monitor your system, and what maintenance is needed for manure pipelines. This presentation was originally broadcast on February 18, 2022. Continue reading “Going the distance: considerations for the use of manure pipelines”
Fate of antibiotic resistant bacteria and genes in manure storage
Manure storage and its application on cropland may contribute a form of environmental contamination: antimicrobial-resistant bacteria. These bacteria in manure are perceived to cause diseases in humans through environmental contamination. However, a recent study at the University of Nebraska-Lincoln feedlots near Mead, Nebraska concluded that long-term manure storage as static stockpiles has the advantage of inactivating antimicrobial-resistant bacteria, and it has the potential to reduce antimicrobial resistance genes. Continue reading “Fate of antibiotic resistant bacteria and genes in manure storage”
What’s New with Solid Separation? NRCS has an Answer
This webinar highlights the new solid-liquid separation manual that NRCS has developed. This presentation was originally broadcast on October 18, 2019. More… Continue reading “What’s New with Solid Separation? NRCS has an Answer”
Existing Data on Long Term Manure Storages, Opportunities to Assist Decision Makers
Long-term manure storages on dairy farms are temporary containment structures for byproducts of milk production. Manure, milkhouse wash, bedding, leachate, and runoff are stored until they can be utilized as fertilizer, bedding, irrigation, or energy. The practice of long-term storage creates stakeholders who collect data in their interactions with storages. This presents an opportunity to support data driven decision making on best use and operation of storages.
What Did We Do?
Prevalent stakeholders who collected data on storages were identified and the information they collected was examined. Data that could assist in depicting storage infrastructure was retained. Data not collected but of value to decision makers was noted. From this a combined data set was proposed that could depict the size, state, and impact of storage infrastructure. The feasibility of such a combined data set and opportunities from it were considered.
What Have We Learned?
General volume, general configuration, and year installed are most often collected by stakeholders while detailed configuration and detailed waste type are rarely collected. Cost is not collected. (Table 1) Stakeholders do not collect data on operations of all sizes. Most data is collected on large and medium operations while data is rarely collected on small operations. Stakeholders use their own definitions and classification structures.
| Table 1 Combined data to be collected to assist decision makers | ||
|---|---|---|
| Data | Specificity | Currently collected by |
| Location | County | State, NRCS, CNMP |
| City | STATE, CNMP | |
| Address | STATE, CNMP | |
| Lat, Long | NONE | |
| Storage Volume | Total | STATE, NRCS, CNMP |
| Operational | STATE, CNMP | |
| Geometric Dimensions | STATE, CNMP | |
| Above/Below Ground | STATE, NRCS, CNMP | |
| Year Built | Year Built | STATE, NRCS, CNMP |
| Year Inspected | STATE, CNMP | |
| Year Recertified | STATE, CNMP | |
| Year Upgraded | STATE, CNMP | |
| Configuration | Liner (Dug,Clay,Plastic,Concrete,Steel) | STATE, NRCS, CNMP |
| Certification(313,PE,ACI318,ACI350) | STATE, NRCS, CNMP | |
| Cover(none, rain, gas) | STATE, NRCS, CNMP | |
| Waste | Volume Produced | STATE, CNMP |
| Type(manure,washwater,leachate,runoff) | STATE, CNMP | |
| Manure Type(liquid, stack, pack, liquid sand, liquid recycled) | CNMP | |
| Advanced Treatment | CNMP | |
| Costs | Total | NONE |
| Per Component | NONE | |
| Operational | NONE | |
| *STATE-State of Michigan
*NRCS-United States Department of Agriculture Natural Resources Conservation Service |
||
| Table 2 First level characterization |
|---|
| Parameter |
| Number |
| Location |
| Age |
| Total Stored Capacity |
| Precipitation Stored Capacity |
| Waste Stored Capacity |
| Produced Waste Volume |
| Produced Waste Type |
| Produced Manure Volume |
| Produced Manure Type |
| Liner Type |
| Cover Type |
| Certification Type |
A first level characterization of storage infrastructure is proposed from Table 1, Table 2. Items in the first level characterization depict the location and condition of the storage infrastructure. Each of these items may be represented over a specific geographic area, such as state, watershed, or county. In a yearly inventory each of these items may be represented over time.
| Table 3 Second level characterization |
|---|
| Parameter |
| Length of Storage Estimate |
| Proximity to Sensitive Area Estimate |
| Storage Density |
| Seepage Estimate |
| Emissions Estimate |
Using Table 2 a second level characterization is proposed, Table 3. Items in the second level characterization estimate the capacity and impact of the state’s storage infrastructure. Supplementary information to estimate certain parameters is required. Each of these items may be represented over time and specific geographic area. Cost to implement and operate storage infrastructure are the third characterization, Table 4. Each of these items may be represented over time and specific geographic area.
| Table 4 Cost characterization |
|---|
| Parameter |
| Cost Estimate |
| Implement, Per Volume |
| Per Configuration |
| Operate, Per Volume |
| Per Configuration |
Combining and characterizing data from different stakeholders can provide a data-driven representation of storage infrastructure. Condition, capability, and impact of the storage infrastructure can be represented over time and geographic area. Monitoring, evaluating actions, forecasting issues, and targeting priority areas1 is made feasible. Example opportunities are as follows.
Long-term storage is desirable to enable storage of manure during winter months. Combined data can provide feedback on average days of storage in the state or watershed. The cost to achieve target days of storage may be estimated and the days of storage may be tracked over time as a result of funding efforts.
New York State released $50 million for water quality funding, which assisted in the implementation of new storages. In the implementation of these storages opportunity exits to collect cost data to inform future funding levels, quantify the increase in long-term storage provided as a result of the funding, and forecast when these storages are projected to reach the end of their lifecycle2.
As interest in cover and flare storages increase to offset livestock emissions combined data sets can assist in evaluating feasibility of such a proposal3 4 5. Potential emissions to be captured and cost to implement can be estimated.
Obstacles to collecting and combining data are cost, insufficiency, and misuse. As specificity in the data to be collected increases so does the cost to collect, combine, and maintain. Additionally, stakeholders have existing data collection infrastructure that must be modified at cost to allow combination. If the combined data set is not sufficiently populated by stakeholders is will depict an inaccurate representation of storage infrastructure. Finally, the risk of misuse and conflict amongst decision makers is present. Stakeholders may purposely or inadvertently use the inventory to reach erroneous conclusions.
Future Plans
Obstacles to implementation are not insignificant. Detailed analysis is required to determine the exact data to be collected, definitions to be agreed upon, and extent of coverage such that maximum benefit will be derived for decision makers.
Full benefit of storage data is increased by additional data sets such as state-wide livestock numbers, precipitation and temperature distributions, surface water locations, ground water levels, populations center locations, well locations, shallow bedrock locations, karst locations, complaint locations, and operator violations locations. The feasibility of obtaining these data sets should be determined.
The implementation and use of storages has additional stakeholders outside of those identified here. Additional stakeholders should be identified that can enhance or derive value from a combined data set on long term storages, such as manure applicators, handling and advanced treatment industry, extension services, zoning officials, professional engineers, environmental groups, and contractors.
Authors
Corresponding author
Michael Krcmarik, P.E., Area Engineer, United States Department of Agriculture Natural Resources Conservation Service, Flint, Michigan
Michael.Krcmarik@usda.gov
Other authors
Sue Reamer, Environmental Engineer, United States Department of Agriculture Natural Resources Conservation Service, East Lansing, Michigan
Additional Information
-
- “Conservation Effects Assessment Project (CEAP).” Ceap-Nrcs.opendata.arcgis.com, ceap-nrcs.opendata.arcgis.com/.
- $50 Million in Water Quality Funding Available for NY Livestock Farms.” Manure Manager, 27 Sept. 2017, www.manuremanager.com/state/$50-million-in-water-quality-funding-available-for-ny-livestock-farms-30286.
- Wright, Peter, and Curt Gooch. “ASABE Annual International Meeting.” Estimating the Economic Value of the Greenhouse Gas Reductions Associated with Dairy Manure Anaerobic Digestions Systems Located in New York State Treating Dairy Manure, July 16-19 2017.
- Wightman, J. L., and P. B. Woodbury. 2016. New York Dairy Manure Management Greenhouse Gas Emissions and Mitigation Costs (1992–2022). J. Environ. Qual. 45:266-275. doi:10.2134/jeq2014.06.0269
- Barnes, Greg. “Smithfield Announces Plans to Cover Hog Lagoons, Produce Renewable Energy.” North Carolina Health News, 28 Oct. 2018, www.northcarolinahealthnews.org/2018/10/29/smithfield-announces-plans-to-cover-hog-lagoons-produce-renewable-energy/.
- Michigan Agriculture Environmental Assurance Program. MAEAP Guidance Document For Comprehensive Nutrient Management Plans. 2015,www.maeap.org/uploads/files/Livestock/MAEAP_CNMP_Guidance_document_April_20_2015.pdf.
The authors are solely responsible for the content of these proceedings. The technical information does not necessarily reflect the official position of the sponsoring agencies or institutions represented by planning committee members, and inclusion and distribution herein does not constitute an endorsement of views expressed by the same. Printed materials included herein are not refereed publications. Citations should appear as follows. EXAMPLE: Authors. 2019. Title of presentation. Waste to Worth. Minneapolis, MN. April 22-26, 2019. URL of this page. Accessed on: today’s date.
Sand bedding for cows, is it a contaminant? Is it sustainable for our soils?
The question came up at an extension meeting on manure as to how adding 18,250 lbs. of sand per cow stall per year was impacting the soil. Words like a “it will take a long time” and “not sure” didn’t serve as satisfactory answers.
Upon talking to a soil scientist, I found in 25 to 50 years the soil texture could include 20% more sand, when using a vertical tillage system. By the look on his face I could tell that was not a good thing. This has led me to ask what impact will this have on our soil if it continues?
What did we find?
First, I confirmed the recommendation of 50 lbs. of sand per cow stall per day from the Dairyland Initiative. 50 lbs./ stall/ day x 365 days = 18,250 lbs./stall/year. About 2/3 of a dump truck per year per cow stall.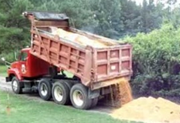
In surveying dairies in the Midwest, the average dairy has between 2 and 4 acres of land for which to spread manure, for each cow. At that rate, if equally spread, the dairy farmer will be adding between 4,550 lbs. and 9,125 lbs. per acre per year.
Also, in interviewing the farmers we found a majority of them utilize vertical tillage. In vertical tillage the top 3 inches of soil material is mixed. The sand will accumulate in the top 3” unless another system of tillage is utilized. At a rate of 4,550 – 9,125 lbs./year depending if you have 2, 3, 4 acres of area to spread your manure on with vertical tillage, it will take between 25 and 50 years to change the soil 20% more sand. Example-from a 40% loam to a 60% sandy loam.

W.H. Gardner published (1962) work he was doing on infiltration when there was a difference in soil texture. It showed when the pore space or texture differed, water infiltration slowed down.
If the pore space is smaller on top it will hold water tightly and will not allow it to infiltrate to the larger pore space until the pore spaces are filled up.
If the pore spaces are larger on top, the water more easily will move in the large spaces before moving downward once the upper pore spaces are filled.
We did an experiment adding 20% more sand to the top 3” of a glass cylinder (1). A second glass cylinder was filled with the same parent soil as the first (2).
Every soil will be unique, but in this trial, it took 5 minutes for the water to infiltrate to the bottom on the original parent soil (2). In the cylinder with sand added (1), it took 1 hour and 10 minutes to reach the bottom.
In several follow up trials with various soils the pattern was repeated. The sand added cylinder was significantly slower to let water in. Unlike the example with the cylinders we do not have a containment system on fields to hold the water in place until it can soak in. If our fields have no containment 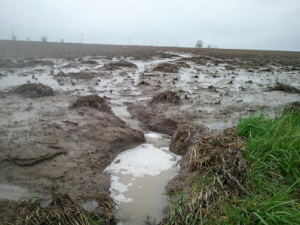 system around them the water will become runoff as in this picture.
As we add sand to the top 3“of soil, organic matter is diluted. Organic matter plays a part in several areas.
 Sand has a cation exchange of 10 or less. Organic matter significantly increases the cation exchange of the soil. More sand and less organic matter decrease the ability of the soil to retain nutrients, such as phosphorus. If we cannot hold onto the nutrients, nutrification of our waters will occur and have negative consequences for the environment.
A second benefit of organic matter is at a 3” depth, for each 1% of organic matter we lose, we also lose 13,500 gallons of water holding capacity. This is important for filling out ears of corn and maturation of crops in a timely manner.
Summary of what we have learned.
-
- The addition of sand at these levels decreases the rate of infiltration of rainfall causing runoff. This runoff takes with it soil, nutrients and the water we could use for our crops.
- The cation exchange decreases as sand dilutes the top 3” of vertically tilled fields. With a lower cation exchange, there is a decrease in the soils ability to hold nutrients. Nutrients the crops could use. Nutrients that cost money to provide. Nutrients in too abundant supply, do harm in our water system.
- A decrease in organic matter also decreases the ability of soils to hold water. For each 1% loss of organic matter we lose 13,500 gallons of water holding capacity.
- The quality per volume of manure is also diminished. As sand is added to the manure the % of N, P, K, and sulfur is diminished.
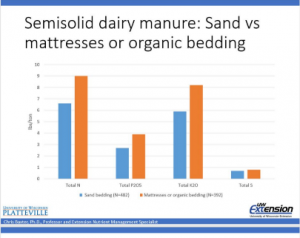
A definition of a contaminant is “either biological, chemical, physical or radiological substance that becomes harmful for humans or living organisms”. If sand bedding is not a contaminant, it acts like one.
Future plans.
The challenge is to make this information aware to dairy farmers and people who assist them in understanding the options available and making decisions. Specifically, the challenge is to be able to bring the future to the present so the ramifications of the current practice of adding 18,250 lbs. of sand per cow stall per year to our soils is recognized as unsustainable and another system can be implemented to benefit the soils.
Author
Mark Misch of DCC Waterbeds, markm@advancedcomforttechnology.com
Acknowledgements.
I would like to thank Professors Bill Bland and Francisco Arriaga-University of Wisconsin Department of Soil Science for their assistance. One of several videos showing the dynamics of water movement through the soil can be accessed by the following link. https://www.youtube.com/watch?v=ego2FkuQwxc
The authors are solely responsible for the content of these proceedings. The technical information does not necessarily reflect the official position of the sponsoring agencies or institutions represented by planning committee members, and inclusion and distribution herein does not constitute an endorsement of views expressed by the same. Printed materials included herein are not refereed publications. Citations should appear as follows. EXAMPLE: Authors. 2019. Title of presentation. Waste to Worth. Minneapolis, MN. April 22-26, 2019. URL of this page. Accessed on: today’s date.
Soil Type and Short-Term Survival of Porcine Epidemic Diarrhea Virus
Manure management practices recycle nutrients in animal manures for crop production. Harmful microbes and viruses in the manure are generally reduced in the soil environment over time. The soil properties influencing how long animal virus persistence are poorly understood and may be specific even down to the type of microbe present. Recently, porcine epidemic diarrhea virus (PEDV), which causes nearly 100% mortality in newborn piglets, has become a serious challenge for swine production. An important concern is whether PEDV in manure applied to nearby farmland may be a source for herd reinfection. How long will PEDV persist in the soil and still be infectious? Are some soils better suited to reduce PEDV risk?
What did we do?
A laboratory study was conducted to mimic a standard manure application practice (manure slurry application into soil) to determine if it reduced the potential for PEDV reinfection. In our study, we tested a range of soil types spiked with PEDV-positive manure slurry and evaluated how PEDV detection and potential infectious risk was affected by soil type. Quantitative PCR and live swine bioassays were used to enumerate PEDV and to determine whether manure and soil samples contained infectious PEDV (Stevens et al., 2018).
What have we learned?
Manure Slurry/Soil Incubations. PEDV genomes declined at different rates depending upon the type of soil tested (Figure 1). While PEDV declined rapidly and was not detected by PCR in Soil #1, #2, and #5 in just 24 hours, PEDV genomes in Soil #6 and #7 decreased more slowly the other soils. Soils #3 and #4 displayed an intermediate rate of decline and reached our detection limit at 48 hours. Soil is an important factor on PEDV persistence.
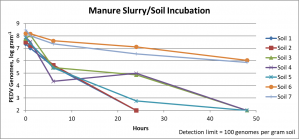
Swine Bioassay. Several of the samples tested positive for infections PEDV (Table 2) even when PCR indicated no virus was present; PCR molecular detection of the virus did not produce a complete picture of PEDV survival. For instance, the PCR method indicated no virus in soil #1 or #2 at 24 hours, yet the soil-manure mixture caused disease in a swine bioassay test—the gold standard test for infectious PEDV.
| Table 2. Outcome of Swine Bioassay | ||||||||
|---|---|---|---|---|---|---|---|---|
| Manure-slurry Soil Composite | ||||||||
| Time (hours) | #1 | #2 | #3 | #4 | #5 | #6 | #6 | |
| 24 | Pos | Pos | Neg | Pos | Neg | Neg | Pos | |
| 48 | Pos | Neg | Neg | Neg | Pos | Neg | Pos | |
†Animals inoculated by oral gavage of 10 mL of phosphate buffer-diluted sample. A porcine epidemic diarrhea virus positive (Pos) or negative (Neg) score is based on fecal swab molecular diagnostic test (reverse transcriptase quantitative polymerase chain reaction).
Are there any soil environmental factors that can help predict whether/how long infectious PEDV lasts in soils? Anything that would damage or disrupt the membrane or proteins on the outside of PEDV would render the virus non-infectious. Theoretically moist soils with lots of active bacteria would release enzymes to chew up PEDV proteins or alkaline (high pH) soils may denature PEDV proteins and damage membranes to inactivate PEDV. On the other hand, soils where manure rapidly dries would help preserve PEDV. None of these hypotheses could explain the PCR or swine bioassay results. Only one factor seemed related to PEDV persistence—high soil phosphorous seemed to protect the virus. No single factor seemed to destroy the virus.
Future Plans
Additional studies are underway determining where PEDV is found within three production sites and the surrounding environment immediately after an outbreak of PEDV. The sites will be monitored over 18 months to signs of PEDV re-emergence.
Authors
Corresponding author: Dan Miller, Research Microbiologist, USDA Agriculture Research Service; email: Dan.miller@ars.usda.gov
Other authors: Erin Stevens (Department of Animal Science, University of Nebraska – Lincoln); Amy Schmidt (Department of Biological Systems Engineering, University of Nebraska – Lincoln); Sarah Vitosh-Sillman and J. Dustin Loy (School of Veterinary Medicine and Biomedical Sciences, University of Nebraska – Lincoln).
Additional information
Stevens EE, Miller DN, Brittenham BA, Vitosh-Sillman SJ, Brodersen BW, Jin VL, et al. Alkaline stabilization of manure slurry inactivates porcine epidemic diarrhea virus. Journal of Swine Health and Production. 2018;26(2):95-100.
Acknowledgements
Funding for this research was provided by the National Pork Board and USDA Agriculture Research Service operational funds. USDA is an equal opportunity provider and employer.
The authors are solely responsible for the content of these proceedings. The technical information does not necessarily reflect the official position of the sponsoring agencies or institutions represented by planning committee members, and inclusion and distribution herein does not constitute an endorsement of views expressed by the same. Printed materials included herein are not refereed publications. Citations should appear as follows. EXAMPLE: Authors. 2019. Title of presentation. Waste to Worth. Minneapolis, MN. April 22-26, 2019. URL of this page. Accessed on: today’s date.
Separation Technologies for Capturing Nutrients from Manure
Exporting phosphorus and possibly nitrogen from larger livestock operations as well as regions of large livestock populations is often essential for protecting water quality. Solids (and nutrient) separation technologies are an option for concentrating nutrients for export. This webinar introduces three approaches to solids separation that are being applied in commercial settings. This presentation was originally broadcast on January 18, 2019. More… Continue reading “Separation Technologies for Capturing Nutrients from Manure”
Considerations for the use of Manure Irrigation Practices
In response to concerns about this practice, University of Wisconsin Extension convened a workgroup to examine the issues related to manure irrigation. This webinar shares their results and implications. This presentation was originally broadcast on June 15, 2018. More… Continue reading “Considerations for the use of Manure Irrigation Practices”
Determining Causes of Deep‐pit Swine Manure Foaming Issues and Potential Mitigation Strategies
Substantial new of information has been learned about the foaming process, its potential causes, and the different methods of addressing it. This presentation was originally broadcast on March 16, 2018. More… Continue reading “Determining Causes of Deep‐pit Swine Manure Foaming Issues and Potential Mitigation Strategies”
Making Sense of Treatment Technology Options for Livestock Farms
Have you ever wondered whether manure should be treated on your livestock operation? What technology will work best in your situation? This webinar discusses strategies for selecting the right technology to meet your farm’s needs and reviews some proven and emerging technologies that are showing promise for the dairy industry. This presentation was originally broadcast on February 16, 2018. More… Continue reading “Making Sense of Treatment Technology Options for Livestock Farms”
