USDA-NRCS and the National Air Quality Site Assessment Tool (NAQSAT) for Livestock and Poultry Operations

Proceedings Home | W2W Home w2w17 logo

Purpose

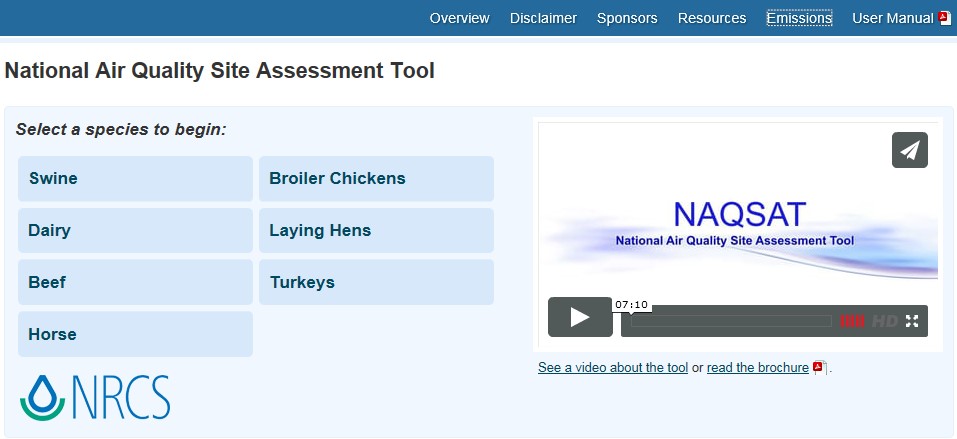
The National Air Quality Site Assessment Tool (NAQSAT) was developed as a first-of-its-kind tool to help producers and their advisors assess the impact of management on air emissions from livestock and poultry operations and identify areas for potential improvement related to those air emissions.

What did we do?

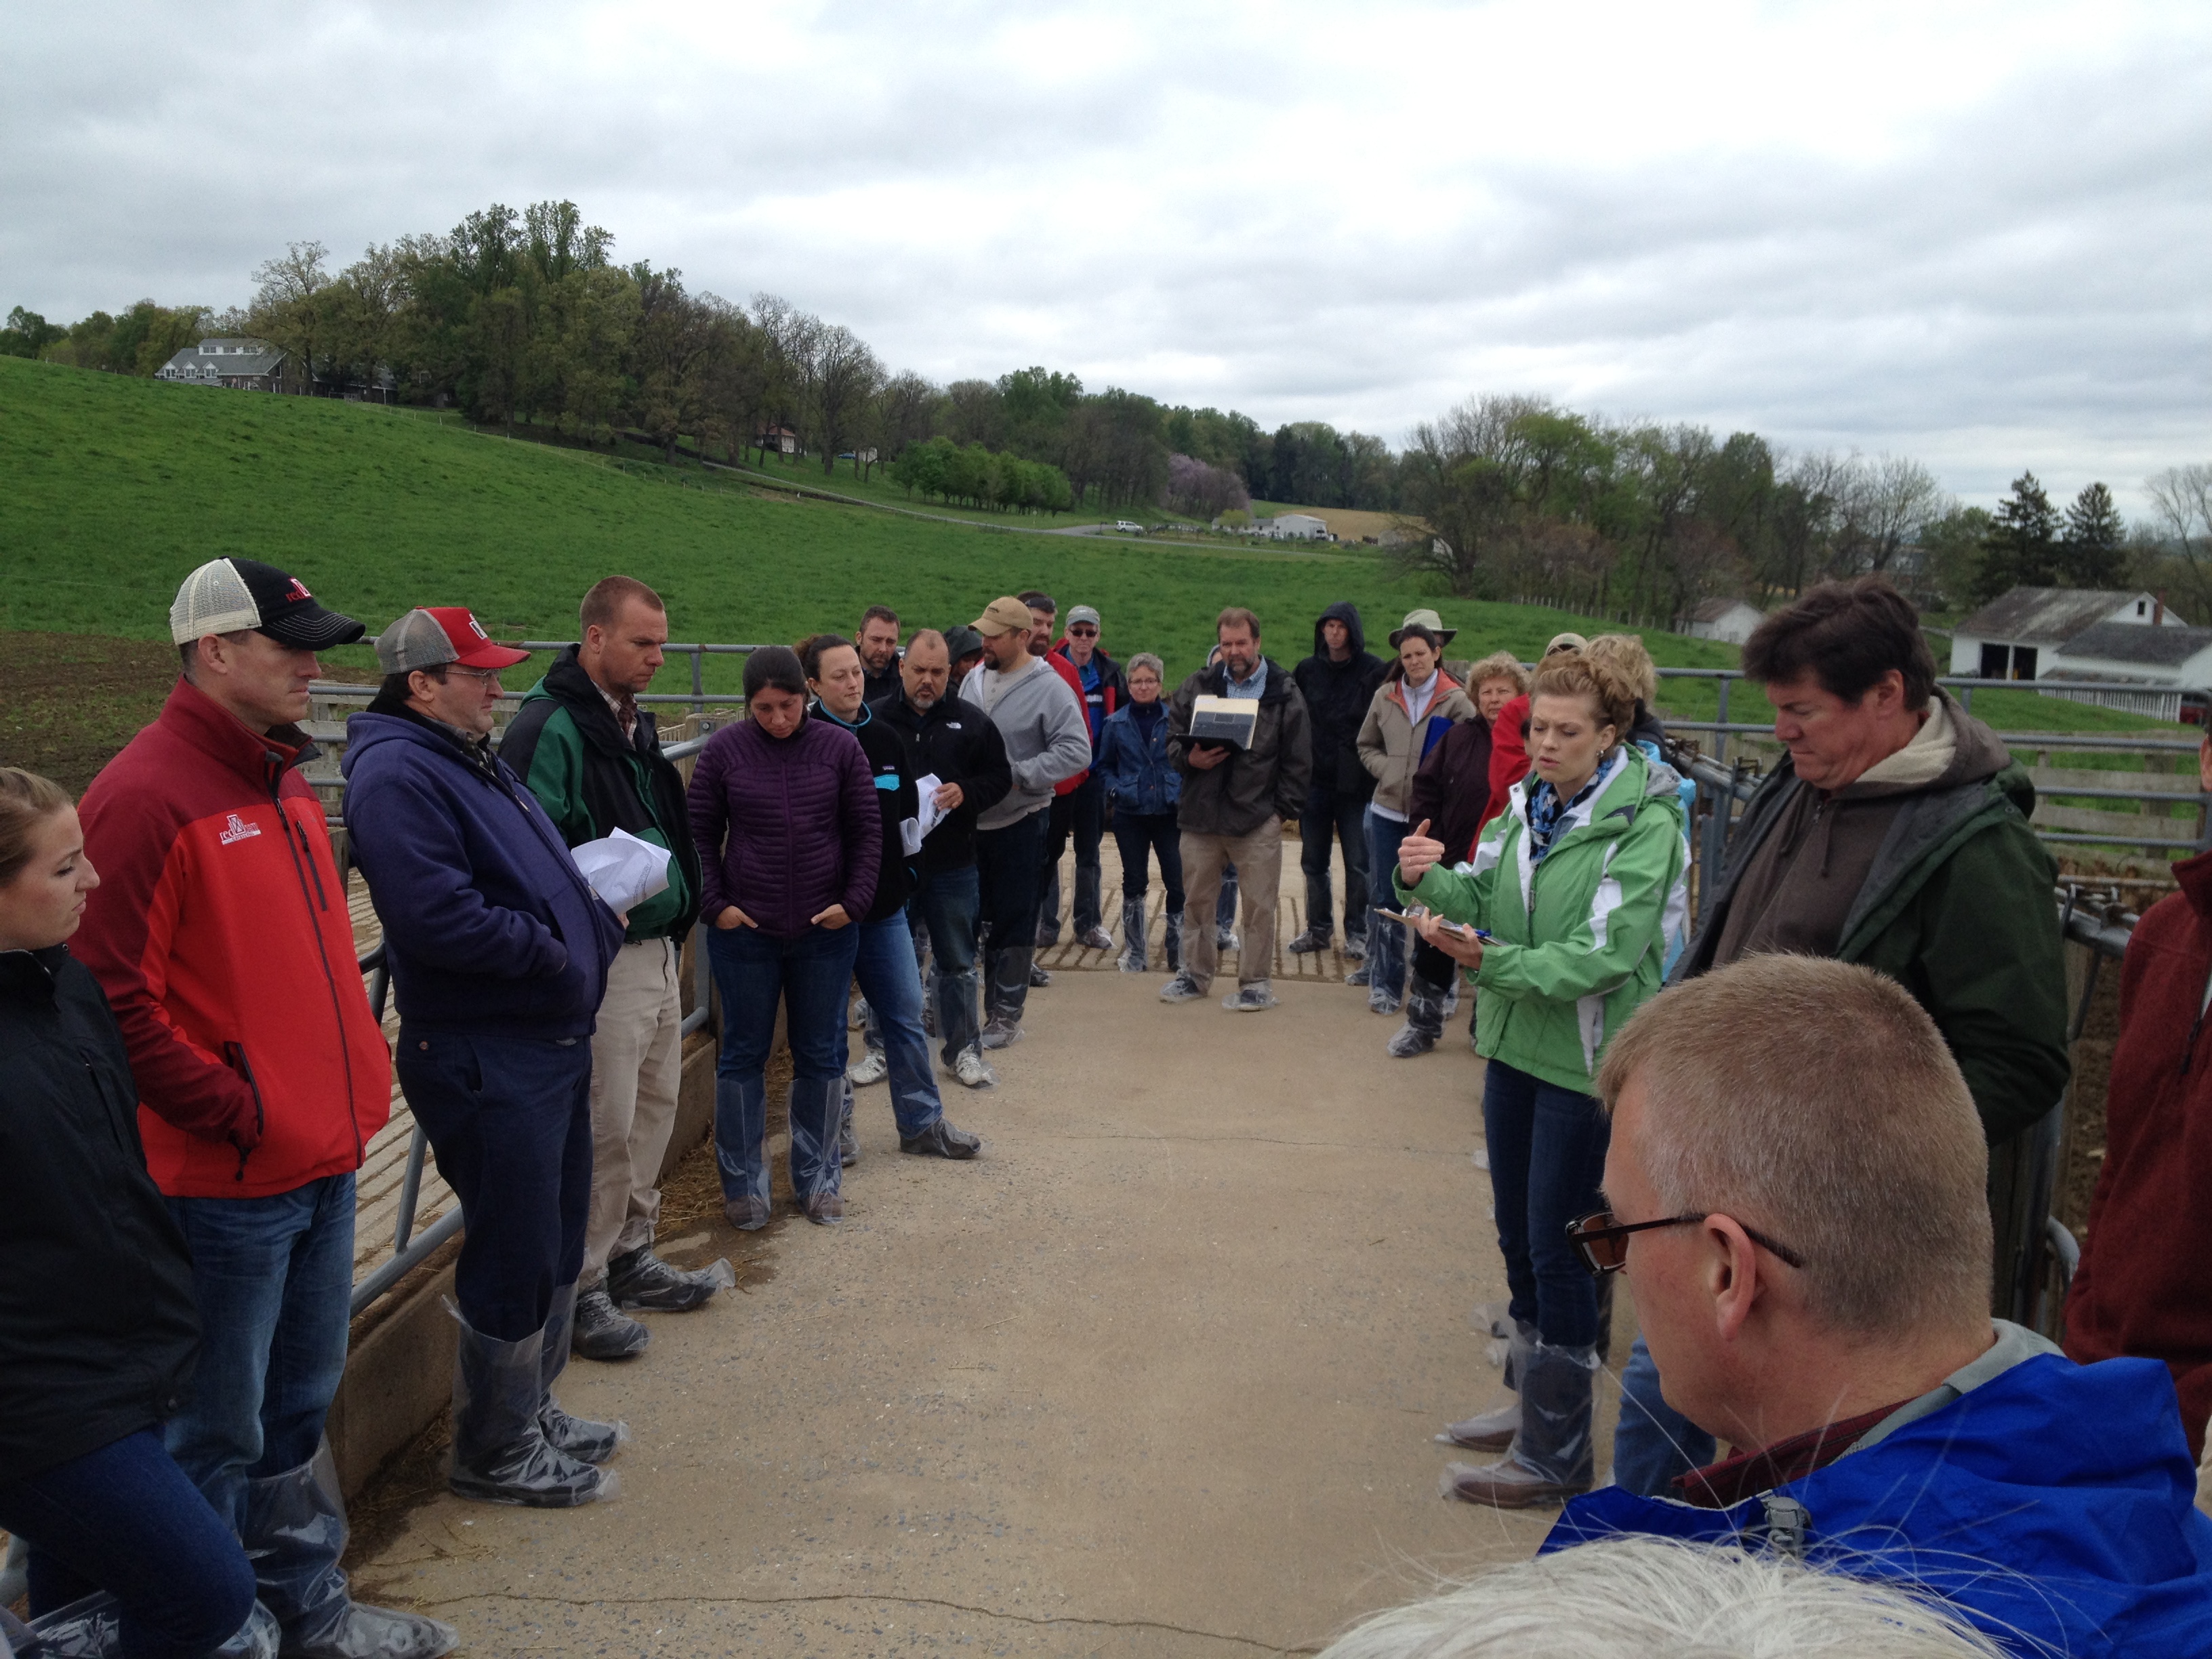
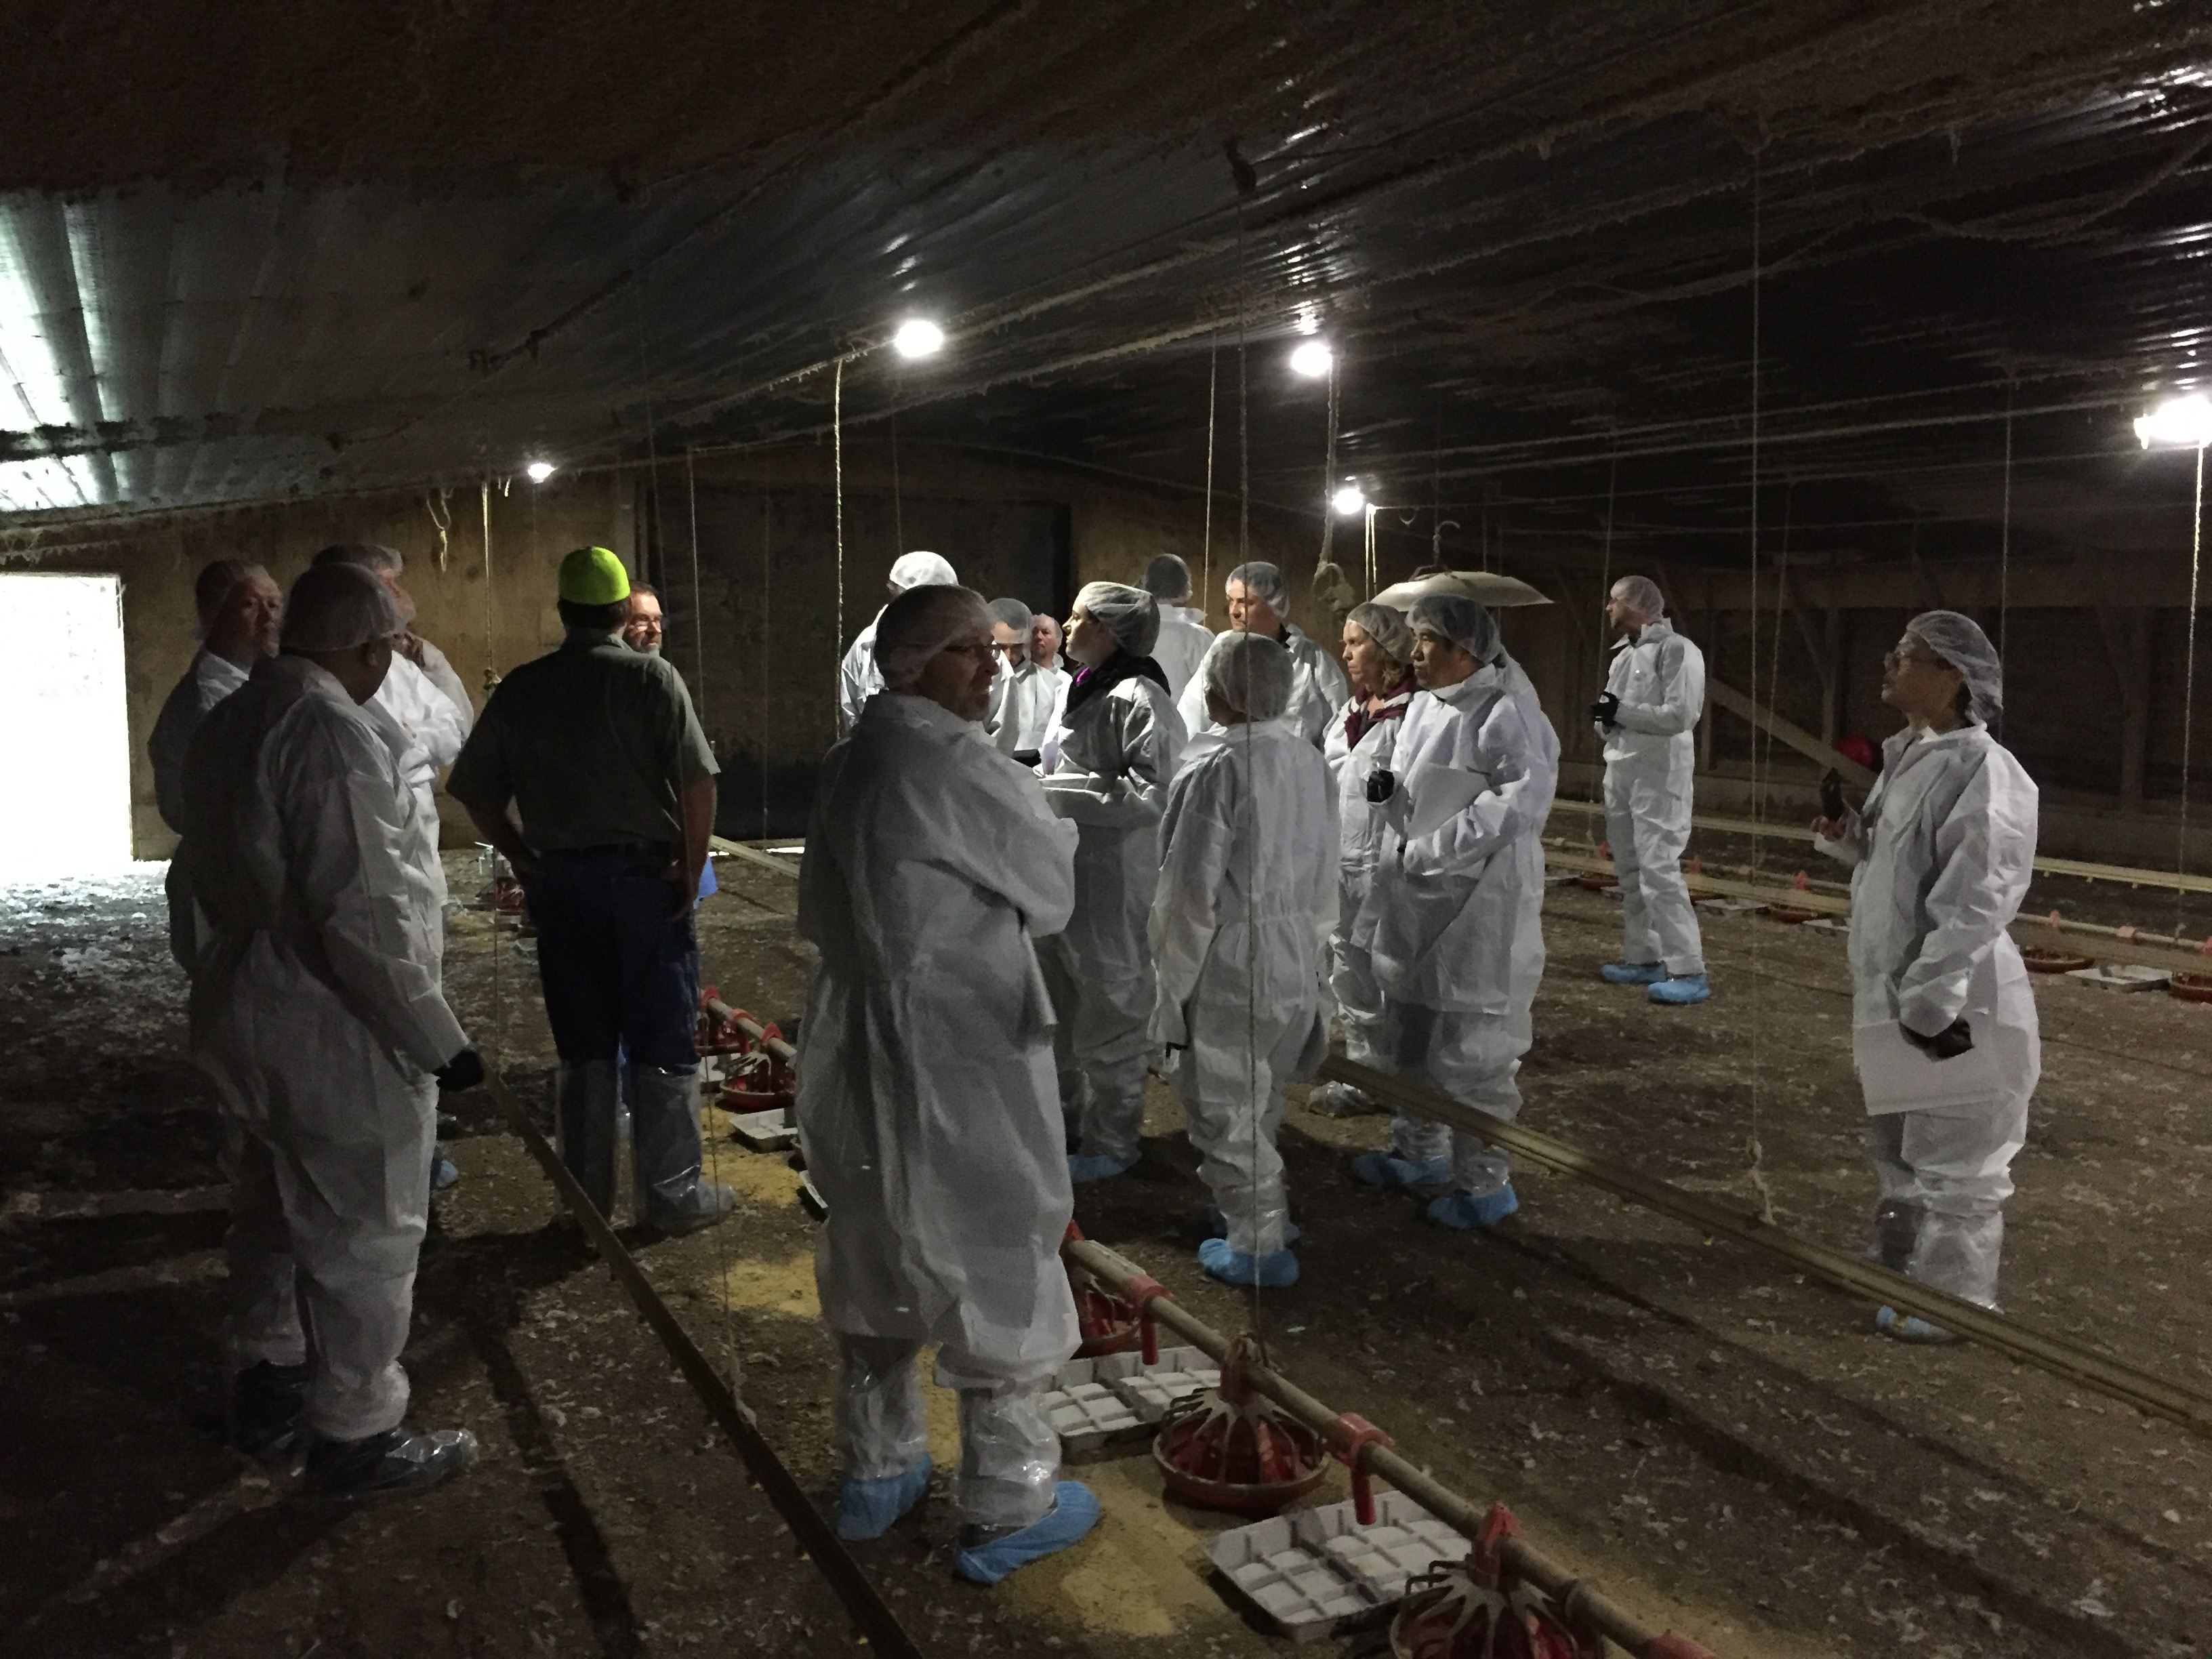
In 2007, several land-grant universities, with leadership from Michigan State University, began developing NAQSAT under a USDA-NRCS Conservation Innovation Grant (CIG). The initial tool included beef, dairy, swine, and poultry operations. A subsequent CIG project, with leadership from Colorado State University, made several enhancements to the tool, including adding horses to the species list. In 2015, USDA-NRCS officially adopted NAQSAT as an approved tool for evaluating air quality resource concerns at livestock and poultry operations. USDA-NRCS also contracted with Florida A&M University in 2015 to provide several regional training workshops on NAQSAT to NRCS employees. Six training workshops have been completed to date (Raleigh, NC; Modesto, CA; Elizabethtown, PA; Lincoln, NE; Richmond, VA; and Yakima, WA) with assistance from multiple NAQSAT development partners. Additionally, USDA-NRCS revised its comprehensive nutrient management plan (CNMP) policy in October 2015 to make the evaluation of air quality resource concerns mandatory as part of CNMP development.

Snippet from website of the National Air Quality Site Assessment Tool

Group photo of team in field

Zwicke in class lecturing

Zwicke and group in animal housing facility

What have we learned?

NAQSAT has proven to be a useful tool for bench-marking the air emissions impacts of current management on confinement-based livestock and poultry operations. In the training sessions, students have been able to complete NAQSAT runs on-site with the producer or producer representative via tablet or smartphone technologies. Further classroom discussion has helped to better understand the questions and answers and how the NAQSAT results can feed into the USDA-NRCS conservation planning process. Several needed enhancements and upgrades to the tool have been identified in order to more closely align the output of the tool to USDA-NRCS conservation planning needs. NAQSAT has also proven to be useful for evaluating the air quality resource concern status of an operation in relation to the CNMP development process.

Future Plans

It is anticipated that the identified needed enhancements and upgrades will be completed as funding for further NAQSAT development becomes available. Additionally, as use of NAQSAT by USDA-NRCS and our conservation planning and CNMP development partners expands, additional training and experience-building opportunities will be needed. The NAQSAT development team has great geographic coverage to assist in these additional opportunities.

Corresponding author, title, and affiliation

Greg Zwicke, Air Quality Engineer – Air Quality and Atmospheric Change Team, USDA-NRCS

Corresponding author email

greg.zwicke@ftc.usda.gov

Other authors

Greg Johnson, Air Quality and Atmospheric Change Team Leader, USDA-NRCS; Jeff Porter, Animal Nutrient and Manure Management Team Leader, USDA-NRCS; Sandy Means, Agricultural Engineer – Animal Nutrient and Manure Management Team, USDA-NRCS

Additional information

naqsat.tamu.edu

https://lpelc.org/naqsat-for-swine-and-poultry

https://lpelc.org/naqsat-for-beef-and-dairy/

Acknowledgements

C.E. Meadows Endowment, Michigan State University

Colorado Livestock Association

Colorado State University

Florida A&M University

Iowa Turkey Federation

Iowa Pork Producers

Iowa Pork Industry Center

Iowa State University

Iowa State University Experiment Station

Kansas State University

Michigan Milk Producers Association

Michigan Pork Producers Association

Michigan State University

Michigan State University Extension

National Pork Board

Nebraska Environmental Trust

Oregon State University

Penn State University

Purdue University

Texas A&M University

University of California, Davis

University of Georgia

University of Georgia Department of Poultry Science

University of Idaho

University of Maryland

University of Maryland Department of Animal and Avian Sciences

University of Minnesota

University of Missouri

University of Nebraska

USDA-ARS

Virginia Tech University

Washington State University

Western United Dairymen

Whatcom County (WA) Conservation District

The authors are solely responsible for the content of these proceedings. The technical information does not necessarily reflect the official position of the sponsoring agencies or institutions represented by planning committee members, and inclusion and distribution herein does not constitute an endorsement of views expressed by the same. Printed materials included herein are not refereed publications. Citations should appear as follows. EXAMPLE: Authors. 2017. Title of presentation. Waste to Worth: Spreading Science and Solutions. Cary, NC. April 18-21, 2017. URL of this page. Accessed on: today’s date.

Nitrogen and Phosphorus Cycling Efficiency in US Food Supply Chains – A National Mass-Balance Approach


Proceedings Home | W2W Home w2w17 logo

Purpose 

Assessing and improving the sustainability of livestock production systems is essential to secure future food production. Crop-livestock production systems continue to impact nitrogen (N) and phosphorus (P) cycles with repercussions for human health (e.g. secondary particle formation due to ammonia emission and drinking water contamination by nitrate) and the environment (e.g. eutrophication of lakes and coastal waters and exacerbation of hypoxic zones). Additionally, P is a limited resource, and sustaining an adequate P supply is a major emerging challenge. To develop strategies for a more sustainable use of N and P, it is essential to have a quantitative understanding of the flows and stocks of N and P within the society. In this study, we developed detailed national N and P budgets to assess nutrient cycling efficiency in US (livestock) food supply chains, to identify hotspots of nutrient loss and to indicate opportunities for improvement!

What did we do? 

1. National nutrient mass-balance

A mass-balance framework was developed to quantify nutrient flows within the US. In this framework, the national US system is represented by 9 major sectors are relevant in terms of nutrient flows: mining (relevant for P only), industrial production, agriculture, food & feed processing industry, retail, households and other consumers, energy and transport, humans, and waste treatment. These sectors can exist of several sub-sectors. For example, the agricultural sector consists of several secondary sub-systems including pasture, agricultural soil, livestock and manure management (WMS – waste management system).

Different livestock categories can have distinct environmental impacts and nutrient use efficiencies (e.g. (Hou et al. 2016), (Eshel et al. 2014), (Herrero et al. 2013)), we therefore distinguish six livestock categories (dairy cattle, beef cattle, poultry (meat), poultry (layers), sheep, hogs) and

 their associated food commodities (dairy products, beef from dairy cattle, beef, poultry, eggs, lamb, pork).

For each sub-system, we identify and quantify major flows to and from this compartment. All flows are expressed in a common unit, i.e. metric kiloton N per year (kt N/yr) for nitrogen and metric kiloton P per year (kt P/yr) for phosphorus. Quantified flows include nutrient related emissions to the environment and waste flows.

At present, the waste sectors and environmental compartment are outside the system boundaries, that is, we quantify flows to these compartments, but we do not attempt to balance these sectors. We do, however, keep track of the exact chemical species (e.g. emission of N2O-N to air instead of N to air) emitted as far as possible. The municipal waste treatment (MSW) and municipal waste water treatment (WWTP) are treated in more detail: major flows from and to these compartments are quantified. These sub-sectors are treated in more detail because of their role in nutrient recycling through e.g. sewage sludge application on agricultural soils.

Data were collected in priority from national statistics (e.g. USDA NASS for livestock population) and peer-reviewed literature, and were supplemented with information from industrial reports and extension files if needed. If available, data were collected for the years 2009 to 2012 and averaged, when unavailable, we collected data for the closest year.

2. Scenario analysis

In the scenario analysis, we test the opportunity for dairy livestock production systems to contribute to a more efficient nutrient use through anaerobic co-digestion of dairy manure and organic food waste. Recently, Informa Economics assessed the national

 market potential of anaerobic digester products for the dairy industry (Informa Economics 2013). Next to a reduction in greenhouse gas emissions, anaerobic co-digestion of dairy manure and organic food waste can contribute to improve nutrient cycling efficiency (Informa Economics 2013). Dairy manure contains high levels of nitrogen and phosphorus, which can be used as a natural crop fertilizer, if recuperated from manure. Presently, non-farm organic substrates such as food waste are typically disposed of in landfills, which causes greenhouse gas (GHG) emissions and also results in a permanent removal of valuable nutrients from the food supply chain (Informa Economics 2013). By anaerobic co-digestion, a part of the nutrien! ts contai ned in dairy manure and food waste can be recovered. These nutrients can be used to fertilize crops and substitute synthetic fertilizer application. In the scenario analysis, we test to what extent anaerobic co-digestion of dairy manure and food waste can contribute to improve nutrient cycling efficiency, particularly by substituting synthetic fertilizers. We develop the scenario based on data provided in the InformaEconomics report.

What have we learned? 

In general, our results show that livestock production is the least efficient part of the total food supply chain with large losses associated with manure management and manure and fertilizer application to crops. In absolute terms, the contribution of the household stage to total and N and P losses from the system is small, approximately 5 and 7% for N and P, respectively. However, households ‘waste’ a relatively large percentage of purchased products, (e.g. 16% and 18% of N and P in dairy products end up as food waste), which presents an opportunity for improvement. A scenario was developed to test to what extent anaerobic co-digestion of dairy manure and food waste can contribute to improving nutrient cycling efficiency on a national scale. Results suggest that 22% and 63% of N and P applied as synthetic fertilizer could potentially be avoided in dairy food supply chains by large scale implementation of anaerobic co-digestion o! f manure and food waste.

Future Plans     

Future research plans include a further development of scenarios that are known to reduce nutrient losses at the farm scale and to assess the impact of these scenarios on national nutrient flows and losses.

Corresponding author, title, and affiliation        

Karin Veltman, PhD, University of Michigan, Ann Arbor

Corresponding author email    

veltmank@umich.edu

Other authors    

Carolyn Mattick, Phd, Olivier Jolliet, Prof., Andrew Henderson, PhD.

Additional information                

Additional information can be obtained from the corresponding author: Karin Veltman, veltmank@umich.edu

Acknowledgements       

The authors wish to thank Ying Wang for her scientific support, particularly for her contribution in developing the anaerobic co-digestion scenario.

This work was financially supported by the US Dairy Research Institute.


The authors are solely responsible for the content of these proceedings. The technical information does not necessarily reflect the official position of the sponsoring agencies or institutions represented by planning committee members, and inclusion and distribution herein does not constitute an endorsement of views expressed by the same. Printed materials included herein are not refereed publications. Citations should appear as follows. EXAMPLE: Authors. 2017. Title of presentation. Waste to Worth: Spreading Science and Solutions. Cary, NC. April 18-21, 2017. URL of this page. Accessed on: today’s date.

Planning for Resilience: Using Scenarios to Address Potential Impacts of Climate Change for the Northern Plains Beef System

Proceedings Home W2W Home w2w17 logo

Purpose

Resiliency to weather extremes is a topic that Northern Plains farmers and ranchers are already familiar with, but now climate change is adding new uncertainties that make it difficult to know the best practices for the future. Scenario planning is a method of needs assessment that will allow Extension and beef system stakeholders to come together using the latest climate science to discover robust management options, highlight key uncertainties, prioritize Extension programming needs, and provide an open forum for discussion for this sometimes controversial topic.

Overall objectives:

1. Determine a suite of key future scenarios based on climate science that are plausible, divergent, relevant, and challenging to the beef industry.

2. Determine robust management options that address the key scenario drivers.

3. Develop a plan for Extension programming to address determined educational needs.

What did we do?

A team of researchers, Extension specialists, and educators was formed with members from University of Nebraska and South Dakota State University. They gathered the current research information on historical climate trends, projections in future climate for the region, and anticipated impacts to the beef industry. These were summarized in a series of white papers.

Three locations were selected to host two half day focus groups, representing the major production regions. A diverse group representing the beef industry of each region including feedlot managers, cow calf ranchers, diversified producers, veterinarians, bankers, NRCS personnel, and other allied industries. The first focus group started with a discussion of the participants past experiences with weather impacts. The team then provided short presentations starting with historic climate trends and projection, anticipated impacts, and uncertainties. The participants then combined critical climate drivers as axis in a 2×2 grids, each generating a set of four scenarios. They then listed impacts for each combination. The impacts boundaries were feed production through transporting finished cattle off-farm.

Project personnel then combined the results of all three locations to prioritize the top scenarios, which were turned into a series of graphics and narratives. The participants were then brought together for a second focus group to brainstorm management and technology options that producers were already implementing or might consider implementing. These were then sorted based on their effectiveness across multiple climate scenarios, or robustness. The options where also sorted by the readiness of the known information: Extension materials already available, research data available but few Extension materials, and research needed.

Graphic depicting warm/dry, warm/wet, cold/dry, cold/wet conditions on the farm during winter-spring

Graphic depicting hot/dry, hot/wet, cool/dry, cool/wet conditions on the farm during summer-fall

What have we learned?

The key climate drivers were consistent across all focus groups: temperature and precipitation, ranging from below average to above average. In order to best capture the impacts, the participants separated winter/spring and summer/fall.

This method of using focus groups as our initial interaction with producers on climate change was well received. Most all farmers love to talk about the weather, so discussing historical trends and their experiences with it as well as being upfront with the uncertainties in future projections, while emphasizing the need for proactive planning seemed to resonate.

With so many competing interests for producers’ time, as well as a new programming area, it was critical to have trusted local educators to invite participants. Getting participants to the second round of focus groups was also more difficult, so future efforts should considering hosting a single, full day focus group, or allowing the participants to set the date for the second focus group, providing more motivation to attend.

Future Plans

The scenarios and related management options will be used to develop and enhance Extension programming and resources as well as inform new research efforts. The goal is to provide a suite of robust management options and tools to help producers make better decisions for their operation.

Corresponding author, title, and affiliation

Crystal Powers, Extension Engineer, University of Nebraska – Lincoln

Corresponding author email

cpowers2@unl.edu

Other authors

Rick Stowell, Associate Professor at University of Nebraska – Lincoln

Additional information

Crystal Powers

402-472-0888

155 Chase Hall, East Campus

Lincoln, NE 68583

Acknowledgements

Thank you to the project team:

University of Nebraska – Lincoln: Troy Walz, Daren Redfearn, Tyler Williams, Al Dutcher, Larry Howard, Steve Hu, Matthew Luebbe, Galen Erickson, Tonya Haigh

South Dakota State University: Erin Cortus, Joseph Darrington,

This project was supported by the USDA Northern Plains Regional Climate Hub and Agricultural and Food Research Initiative Competitive Grant No. 2011-67003-30206 from the USDA National Institute of Food and Agriculture.

The authors are solely responsible for the content of these proceedings. The technical information does not necessarily reflect the official position of the sponsoring agencies or institutions represented by planning committee members, and inclusion and distribution herein does not constitute an endorsement of views expressed by the same. Printed materials included herein are not refereed publications. Citations should appear as follows. EXAMPLE: Authors. 2017. Title of presentation. Waste to Worth: Spreading Science and Solutions. Cary, NC. April 18-21, 2017. URL of this page. Accessed on: today’s date.

Field Technology & Water Quality Outreach

Proceedings Home | W2W Home waste to worth 2017 logo

Purpose

In 2015, Washington State Department of Agriculture (WSDA) partnered with local and state agencies to help identify potential sources of fecal coliform bacteria that were impacting shellfish beds in northwest Washington.  WSDA and Pollution Identification and Correction (PIC) program partners began collecting ambient, as well as rain-driven, source identification water samples. Large watersheds with multiple sub-basins, changing weather and field conditions, and recent nutrient applications, meant new sites were added almost daily. The increased sampling created an avalanche of new data. With this data, we needed to figure out how to share it in a way that was timely, clear and could motivate change. Picture of water quality data via spreadsheet, graphs, and maps.

Conveying complex water quality results to a broad audience can be challenging. Previously, water quality data would be shared with the public and partners through spreadsheets or graphs via email, meetings or quarterly updates. However, the data that was being shared was often too late or too overwhelming to link locations, weather or field conditions to water quality. Even though plenty of data was available, it was difficult for it to have meaningful context to the general public.

Ease of access to results can help inform landowners of hot spots near their home, it can link recent weather and their own land management practices with water quality, as well as inform and influence decision-making.

What Did We Do?

Using basic GIS tools we created an interactive map, to share recent water quality results. The map is available on smartphones, tablets and personal computers, displaying near-real-time results from multiple agencies.  Viewers can access the map 24 hours a day, 7 days a week.

We have noticed increPicture of basic GIS tool.
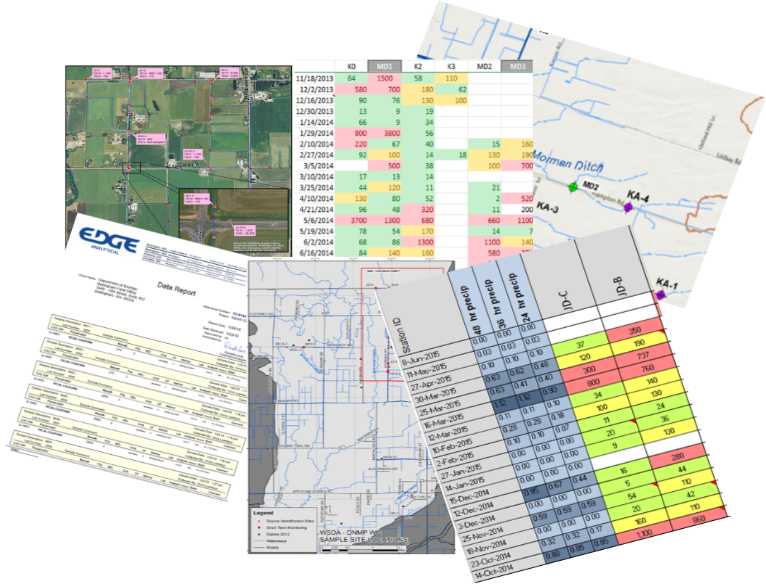
ased engagement from our dairy producers, with many checking the results map regularly for updates. The map is symbolized with graduated stop light symbology, with poor water quality shown in red and good in green. If they see a red dot or “hot spot” in their neighborhood they may stop us on the street, send an email, or call with ideas or observations of what they believe may have influenced water quality. It has opened the door to conversations and partnerships in identifying and correcting possible influences from their farm.

The map also contains historic results data for each site, which can show changes in water quality. It allows the viewer to evaluate if the results are the norm or an anomaly. “Are high results after a rainfall event or when my animals are on that pasture?”

The online map has also increased engagement with our Canadian neighbors to the north. By collecting samples at the US/Canadian border we have been able to map streams where elevated bacteria levels come across the border. This has created an opportunity to partner with our Canadian counterparts to continue to identify and correct sources.

What Have We Learned?

You do not need to be a GIS professional to create an app like this for your organization. Learning the system and fine-tuning the web application can take some time, but it is well worth the investment. GIS skills derived from this project have proven invaluable as the app transfers to other areas of non-point work.  The web application has created great efficiencies in collaboration, allowing field staff to quickly evaluate water quality trends in order to spend their time where it is most needed. The application has also provided transparency to the public regarding our field work, demonstrating why we are sampling particular areas.

From producer surveys, we have learned that viewers prefer a one-stop portal for information. Viewers are less concerned about what agency collected the data as they are interested in what the data says. This includes recent, as well as historical water quality data, field observations; such as wildlife or livestock presence or other potential sources. Also, a brief weekly overview of conditions, observations and/or trends has been requested to provide additional context.

Future Plans

The ease and efficiency of the mobile mapping and data sharing has opened the door to other collaborative projects. Currently we are developing a “Nutrient Tracker” application that allows all PIC partners to easily update a map from the field. The map allows the user to log recent field applications of manure. Using polygons to draw the area on the field, staff can note the date nutrients were identified, type of application, proximity to surface water, if it was a low-, medium- or high-risk application, if follow-up is warranted, and what agency would be the lead contact. This is a helpful tool in learning how producers utilize nutrients, to refer properties of concern to the appropriate agency, and to evaluate recent water quality results against known applications.

Developing another outreach tool, WSDA is collecting 5 years of fall soil nitrate tests from all dairy fields in Washington State. The goal is to create a visual representation of soil data, to demonstrate to producers how nitrate levels on fields have changed from year to year, and to easily identify areas that need to be re-evaluated when making nutrient application decisions.

As part of a collaborative Pollution Identification and Correction (PIC) group, we would like to create a “Story Map” that details the current situation, why it is a concern, explain potential sources and what steps can be taken at an individual level to make a difference. A map that visually demonstrates where the watersheds are and how local neighborhoods really do connect to people 7 miles downstream.  An interactive map that not only shows sampling locations, but allows the viewer to drill down deeper for more information about the focus areas, such as pop-ups that explain what fecal coliform bacteria are and what factors can increase bacteria levels. We envision a multi-layer map that includes 24-hour rainfall, river rise, and shellfish bed closures. This interactive map will also share success stories as well as on-going efforts.

Author

Kerri Love, Dairy Nutrient Inspector, Dairy Nutrient Management Program, Washington State Department of Agriculture

klove@agr.wa.gov

Additional Information

Results Map Link: http://arcg.is/1Q9tF48

Washington Shellfish Initiative: http://www.governor.wa.gov/issues/issues/energy-environment/shellfish

Mobile Mapping Technology presentation by Michael Isensee, 2016 National CAFO Roundtable

Sharing the Data: Interactive Maps Provide Rapid Feedback on Recent Water Quality and Incite Change by Educating the Public, Kyrre Flege, Washington State Department of Agriculture and Jessica Kirkpatrick, Washington State Department of Ecology,  2016 National Non-Point Source Monitoring Workshop

Whatcom County PIC Program: http://www.whatcomcounty.us/1072/Water-Quality

Skagit County, Clean Samish Initiative: https://www.skagitcounty.net/Departments/PublicWorksCleanWater/cleansamish.htm

Lower Stillguamish PIC Program: http://snohomishcountywa.gov/3344/Lower-Stilly-PIC-Program

GIS Web Applications: http://doc.arcgis.com/en/web-appbuilder/

Acknowledgements

The web application was a collaborative project developed by Kyrre Flege, Washington State Department of Agriculture and Jessica Kirkpatrick, Washington State Department of Ecology.

The authors are solely responsible for the content of these proceedings. The technical information does not necessarily reflect the official position of the sponsoring agencies or institutions represented by planning committee members, and inclusion and distribution herein does not constitute an endorsement of views expressed by the same. Printed materials included herein are not refereed publications. Citations should appear as follows. EXAMPLE: Authors. 2017. Title of presentation. Waste to Worth: Spreading Science and Solutions. Cary, NC. April 18-21, 2017. URL of this page. Accessed on: today’s date.

Comprehensive Physiochemical Characterization of Poultry Litter: A First Step Towards Manure Management Plans in Argentina


Proceedings Home W2W Home w2w17 logo

Purpose 

For the last decade, Argentinian CAFO’s have been increasing in number and size. Poultry farming showed remarkable growth and brought to light the absence of litter and nutrient management plans. Land application of poultry litter is the most common practice, but there is insufficient data to support recommended agronomic rates of application.

In this study, we developed the first comprehensive physiochemical characterization of poultry litter to accurately state average nutrient concentrations and data variability to support development of future litter best management practices. Simultaneously, we estimated the crop fertilization potential of poultry litter in Entre Rios Province.

What did we do? 

Entre Rios Province contributes 51% of total Argentinian broiler production, holding over 2,600 chicken farms. Thus, the Ministry of Agriculture Industry contacted integrated broiler farmers, which all seemed to share a modern production protocol related to housing conditions, feed ration, and bedding management, and who were willing to participate in the sampling project. A sampling protocol was written following recognized literature sources (Zhang and Hamilton) and hands-on training sessions were developed with producers in charge of poultry litter sampling. A total of 55 broiler farms were sampled with 3 replicates per farm.

The following parameters were selected for analysis: organic matter, total nitrogen, ammoniacal nitrogen, organic nitrogen, phosphorus, potassium, calcium, magnesium, sodium, zinc, copper, electrical conductivity, pH and moisture content. Analytical procedures were stated with a certified local lab following recommended methods for manure analysis. A survey was also conducted at each sampling farm to assess variability on bedding age and material.

What have we learned? 

The average stocking density was 11.3 chickens/m2. The number of flocks grown on the litter before house cleaning ranged from 1 to 11 with an average of 4.7. However, 47.3% of the farms’ litter had less than 5 flocks while 52.7% presented 5 or more flocks. There was no significant correlation between the physiochemical parameters measured and bird density, nor with the number of flocks raised on the litter.

Table 1. Litter Type

Litter Type Farms (%)
Woodchips 50.91
Rice hulls 23.64
Woodchips + rice hulls 21.82
Peanut hulls  3.63

While total nitrogen (TN) and phosphorus means were comparable to normal values reported in U.S. literature (Britton and Bullard; Zhang et al.), the variability of data was significant. Table 2 shows a summary of the most relevant analytical results obtained.

Table 2. Physical and Chemical Average Litter Composition (Dry Basis). SEM*: Standard Error of the Mean

  Mean SEM* St. Deviation C.V. (%)
Organic matter (%) 79.13 0.62 4.61 5.82
Total nitrogen (%) 2.96 0.05 0.38 12.86
Phosphorus (%) 0.97 0.04 0.30 30.83
Sodium (%) 0.41 0.02 0.16 39.42
Electrical conductivity (mmhos/cm) 8.63 0.49 3.66 42.48
pH (I.U.) 7.56 0.04 0.31 4.07
Moisture content (%) 31.50 0.63 4.65 14.78

The coefficients of variation were especially high for phosphorus, sodium and electrical conductivity. This could be a critical factor governing poultry litter land application rates that promote neither phosphorus loss via surface runoff nor buildup of salts or sodium in the soil profile.

Raising over 359 million chickens annually, broiler litter value in Entre Rios Province would surpass 51 million dollars if it were fully used as commercial fertilizer substitute. Based upon the average nutrient content, 51,100 tons of nitrogen, 17,100 tons of phosphorus and 23,600 tons of potassium would be available; enough to fertilize 349,000 hectares of corn based upon crop nitrogen requirements whilst a plan based upon phosphorus would supply 629,000 hectares. Other critical factors like storage duration of litter outdoors, land application method, and the availability of litter nitrogen will impact the final calculation of plant available nitrogen (PAN), which is generally assumed to be 50% of TN when surface applied (Chastain et al.). Entre Rios farmers sow around 245,000 hectares of corn annually, hence 71% of the planted area could potentially be fully nitrogen fertilized using broiler litter instead of commercial fertilizer.

These results showed that while there is strong potential for litter land application at agronomic rates in Entre Rios, individual litter samples properly taken and analyzed are still needed to sustain environmentally sound nutrient management plans due to the large variability of the analytical results.

Future Plans    

The information presented will be utilized as input data for developing draft Broiler Farms’ Nutrient Management Plans that will serve as a model for other Argentinian CAFO. Currently, laboratory results from Buenos Aires Province hen farms are being analyzed.

Corresponding author, title, and affiliation        

Roberto Maisonnave, President at AmbientAgro – International Environmental Consulting

Corresponding author email   

robermaison@hotmail.com

Other authors   

Karina Lamelas, Director of Poultry and Swine Production at Ministry of Agriculture (Argentina). Gisela Mair, Ministry of Agriculture (Argentina). Norberto Rodriguez, Ministry of Agricultrue and University of Tres de Febrero (Argentina).

Additional information 

Britton, J. and G. Bullard. 1998 Summary of Poultry Litter Samples in Oklahoma. Oklahoma Cooperative Extension Service. CR-8214.

J. Chastain, J. Camberato and P. Skewes. Poultry manure production and nutrient content. Poultry Training Manual. Clemson University. http://www.clemson.edu/extension/camm/manuals/poultry_toc.html

Maisonnave, R.; Lamelas, K. y G. Mair. Buenas prácticas de manejo y utilización de cama de pollo y guano. Ministerio de Agroindustria de la Nación Argentina. 2016.

Zhang, H. and D. Hamilton. Sampling animal manure. Oklahoma Cooperative Extension Service. PSS-2248.

Zhang, H.; Hamilton, D. and J. Payne. Using Poultry Litter as Fertilizer. Oklahoma Cooperative Extension Service. PSS-2246.

Acknowledgements       

Dr. Jorge Dillon and Ing. José Noriega (SENASA)

Ing. Agr. Juan Martin Gange and Lic. Corina Bernigaud (INTA)

Ing. Agr. Alan Nielsen and M. Vet. Juan Nehuén Rossi (Granja Tres Arroyos)

Lic. Pablo Marsó (Las Camelias)

Sra. Nancy Dotto (Soychú)

Nutrient Leaching Under Manure Staging and Sludge-Drying Areas

Proceedings Home W2W Home w2w17 logo

Purpose

Even well managed lagoons need to have sludge removed periodically. Hauling of sludge is expensive and time consuming. Drying of the sludge before hauling would greatly reduce the volume and therefore the number of trips required. This would result in both an economic and time savings. In Utah, sludge drying is currently not permitted due to the potential for groundwater contamination since it is considered a liquid.

What did we do?

Two studies examined leaching under sludge drying and manure staging areas. The first study compared the leachate under a sludge drying area (liquid manure), versus the leachate produced under a manure staging area (solid manure). Both treatments were placed in the field in July. The second study compared manure staging areas with manure placed at three different times (November, January, and March) and two different bedding materials (straw, no straw).

Leachate was collected by means of zero-tension lysimeters installed under the sludge drying and manure staging areas and analyzed for ammonium nitrogen using Method 10-107-06-2-O and nitrate nitrogen using Method: 10-107-04-1-C on a Lachat FIA analyzer. Soil samples were taken to a depth of 90 cm and analyzed for nitrate nitrogen using Method 12-107-04-1-F on a Lachat FIA analyzer.

Graph of leachate collected by manure type in 2015 and 2016 with straw and with no straw
Total leachate collected under winter manure staging areas by manure type.

Graph of leachate collected by placement time in 2015 and 2016
Total leachate collected under winter manure staging areas by placement time.

What have we learned?

The sludge dried in 8-10 weeks. Observed volume reduction for the July applications was 81.1% and 35.7% for the sludge and manure piles, respectively. Leachate under the sludge drying areas tended to seal off quickly producing little leachate after the initial leaching event. Likewise, there was little leachate under the manure staging piles placed in July. Significant leachate was produced under the manure staging piles placed during the winter months, with the manure with no straw (sand bedding) producing more leachate than the manure with straw (straw bedding). Preliminary results indicate that sludge drying produces less leachate than a manure staging area placed at the same time, and much less leachate than manure staging areas placed during the winter months.

Future Plans

We plan to continue this study and report the findings to the Utah Division of Water Quality. The results of this study and another study examining sludge drying in southern Utah will likely be used to revisit the decision as to whether or not sludge-drying should be allowed in Utah.

Corresponding author, title, and affiliation

Rhonda Miller, Ph.D.

Corresponding author email

rhonda.miller@usu.edu

Other authors

Mike Jensen, Trevor Nielson, Jennifer Long

Additional information

Website: http://agwastemanagement.usu.edu

Acknowledgements

The authors gratefully acknowledge support from Utah State University Experiment Station.

Livestock Methane Emissions Estimated and Mapped at a County-level Scale for the Contiguous United States


Proceedings Home W2W Home w2w17 logo

Purpose         

This analysis of methane emissions used a “bottom-up” approach based on animal inventories, feed dry matter intake, and emission factors to estimate county-level enteric (cattle) and manure (cattle, swine, and poultry) methane emissions for the contiguous United States.

What did we do? 

Methane emissions from enteric and manure sources were estimated on a county-level and placed on a map for the lower 48 states of the US. Enteric emissions were estimated as the product of animal population, feed dry matter intake (DMI), and emissions per unit of DMI. Manure emission estimates were calculated using published US EPA protocols and factors. National Agricultural Statistic Services (NASS) data was utilized to provide animal populations. Cattle values were estimated for every county in the 48 contiguous states of the United States. Swine and poultry estimates were conducted on a county basis for states with the highest populations of each species and on a state-level for less populated states. Estimates were placed on county-level maps to help visual identification of methane emission ‘hot spots’. Estimates from this project were compared with those published by the EPA, and to the European Environmental Agency’s Emission Database for Global Atmospheric Research (EDGAR).

What have we learned? 

Overall, the bottom-up approach used in this analysis yielded total livestock methane emissions (8,888 Gg/yr) that are comparable to current USEPA estimates (9,117 Gg/yr) and to estimates from the global gridded
EDGAR inventory (8,657 Gg/yr), used previously in a number of top-down studies. However, the
spatial distribution of emissions developed in this analysis differed significantly from that of
EDGAR.

Methane emissions from manure sources vary widely and research on this subject is needed. US EPA maximum methane generation potential estimation values are based on research published from 1976 to 1984, and may not accurately reflect modern rations and management standards. While some current research provides methane emission data, a literature review was unable to provide emission generation estimators that could replace EPA values across species, animal categories within species, and variations in manure handling practices.

Future Plans    

This work provides tabular data as well as a visual distribution map of methane emission estimates from enteric (cattle) and manure (cattle, swine, poultry) sources. Future improvement of products from this project is possible with improved manure methane emission data and refinements of factors used within the calculations of the project.

Corresponding author, title, and affiliation        

Robert Meinen, Senior Extension Associate, Penn State University Department of Animal Science

Corresponding author email    

rjm134@psu.edu

Other authors   

Alexander Hristov (Principal Investigator), Professor of Dairy Nutrition, Penn State University Department of Animal Science Michael Harper, Graduate Assistant, Penn State University Department of Animal Science Richard Day, Associate Professor of Soil

Additional information                

None.

Acknowledgements       

Funding for this project was provided by ExxonMobil Research and Engineering.

The authors are solely responsible for the content of these proceedings. The technical information does not necessarily reflect the official position of the sponsoring agencies or institutions represented by planning committee members, and inclusion and distribution herein does not constitute an endorsement of views expressed by the same. Printed materials included herein are not refereed publications. Citations should appear as follows. EXAMPLE: Authors. 2017. Title of presentation. Waste to Worth: Spreading Science and Solutions. Cary, NC. April 18-21, 2017. URL of this page. Accessed on: today’s date.

Manure Management Technology Selection Guidance

Proceedings Home W2W Home w2w17 logo

Purpose

Manure is an inevitable by-product of livestock production. Traditionally, manure has been land applied for the nutrient value in crop production and improved soil quality.With livestock operations getting larger and, in many cases, concentrating in certain areas of the country, it is becoming more difficult to balance manure applications to plant uptake needs. In many places, this imbalance has led to over-application of nutrients with increased potential for surface water, ground water and air quality impairments. No two livestock operations are identical and manure management technologies are generally quite expensive, so it is important to choose the right technology for a specific livestock operation. Information is provided to assist planners and landowners in selecting the right technology to appropriately address the associated manure management concerns.

What did we do?

As with developing a good conservation plan, knowledge of manure management technologies can help landowners and operators best address resource concerns related to animal manure management. There are so many things to consider when looking at selecting various manure treatment technologies to make sure that it will function properly within an operation. From a technology standpoint, users must understand the different applications related to physical, chemical, and biological unit processes which can greatly assist an operator in choosing the most appropriate technology. By having a good understanding of the advantages and disadvantages of these technologies, better decisions can be made to address the manure-related resource concerns and help landowners:

• Install conservation practices to address and avoid soil erosion, water and air quality issues.

• In the use of innovative technologies that will reduce excess manure volume and nutrients and provide value-added products.

• In the use of cover crops and rotational cropping systems to uptake nutrients at a rate more closely related to those from applied animal manures.

• In the use of local manure to provide nutrients for locally grown crops and, when possible, discourage the importation of externally produced feed products.

• When excess manure can no longer be applied to local land, to select options that make feasible the transport of manure nutrients to regions where nutrients are needed.

• Better understand the benefits and limitations of the various manure management technologies.

Picture of holding tank

Complete-Mix Anaerobic Digester – option to reduce odors and pathogens; potential energy production

Picture of mechanical equipment

Gasification (pyrolysis) system – for reduced odors; pathogen destruction; volume reduction; potential energy production.

Picture of field

Windrow composting – reduce pathogens; volume reduction

Picture of Flottweg separation technology

Centrifuge separation system – multiple material streams; potential nutrient
partitioning.

What have we learned?

• There are several options for addressing manure distribution and application management issues. There is no silver bullet.

• Each livestock operation will need to be evaluated separately, because there is no single alternative which will address all manure management issues and concerns.

• Option selections are dependent on a number of factors such as: landowner objectives, manure consistency, land availability, nutrient loads, and available markets.

• Several alternatives may need to be combined to meet the desired outcome.

• Soil erosion, water and air quality concerns also need to be addressed when dealing with manure management issues.

• Most options require significant financial investment.

Future Plans

Work with technology providers and others to further evaluate technologies and update information as necessary. Incorporate findings into NRCS handbooks and fact sheets for use by staff and landowners in selecting the best technology for particular livestock operations.

Corresponding author, title, and affiliation

Jeffrey P. Porter, P.E.; National Animal Manure and Nutrient Management Team Leader USDA-Natural Resources Conservation Service

Corresponding author email

jeffrey.porter@gnb.usda.gov

Other authors

Darren Hickman, P.E., National Geospatial Center of Excellence Director USDA-Natural Resources Conservation Service; John Davis, National Nutrient Management Specialist USDA-Natural Resources Conservation Service, retired

Additional information

References

USDA-NRCS Handbooks – Title 210, Part 651 – Agricultural Waste Management Field Handbook

USDA-NRCS Handbooks – Title 210, Part 637 – Environmental Engineering, Chapter 4 – Solid-liquid Separation Alternatives for Manure Handling and Treatment (soon to be published)

Webinars

Evaluation of Manure Management Systems – http://www.conservationwebinars.net/webinars/evaluation-of-manure-management-systems/?searchterm=animal waste

Use of Solid-Liquid Separation Alternatives for Manure Handling and Treatment – http://www.conservationwebinars.net/webinars/use-of-solid-liquid-separation-alternatives-for-manure-handling-and-treatment/?searchterm=animal waste

The authors are solely responsible for the content of these proceedings. The technical information does not necessarily reflect the official position of the sponsoring agencies or institutions represented by planning committee members, and inclusion and distribution herein does not constitute an endorsement of views expressed by the same. Printed materials included herein are not refereed publications. Citations should appear as follows. EXAMPLE: Authors. 2017. Title of presentation. Waste to Worth: Spreading Science and Solutions. Cary, NC. April 18-21, 2017. URL of this page. Accessed on: today’s date.

Additive to Mitigate Odor and Hydrogen Sulfide Gas Risk from Gypsum Bedded Dairy Manure

Proceedings Home W2W Home w2w17 logo

Purpose

Dangerous levels of hydrogen sulfide (H2S) gas released from gypsum-bedding-laden dairy manure storages have imposed risks to animal and human health, as demonstrated both on-farm and in bench scale studies (Fabian-Wheeler et al., 2017; Hile, 2016). Gypsum bedding is popular with some producers for advantages to cow comfort and health along with agronomic benefits. This project demonstrated the effect of iron oxide (FeO2) as a promising additive to dairy manure storages on mitigating H2S releases and odor.

What did we do?

Two bench-scale trials comprised three replicates each (15 kg manure each vessel) of three treatments: (1) control (dairy manure only), (2) manure with gypsum added 0.35% by weight, and (3) manure with gypsum and iron oxide added at a 1:1 molar ratio with gypsum. Headspace gas concentrations were measured using a Fourier transform infrared analyzer (FTIR model 700, California Analytical, Inc., Orange, CA) from each experimental vessel prior to and during manure agitation. Nutrient analyses were performed upon initial mixing and at the end of the incubations (PSU Agricultural Analytical Laboratory and Fairway Laboratories). Final incubation of the first trial included an odor evaluation of headspace gas according to international standard EN 13725 using qualified human assessors at the Penn State Odor Assessment Laboratory (abe.psu.edu/research/natural-resource-protection/odors). Odor quality testing on undiluted headspace gas used the labelled magnitude scale (LMS), Odor Intensity Referencing Scale (OIRS) and Hedonic Tone (pleasantness).

What have we learned?

High total sulfur in gypsum-laden manure confirms that gypsum provides the sulfur source that is converted to H2S. However, introduction of iron oxide maintained 98.8% total sulfur of manure sample by the end of incubation. The H2S concentrations remain low (below 5 ppm) in static conditions until gases are immediately released as soon as manure is agitated. Maximum H2S concentrations were reduced 83% to 96% in gypsum-laden manure by adding iron oxide (Figure 1). Despite anecdotal field reports of increased malodor associated with gypsum bedded manure, odor detection threshold (DT) did not increase with addition of gypsum compared to the control (manure only). However a 1:1 molar ration of iron oxide reduced the DT by approximately 50%. Odor quality results show that gypsum-laden manure created a less pleasant odor when compared to control manure.

Figure 1. Analyzer H2S concentrations from vessel headspace for each treatment evaluated sequentially over time during three agitation events at day 17, 24, and 31 manure age

Future Plans

Field-scale research would strengthen these findings and document management and economics associated with the iron oxide treatment use on farm. Additional odor surveys would confirm odor intensity reduction via iron oxide.

Corresponding author, title, and affiliation

Eileen E. Fabian (Wheeler), Professor in Agricultural and Biological Engineering (ABE) at Penn State (PSU)

Corresponding author email

fabian@psu.edu

Other authors

Long Chen, Ph.D. Candidate in ABE at PSU, Dr. Michael Hile, Project Associate in ABE at PSU and Dr. Mary Ann Bruns, Associate Professor in Ecosystems Science & Management at PSU

Additional information

Fabian-Wheeler, E., M. L. Hile, D. J. Murphy, D. E. Hill, R. Meinen, R. C. Brandt, H. A. Elliott, D. Hofstetter. 2017. Operator Exposure to Hydrogen Sulfide from Dairy Manure Storages Containing Gypsum Bedding. Journal Agricultural Safety and Health 23(1): 9-22.

Hile. M. L. 2016. Hydrogen sulfide production in manure storages on Pennsylvania dairy farms using gypsum bedding. Ph.D. dissertation. University Park, PA.: The Pennsylvania State University, Department of Agricultural and Biological Engineering.

Acknowledgements

This work was a partnership of Penn State College of Agricultural Sciences graduate student competitive grant program, Penn State Extension, and USA Gypsum

The authors are solely responsible for the content of these proceedings. The technical information does not necessarily reflect the official position of the sponsoring agencies or institutions represented by planning committee members, and inclusion and distribution herein does not constitute an endorsement of views expressed by the same. Printed materials included herein are not refereed publications. Citations should appear as follows. EXAMPLE: Authors. 2017. Title of presentation. Waste to Worth: Spreading Science and Solutions. Cary, NC. April 18-21, 2017. URL of this page. Accessed on: today’s date.

Developing Science-Based Estimates of Best Management Practice Effectiveness for the Phase 6 Chesapeake Bay Watershed Model

Proceedings Home W2W Home w2w17 logo

Purpose

The Chesapeake Bay Program (CBP) is a regional partnership that leads and directs Chesapeake Bay restoration and protection. The CBP uses a suite of modeling and planning tools to estimate nutrient (nitrogen and phosphorus) and sediment loads contributed to the Bay from its watershed, and guide restoration efforts. Non-point source (NPS) pollutant sources (e.g., agricultural and urban runoff) are largely related to diverse land uses stretching across six states and the District of Columbia. On-the-ground pollutant reductions are achieved by implementing both management and structural best management practices (BMPs) on those diverse land uses. Short and long-term reductions in NPS pollutant loads that result from BMP implementation are estimated using the CBP modeling suite of tools. The CBP recognizes (i.e., represents pollutant reduction credits for) over 150 BMPs across 66 land uses total for all sectors in its Phase 6 suite of modeling tools. The estimated pollutant reduction performance (i.e., effectiveness) of each BMP is parameterized in the CBP modeling suite. Within the CBP, BMP effectiveness is determined by groups of qualified scientific and technical experts (BMP Expert Panels) that review the relevant literature and make an independent determination regarding BMP performance which are reviewed and approved by the CBP partnership before being integrated in to the modeling tools by the CBP modeling team.

BMP Expert Panels are primarily convened under the auspices of the CBP’s Water Quality Goal Implementation Team and tasked to specific sector workgroups for oversight and management. Panels are tasked with addressing a specific BMP, or a suite of related BMPs. Panel members, in coordination with the CBP partnership, are selected based on their scientific expertise, practical experience with the BMP, and expertise in fate and transport of nutrients and sediment. Panels review the relevant literature and through a deliberative process and form recommendations on BMP pollutant production performance, and how the BMP(s) should be accounted for/incorporated into the CBP modeling tools and data reporting systems. Convening BMP Expert Panels is an ongoing focus and priority of the CBP partnership, given the integral role BMP implementation plays in achieving the pollution reduction goals required by the 2010 Chesapeake Bay Total Maximum Daily Load (TMDL).

What Did We Do?

Expert panels follow the process and adhere to expectations outlined in the Chesapeake Bay Program Partnership’s Protocol for the Development, Review, and Approval of Loading and Effectiveness Estimates for Nutrient and Sediment Controls in the Chesapeake Bay Watershed Model (aka the “BMP Protocol”). The expert panel process functions as an independent peer review, similar to that of the National Academy of Sciences.

Each panel reviews and discusses all current published literature and available unpublished literature and data related to the BMP(s), and formulates recommendations using the guidance provided in the BMP Protocol to help weigh the applicability of each data source.  Consensus panel recommendations are recorded in a final report, which is presented to relevant CBP partnership groups, including the CBP partnership’s Agriculture Workgroup for feedback and approval.

Panel recommendations are built into the modeling tools following CBP partnership approval of the panel’s report.

Chesapeake Bay Watershed Map

Basic Diagram of the Chesapeake Bay Program Expert Panel BMP Review Process

What Have We Learned?

The availability of published, peer-reviewed data varies greatly based on the scope of the panel. Some panels have dozens of articles to analyze while others may have a limited number of published studies to supplement gray literature, unpublished data and their best professional judgment. Even panels with a large amount of relevant literature at their disposal identify important gaps and future research needs. Given the wide range of stakeholders in the CBP partnership, regular updates and communication with interested parties as the panel formulates its recommendations is extremely important to improve understanding and acceptance of final panel recommendations.

Future Plans

The Chesapeake Bay Program evaluates BMP effectiveness estimates as new research or new conservation and production practices become available. Thus, expert panels sometimes revisit BMPs that were previously reviewed, but new and innovative BMPs are also considered. The availability of resources and new research limit the frequency of these reviews in conjunction with the priorities of the CBP partnership. Given the CBP partnership’s interest in adaptive management and continually improving its scientific estimates of BMP effectiveness, there will continue to be BMP expert panels for the foreseeable future.

Corresponding author (name, title, affiliation)

Jeremy Hanson, Project Coordinator – Expert Panel BMP Assessment, Virginia Tech

Corresponding author email address

jchanson@vt.edu

Other Authors

Mark Dubin, Agricultural Technical Coordinator, University of Maryland Extension

Brian Benham, Professor and Extension Specialist, Virginia Tech

Each expert panel has at least several other authors and contributors, which is not practical for listing here. Each individual report identifies the panel members and other contributors for that specific panel.

Additional Information

The BMP Review Protocol is available online at http://www.chesapeakebay.net/publications/title/bmp_review_protocol

All final expert panel reports are posted on the Chesapeake Bay Program website under “publications”: http://www.chesapeakebay.net/groups/group/bmp_expert_panels

Acknowledgements

These BMP expert panels would not be possible without the generosity of expert panel members who volunteer their valuable time and perspectives. Staff support, coordination and funding for these panels is provided by the EPA Chesapeake Bay Program, specifically through Cooperative Agreements with Virginia Tech and University of Maryland, with additional contract support from Tetra Tech as needed. The work of these expert panels is strengthened through the participation, review and comments of the CBP partnership.

The authors are solely responsible for the content of these proceedings. The technical information does not necessarily reflect the official position of the sponsoring agencies or institutions represented by planning committee members, and inclusion and distribution herein does not constitute an endorsement of views expressed by the same. Printed materials included herein are not refereed publications. Citations should appear as follows. EXAMPLE: Authors. 2017. Title of presentation. Waste to Worth: Spreading Science and Solutions. Cary, NC. April 18-21, 2017. URL of this page. Accessed on: today’s date.