Biochar is a carbon-rich product derived from pyrolysis and is commonly used as a soil amendment. When applied to soil, biochar has been shown to sequester carbon, enhance aggregate stability, and improve soil nutrient and water retention. Recently, several states have adopted the USDA Natural Resources Conservation Service (NRCS) Code 336, which addresses soil carbon amendments, including biochar, as a conservation practice. This has led to increased awareness of biochar in agricultural systems. While the application of biochar to soil systems has been extensively studied, there are other agricultural sectors where biochar could be incorporated to provide additional benefits. This study explores the potential for incorporating biochar into manure management systems, specifically anaerobic digestion and manure storage.
What Did We Do?
Two different studies were conducted as part of this research. The first study investigated how biochar could be implemented into manure storage systems. Manure storage is a common practice at livestock facilities; however, emissions of ammonia (NH₃), methane (CH₄), and nitrous oxide (N₂O) are released into the atmosphere during storage. Additionally, the increasing use of solid-liquid separation in mid- to large-scale farms has resulted in emissions occurring outside of land application due to the lack of crust formation on manure storage. This study assessed emissions from pilot manure storage units (5-gallon buckets) after applying a 2-inch layer of raw feedstock or biochar as a cover over dairy manure. Different feedstocks, including woodchips, corn stover, and manure solids, were evaluated, and emissions were measured weekly over four months to determine NH₃, CH₄, and N₂O emissions (Figure 1).
Figure 1: Manure storage monitoring
The second study examined the incorporation of biochar into dairy manure anaerobic digestion systems. Anaerobic digestion of livestock manure produces biogas, which contains significant concentrations of hydrogen sulfide (H₂S) that must be removed before energy utilization. This study evaluated how dosing biochar—produced from different feedstocks and at varying pyrolysis temperatures—impacted hydrogen sulfide reduction during anaerobic digestion. A bench-scale study was conducted using batch reactors dosed at 0.75% (w/w) (approximately 62 lbs per 1,000 gallons), and biogas was analyzed every 2–3 days for H₂S, CH₄, and CO₂ concentrations.
Figure 2: Anaerobic digestion setup
What Have We Learned?
In the manure storage study, both raw feedstocks and biochar reduced NH₃ emissions. The greatest reductions in NH₃ emissions were observed with woodchip biochar, which achieved an average reduction of 82–97% in cumulative emissions. The manure solids and corn stover biochar resulted in average reductions of 35% and 55%, respectively. However, while NH₃ emissions were reduced, an increase in greenhouse gas emissions—particularly N₂O—was observed in treatments with biochar covers.
In anaerobic digestion systems, the addition of biochar at 0.75% (w/w) reduced H₂S production. The degree of reduction was influenced by the biochar production temperature, with lower-temperature biochars being more effective at reducing H₂S. During the batch anaerobic digestion tests, no significant impact was observed on CH₄ or CO₂ concentrations in the biogas.
Future Plans
For the manure storage study, while the reductions in NH₃ emissions were promising, the observed increase in N2O emissions requires further investigation. The highest N₂O emissions were associated with large-particle woodchip biochar, likely due to the creation of an anoxic environment within the biochar cover. Future studies will examine whether reducing biochar particle size can mitigate these N₂O emissions. Additionally, further research will assess the long-term impacts of these treatments on soil health and crop production following land application.
For the anaerobic digestion study, additional work is needed to determine the specific biochar characteristics responsible for the greater H₂S reductions observed with lower-temperature biochars. Since the study was conducted at a batch scale, further evaluation in a continuous system is necessary. Lastly, full-scale digester trials are needed before widespread adoption of biochar in anaerobic digestion systems.
Authors
Presenting & corresponding author
Joseph R. Sanford, Assistant Professor, University of Wisconsin–Platteville, sanfordj@uwplatt.edu
Additional authors
Ben Raimonde, Undergraduate Research Assistant, University of Wisconsin–Platteville
John Rodwell, Undergraduate Research Assistant, University of Wisconsin–Platteville
Jeffery Smolinski, Undergraduate Research Assistant, University of Wisconsin–Platteville
Acknowledgements
This material is supported by the Wisconsin Dairy Innovation Hub and the National Institute of Food and Agriculture, U.S. Department of Agriculture, under award number 2022-70001-37309. Any opinions, findings, conclusions, or recommendations expressed in this publication are those of the authors and do not necessarily reflect the views of the U.S. Department of Agriculture or the Wisconsin Dairy Innovation Hub.
The authors are solely responsible for the content of these proceedings. The technical information does not necessarily reflect the official position of the sponsoring agencies or institutions represented by planning committee members, and inclusion and distribution herein does not constitute an endorsement of views expressed by the same. Printed materials included herein are not refereed publications. Citations should appear as follows. EXAMPLE: Authors. 2025. Title of presentation. Waste to Worth. Boise, ID. April 7-11, 2025. URL of this page. Accessed on: today’s date.
Methane emissions from manure storages significantly contribute to the livestock industry’s carbon footprint. While various manure management strategies are used to reduce greenhouse gas (GHG) emissions on farms, such as anaerobic digestion and composting, many of these strategies are cost-prohibitive for small-to-medium-sized farms. Strategic manure application timing to limit GHG emissions is a practical, scalable option to reduce methane production in manure storages.
Carbon credits are financial incentives for farmers who adopt practices that reduce greenhouse gas emissions, such as cover crops or methane emissions abatement. These credits can then be sold to companies seeking to offset their emissions. This study evaluates the impact of manure application timing on methane emissions from storages and explores how carbon credits could act as an incentive for farms to employ climate-smart manure management practices. By comparing different manure application strategies (fall, spring, in-season sidedress, and split applications), we assess the methane reductions and improved economics of optimized timing.
What Did We Do?
Methane emissions were estimated using data from a lab-based study conducted by Andersen et al. (2015), who measured methane emissions from deep-pit swine manure at various temperatures. From this data, we created a model incorporating manure production rates and ambient temperature dynamics to predict daily methane emissions from a 4800-head slurry storage and 4800-head deep-pit swine production facility.
Seven application scenarios were compared: fall (November 1), spring (April 15), sidedress (June 1), fall-spring, fall-sidedress, spring-sidedress, and fall-spring-sidedress split applications. Total methane emissions were calculated for each scenario, allowing us to determine the GHG emissions abated by shifting from a fall application to an alternate strategy. An economic assessment was conducted using a $30/metric ton carbon dioxide equivalent (MT CO2e) carbon credit valuation to determine the financial implications of these methane mitigation strategies.
What Have We Learned?
For our swine slurry store model, methane emissions were highest in the single fall application scenario due to the full storage attained during peak summer temperatures, with annual emissions totaling nearly 0.5 MT CO2e/pig-space (Figure 1). Shifting application to spring or sidedress reduced emissions by approximately 50%. Split applications showed a further reduction in emissions by maintaining lower storage volumes throughout the year.
Figure 1: Estimated methane emissions in metric tons of carbon dioxide equivalent (MT CO2e) from slurry storage for fall, spring, sidedress, fall-spring split (F-S), fall-sidedress split (F-SD), spring-sidedress split (S-SD), and fall-spring-sidedress split (F-S-SD) applications.
From an economic perspective, carbon credits significantly enhanced the financial viability of the new application strategies. Carbon credits from abated emissions are projected to bring a maximum of $10/pig-space, or about $74/acre, to the farm annually in the F-S-SD scenario (Table 1). The improved manure application timing can also benefit crop yield, making a spring or sidedress manure application even more economically favorable.
Table 1: Projected carbon credit income for a 4800-head wean to finish swine farm with a slurry storage for fall, spring, sidedress, fall-spring split (F-S), fall-sidedress split (F-SD), spring-sidedress split (S-SD), and fall-spring-sidedress split (F-S-SD) applications.
Fall
Spring
Sidedress
F-S
F-SD
S-SD
F-S-SD
Carbon Credit Income
($/acre)
$ –
$ 33.63
$ 33.71
$ 41.95
$ 45.82
$ 45.69
$ 52.06
Carbon Credit Income
($/pig-space)
$ –
$ 6.50
$ 6.51
$ 8.10
$ 8.85
$ 8.83
$ 10.06
Future Plans
Further research should be conducted to refine the temperature aspect of the model. In the slurry store model, we assume that the manure temperature equals the 10-day average temperature. A study to verify the true manure temperature throughout the year would improve the confidence level of the current model. For deep pit barns, we use measured temperature data from 58 barns over 13 months, but manure temperatures were collected from the manure pump out access port and may not represent average manure temperatures in the barn. Future models to assess differences between deep pit and slurry store emissions will highlight the optimal manure management strategies for limiting GHG emissions.
Using specialized high-clearance irrigation equipment, like the 360 RAIN from 360 Yield Center, could enhance the feasibility of more frequent manure applications, reducing methane emissions while maintaining crop nitrogen availability. Additionally, developing standardized carbon credit protocols for manure management could create opportunities for more producers to monetize methane reduction efforts, further incentivizing climate-smart manure application strategies.
Authors
Presenting author
Jacob R. Willsea, Graduate Research Assistant, Iowa State University Department of Agricultural and Biosystems Engineering
Corresponding author
Daniel S. Andersen, Associate Professor, Iowa State University Department of Agricultural and Biosystems Engineering, dsa@isatate.edu
Additional Information
Andersen, D.S., Van Weelden, M.B., Trabue, S.L., & Pepple, L. M. (2015). Lab-assay for estimating methane emissions from deep-pit swine manure storages. Journal of Environmental Management, 159, 18-26. https://doi.org/10.1016/j.jenvman.2015.05.003
The authors are solely responsible for the content of these proceedings. The technical information does not necessarily reflect the official position of the sponsoring agencies or institutions represented by planning committee members, and inclusion and distribution herein does not constitute an endorsement of views expressed by the same. Printed materials included herein are not refereed publications. Citations should appear as follows. EXAMPLE: Authors. 2025. Title of presentation. Waste to Worth. Boise, ID. April 7-11, 2025. URL of this page. Accessed on: today’s date.
The purpose of this project was to collect local on-the-ground data to evaluate the effectiveness of different manure storage options installed on working farms in King County, Washington. Agricultural areas in King County receive over 40 inches of rain annually with most of it falling between the months of October through March. During this time, farms often store and compost their manure for spring and summer field application. Composting livestock manure and waste can produce a valuable resource for land managers. However, if managed improperly, manure leachate and runoff can contaminate ground and surface water resources posing a risk to humans and other wildlife.
The project aimed to collect data on water quality and manure quality under different solid manure storage options during the fall and winter months. During the project, we worked with two farms to monitor water quality and manure quality as well as held education and outreach events to engage with stakeholders about benefits and/or costs of adopting new manure management BMPs.
What Did We Do
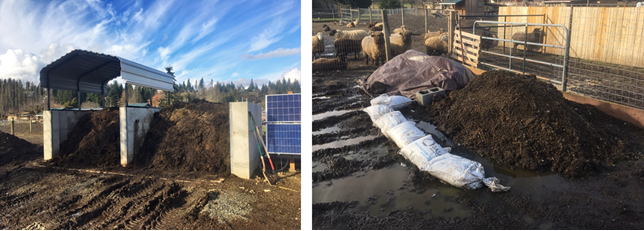
For the project, we worked with two farms and established four manure storage areas on each including: a concrete slab with walls and a roof, concrete slab with walls and no roof, a compacted soil areas with a tarp cover, and a compacted soil area with no cover. The manure piles were managed by the farmer following common winter practices and were turned and added to 2-3 times per month. We monitored the temperature of the piles over time to assess their composting activity, although it was not a primary focus of our study.
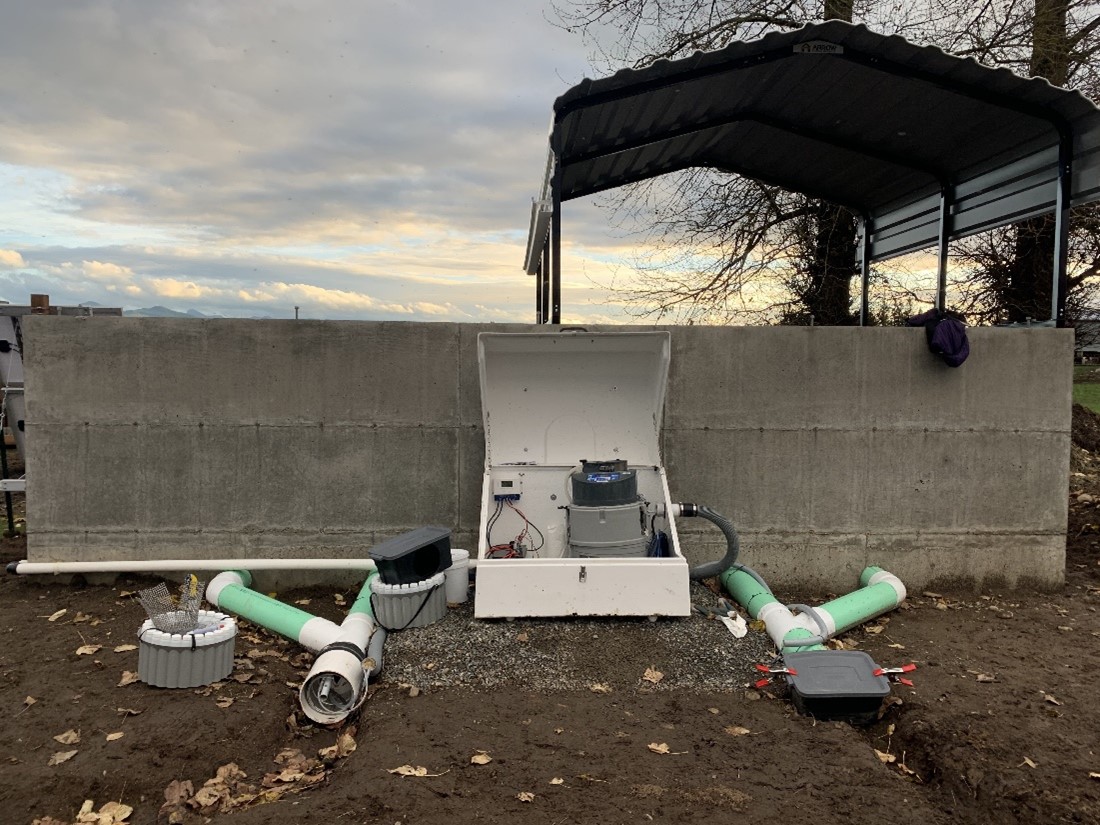
We collected samples of the manure from each storage area during the project to monitor changes over time. To assess nutrient loss and pollution via a stormwater runoff pathway, we collected runoff from the concrete slabs. To assess nutrient loss and pollution via a leaching pathway, we collected soil samples, from under the compacted soil areas. This monitoring allowed us to compare the storage options. The study was conducted over the course of eight months from October 2020 through May 2021. Below are photos of our study setup. Stormwater runoff water quality samples were collected using an ISCO automated sampler that was programmed to grab samples during rain events that generated runoff from the manure piles. Soil and manure samples were collected on a monthly basis.
Figure 1. Manure storage treatments. From left to right: slab covered, slab uncovered, soil covered, and soil uncovered.Figure 2. Stormwater runoff collection system from the concrete slabs.
What Have We Learned
The project results support the conclusion that the covering of solid manure piles had positive environmental benefits. Covered manure piles stored on a concrete slab have less stormwater runoff with lower loads of nutrients in the leachate than uncovered manure piles on a concrete slab. The covering of dry manure piles stored on compacted soil surfaces reduced the leaching of nutrient, particularly nitrate and nitrite, from manure piles into the soil. It also created a better manure end-product by allowing higher heat values to be reached and creating a drier end product. Additionally, the
placement of manure on a non-permeable, concrete surface eliminated the leaching of manure nutrients below the piles. Covered manure piles, whether stored on a concrete slab or dirt, tended to be drier and have higher temperatures, which results in a better composted manure product.
The results of this study demonstrated that the type of animal species and pile management (how often the pile was turned or added to) also greatly affected the nutrient composition of the leachate. For instance, at Site A, there was higher TP in the manure, and thus higher TP in the runoff water quality and in soil samples.
Future Plans
Due to the short duration of the project, we pursued and were awarded additional funding to extend the project and expand the data set to allow for more robust statistical analysis and conclusions. Partner agencies and organizations as well as the farmers have expressed support and interest in continuing this research, and the project Steering Committee members have also expressed interest in further participation.
In future studies, we intend to try to better quantify the flow volumes from manure piles stored on slabs. In addition, we intend to better assess leaching potential underneath the manure piles stored on soil by using lysimeters to measure leachate volumes.
Authors
Presenting Author
Scarlett Graham, Conservation Research Specialist, Whatcom Conservation District
Corresponding Author
Laura Redmond, Landowner Incentive Program Coordinator, King Conservation District
laura.redmond@kingcd.org
Additional Authors
Addie Candib, Pacific Northwest Regional Director, American Farmland Trust
The authors are solely responsible for the content of these proceedings. The technical information does not necessarily reflect the official position of the sponsoring agencies or institutions represented by planning committee members, and inclusion and distribution herein does not constitute an endorsement of views expressed by the same. Printed materials included herein are not refereed publications. Citations should appear as follows. EXAMPLE: Authors. 2022. Title of presentation. Waste to Worth. Oregon, OH. April 18-22, 2022. URL of this page. Accessed on: today’s date.
In this webinar, presenters share their expertise in sampling and cleanout for lagoons and anaerobic digesters and considerations in planning these operations. This presentation was originally broadcast on January 21, 2022. Continue reading “Cleanout for Lagoons and Anaerobic Digesters”
Long-term manure storages on dairy farms are temporary containment structures for byproducts of milk production. Manure, milkhouse wash, bedding, leachate, and runoff are stored until they can be utilized as fertilizer, bedding, irrigation, or energy. The practice of long-term storage creates stakeholders who collect data in their interactions with storages. This presents an opportunity to support data driven decision making on best use and operation of storages.
What Did We Do?
Prevalent stakeholders who collected data on storages were identified and the information they collected was examined. Data that could assist in depicting storage infrastructure was retained. Data not collected but of value to decision makers was noted. From this a combined data set was proposed that could depict the size, state, and impact of storage infrastructure. The feasibility of such a combined data set and opportunities from it were considered.
What Have We Learned?
General volume, general configuration, and year installed are most often collected by stakeholders while detailed configuration and detailed waste type are rarely collected. Cost is not collected. (Table 1) Stakeholders do not collect data on operations of all sizes. Most data is collected on large and medium operations while data is rarely collected on small operations. Stakeholders use their own definitions and classification structures.
Table 1 Combined data to be collected to assist decision makers
*NRCS-United States Department of Agriculture Natural Resources Conservation Service
Table 2 First level characterization
Parameter
Number
Location
Age
Total Stored Capacity
Precipitation Stored Capacity
Waste Stored Capacity
Produced Waste Volume
Produced Waste Type
Produced Manure Volume
Produced Manure Type
Liner Type
Cover Type
Certification Type
A first level characterization of storage infrastructure is proposed from Table 1, Table 2. Items in the first level characterization depict the location and condition of the storage infrastructure. Each of these items may be represented over a specific geographic area, such as state, watershed, or county. In a yearly inventory each of these items may be represented over time.
Table 3 Second level characterization
Parameter
Length of Storage Estimate
Proximity to Sensitive Area Estimate
Storage Density
Seepage Estimate
Emissions Estimate
Using Table 2 a second level characterization is proposed, Table 3. Items in the second level characterization estimate the capacity and impact of the state’s storage infrastructure. Supplementary information to estimate certain parameters is required. Each of these items may be represented over time and specific geographic area. Cost to implement and operate storage infrastructure are the third characterization, Table 4. Each of these items may be represented over time and specific geographic area.
Table 4 Cost characterization
Parameter
Cost Estimate
Implement, Per Volume
Per Configuration
Operate, Per Volume
Per Configuration
Combining and characterizing data from different stakeholders can provide a data-driven representation of storage infrastructure. Condition, capability, and impact of the storage infrastructure can be represented over time and geographic area. Monitoring, evaluating actions, forecasting issues, and targeting priority areas1 is made feasible. Example opportunities are as follows.
Long-term storage is desirable to enable storage of manure during winter months. Combined data can provide feedback on average days of storage in the state or watershed. The cost to achieve target days of storage may be estimated and the days of storage may be tracked over time as a result of funding efforts.
New York State released $50 million for water quality funding, which assisted in the implementation of new storages. In the implementation of these storages opportunity exits to collect cost data to inform future funding levels, quantify the increase in long-term storage provided as a result of the funding, and forecast when these storages are projected to reach the end of their lifecycle2.
As interest in cover and flare storages increase to offset livestock emissions combined data sets can assist in evaluating feasibility of such a proposal3 4 5. Potential emissions to be captured and cost to implement can be estimated.
Obstacles to collecting and combining data are cost, insufficiency, and misuse. As specificity in the data to be collected increases so does the cost to collect, combine, and maintain. Additionally, stakeholders have existing data collection infrastructure that must be modified at cost to allow combination. If the combined data set is not sufficiently populated by stakeholders is will depict an inaccurate representation of storage infrastructure. Finally, the risk of misuse and conflict amongst decision makers is present. Stakeholders may purposely or inadvertently use the inventory to reach erroneous conclusions.
Future Plans
Obstacles to implementation are not insignificant. Detailed analysis is required to determine the exact data to be collected, definitions to be agreed upon, and extent of coverage such that maximum benefit will be derived for decision makers.
Full benefit of storage data is increased by additional data sets such as state-wide livestock numbers, precipitation and temperature distributions, surface water locations, ground water levels, populations center locations, well locations, shallow bedrock locations, karst locations, complaint locations, and operator violations locations. The feasibility of obtaining these data sets should be determined.
The implementation and use of storages has additional stakeholders outside of those identified here. Additional stakeholders should be identified that can enhance or derive value from a combined data set on long term storages, such as manure applicators, handling and advanced treatment industry, extension services, zoning officials, professional engineers, environmental groups, and contractors.
Authors
Corresponding author
Michael Krcmarik, P.E., Area Engineer, United States Department of Agriculture Natural Resources Conservation Service, Flint, Michigan
Michael.Krcmarik@usda.gov
Other authors
Sue Reamer, Environmental Engineer, United States Department of Agriculture Natural Resources Conservation Service, East Lansing, Michigan
$50 Million in Water Quality Funding Available for NY Livestock Farms.” Manure Manager, 27 Sept. 2017, www.manuremanager.com/state/$50-million-in-water-quality-funding-available-for-ny-livestock-farms-30286.
Wright, Peter, and Curt Gooch. “ASABE Annual International Meeting.” Estimating the Economic Value of the Greenhouse Gas Reductions Associated with Dairy Manure Anaerobic Digestions Systems Located in New York State Treating Dairy Manure, July 16-19 2017.
Wightman, J. L., and P. B. Woodbury. 2016. New York Dairy Manure Management Greenhouse Gas Emissions and Mitigation Costs (1992–2022). J. Environ. Qual. 45:266-275. doi:10.2134/jeq2014.06.0269
Barnes, Greg. “Smithfield Announces Plans to Cover Hog Lagoons, Produce Renewable Energy.” North Carolina Health News, 28 Oct. 2018, www.northcarolinahealthnews.org/2018/10/29/smithfield-announces-plans-to-cover-hog-lagoons-produce-renewable-energy/.
The authors are solely responsible for the content of these proceedings. The technical information does not necessarily reflect the official position of the sponsoring agencies or institutions represented by planning committee members, and inclusion and distribution herein does not constitute an endorsement of views expressed by the same. Printed materials included herein are not refereed publications. Citations should appear as follows. EXAMPLE: Authors. 2019. Title of presentation. Waste to Worth. Minneapolis, MN. April 22-26, 2019. URL of this page. Accessed on: today’s date.
For many livestock producers, manure storage capacity is limited. Severe weather events can intensify the manure storage capacity limitations. One option available to producers is to haul manure to the field and place it in manure staging areas. This can reduce the manure storage capacity needed at the livestock facility, and reduce manure hauling time in the spring. Hauling of manure to manure staging areas is typically done when convenient, with little thought about the effect of timing and nutrient loss. This study examined nutrient loss from manure staging piles placed in November, January, and March over a course of five years.
What Did We Do?
This study compared manure staging areas with manure placed at three different times (November, January, and March) and two different bedding materials (straw, no straw).
For each placement event (November, January, March) manure from the tie stall barn (straw bedding) and the butterfly sheds (sand bedding) at the Utah State University Caine Dairy was hauled to Cache Junction, UT and placed in manure staging piles. Composite manure samples were collected from each pile (manure type) at the time of placement, and at removal each year (in the fall after crop harvest) for five years. Manure samples were analyzed for ammonium-nitrogen using Method 12-107-04-1-F on a Lachat Flow Injection Analysis (FIA) analyzer and total N using an Elementar combustion analyzer. Leachate was collected biweekly by means of zero-tension lysimeters installed under the manure staging areas and analyzed for ammonium-nitrogen using Method 10-107-06-2-O and nitrate-nitrogen using Method 10-107-04-1-R on a Lachat FIA analyzer. Soil samples were taken to a depth of 90 cm and analyzed for nitrate-nitrogen using Method 12-107-04-1-F on a Lachat FIA analyzer.
What Have We Learned?
Figure 1. Total N (mg) in leachate/lysimeter under manure staging piles.
Significant leachate was produced under the manure staging piles placed during the winter months, with the manure with no straw (sand bedding) producing more leachate than the manure with straw (straw bedding). Manure piles placed in November produced less leachate and lost less total N than those placed in January and March (Figure 1). Due to Utah’s dry climate, this is most likely due to drying of the manure in the late fall months, which enabled the manure to absorb more moisture during the winter months. Manure piles placed in January produced the most leachate and exhibited more total N loss (Figure 2).
Figure 2. Difference in manure Total N% from time of placement to removal for land application.
The snow and snow melt most likely contributed to the large amount of leachate and nitrogen loss observed under the January piles.
Future Plans
The results of this study indicate that straw bedding helps retain the nitrogen in the manure and reduce nitrogen loss from manure placed in manure staging piles. In addition, in Utah’s dry climate, the timing of manure staging pile placement does affect nutrient loss with placement in late November minimizing nutrient leaching. This information will be presented to producers, NRCS, DWQ, and other ag professionals.
Authors
Rhonda Miller, Ph.D.; Agricultural Systems Technology and Education Dept.; Utah State University, rhonda.miller@usu.edu
Jennifer Long; Agricultural Systems Technology and Education Dept.; Utah State University
Additional Information
Website: http://agwastemanagement.usu.edu
Acknowledgements
The authors gratefully acknowledge support from Utah State University Experiment Station.
The authors are solely responsible for the content of these proceedings. The technical information does not necessarily reflect the official position of the sponsoring agencies or institutions represented by planning committee members, and inclusion and distribution herein does not constitute an endorsement of views expressed by the same. Printed materials included herein are not refereed publications. Citations should appear as follows. EXAMPLE: Authors. 2019. Title of presentation. Waste to Worth. Minneapolis, MN. April 22-26, 2019. URL of this page. Accessed on: today’s date.
Farms collect and store manure in different ways. For the most part, manure is handled and stored as either solid, slurry, or liquid. The biggest differences are between systems designed for solid manure and those designed for liquid or slurry manure.
Solid Manure
Solid manure is approximately 80% (or less) moisture and 20% (or more) solids. It can be stacked into piles and handled with equipment like front-end loaders and box scrapers. Semi-solid manure (around 15% solids) is handled and stored the same as solid manure.
Common examples where farms handle manure as a solid:
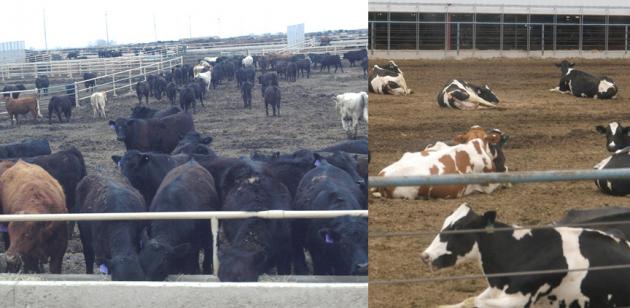
Beef feedlots and dairy farms scrape manure from open earthen lots (Photo 1)
Broiler (meat chicken) litter is a mix of manure, feathers, and bedding (Photo 2)
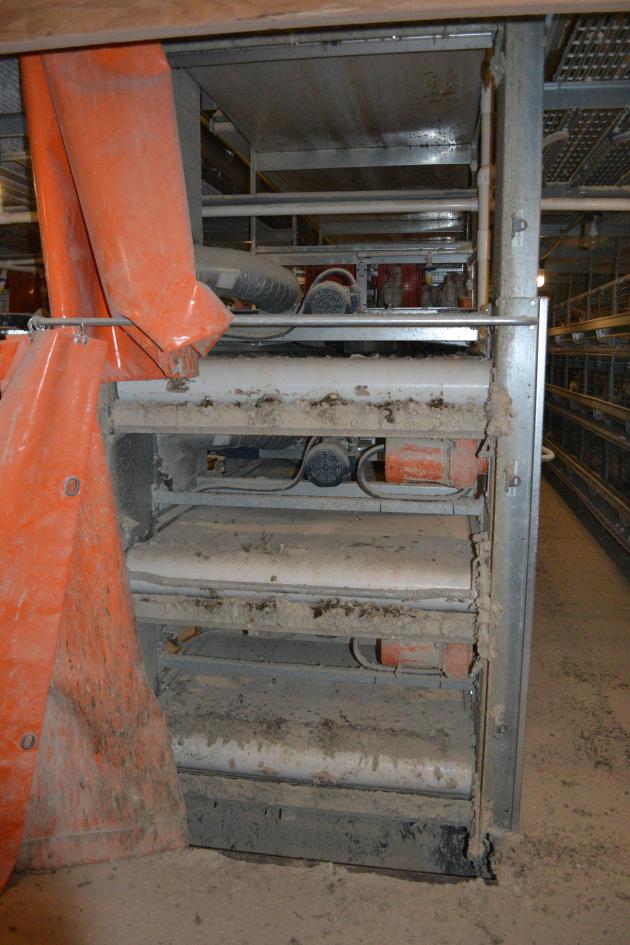
Layer (egg-producing chicken) manure contains feathers but no bedding (Photo 3)
Less common examples where farms handle manure as a solid:
Bedded pack barns or hoop buildings for beef cattle or pigs
Photo 1. (Above) Two examples of open earthen lots with beef cattle on the left and dairy cattle on the right.
Photo 2: (Above) Broiler litter being cleaned out of a house (left) and what a similar house looks like when populated with chickens (right). Photos courtesy of Josh Payne, Oklahoma State University.
Photo 3: (Above) Most layer hen houses built recently use belt systems to remove manure. Several cages are stacked on top of each other and a belt in between each tier catches the manure. The belts convey manure to a collection point; manure is taken from the collection point to a separate storage area. Photo courtesy of Robb Meinen, Pennsylvania State University.
Solid Manure Storage
Solid manure is typically stacked or piled in storage areas that may be covered (Photos 4 and 6, below) or uncovered (Photo 5, below) depending on the amount of rainfall or snowmelt an area receives. Farms in arid areas are more likely to manage solid manure storage areas without a roof or cover.
Roofs or covers prevent rain or snowmelt from entering the storage area, but are more expensive to build. If precipitation causes runoff from uncovered solid manure storage areas, the runoff needs to be captured and contained to prevent it from reaching streams, lakes, or other surface water.
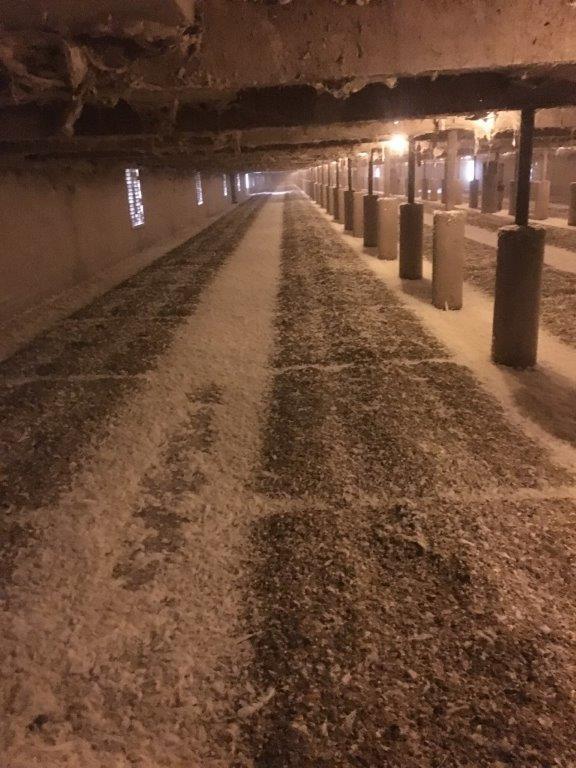
Photo 4. (Above) Solid layer hen manure is stored on the ground level of this high-rise layer house. The hens are housed in the upper level and manure falls through slats in the floor. High-rise houses used to be the most common system for layer hens but are gradually being replaced by manure belt systems. Image courtesy of the United Egg Producers.
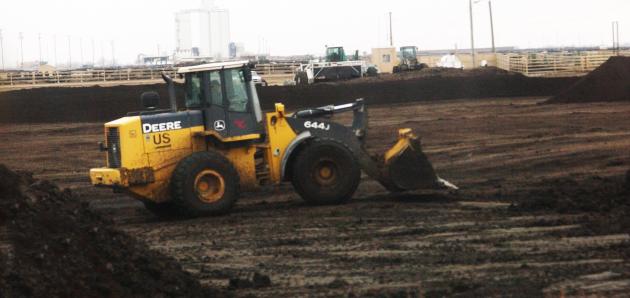
Photo 5. (Above) The solid manure storage area and handling equipment for a beef feedlot.
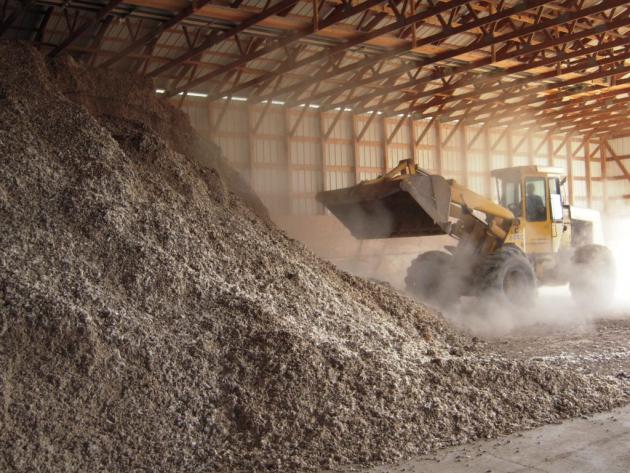
Photo 6. (Above) A covered manure storage structure on a poultry farm. Photo courtesy of David Schmidt, University of Minnesota.
Slurry Manure
Slurry manure is approximately 10-15% solids. It is a very thick liquid that requires pumps for collection and handling. Equipment and structures for handling slurry manure need to be engineered for materials of this consistency.
Common examples where farm collect and handle manure as a slurry:
Pig manure in deep pit barns
Dairy manure in scrape (Photo 8, below) or vacuum systems in free stall barns
Less common examples where farms collect and handle manure as a slurry:
Layer hen farms with scrape systems
Slatted floor beef buildings with a manure pit
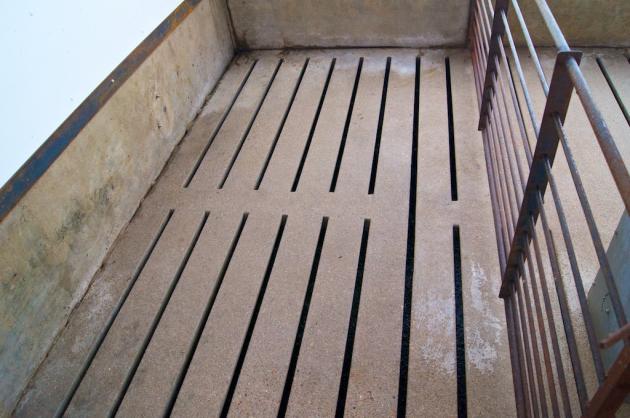
Photo 7. (Above) A slatted floor in a small-scale swine research barn. Slatted floors are part of both slurry and liquid manure collection systems, especially on pig farms. If a deep pit for long-term storage is beneath this floor, the farm handles manure as a slurry. If manure is flushed from beneath the slats to an external storage structure, the farm likely handles manure as a liquid. Photo courtesy of Rick Ulrich, University of Arkansas.
Photo 8: (Above) An automated scraper collecting slurry manure in a freestall dairy barn. Slurry manure can also be collected from barns or feed pads using vacuum tankers. Photo courtesy of Karl Vandevender, University of Arkansas.
Liquid Manure
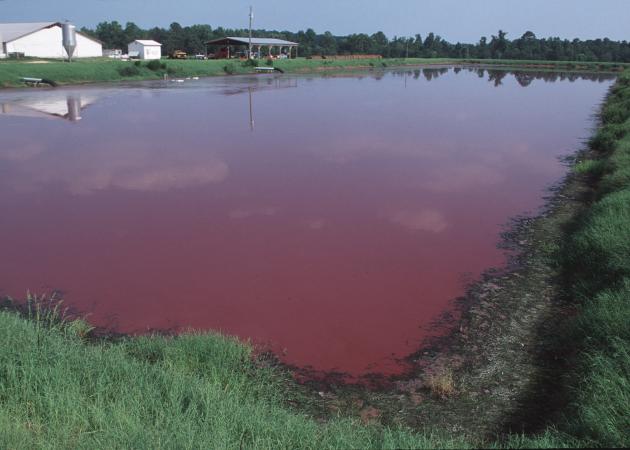
Liquid manure has only a small amount of solids (less than 5%). It is very dilute in terms of nutrient content and cannot be hauled long distances because of the cost of hauling large amounts of water. Liquid manure is collected and handled with gravity flow or pumps and is stored in structures called ponds or lagoons.
Common examples where farms handle manure as a liquid:
Runoff holding ponds for open earthen lots (beef or dairy)
Pull-plug or flush systems in pig barns
Flush systems in dairy barns
Less common examples where farms handle manure as a liquid:
Layer hen farms with flush systems
Slurry and Liquid Manure Storage
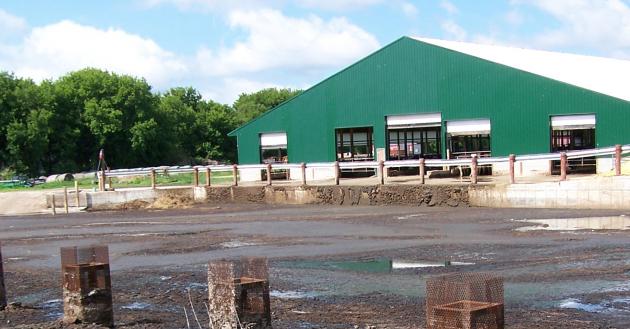
Slurry and liquid manure can be stored in earthen pits (Photo 9, below), holding ponds, or treatment lagoons. They can also be stored in above-ground tanks (Photo 10, below) or in concrete structures (Photo 11, below).
Photo 9. (Above) An earthen liquid manure storage structure on a pig farm. Photo courtesy of USDA NRCS.
Photo 10. (Above) The orange arrow points to an above-ground steel manure storage tank.
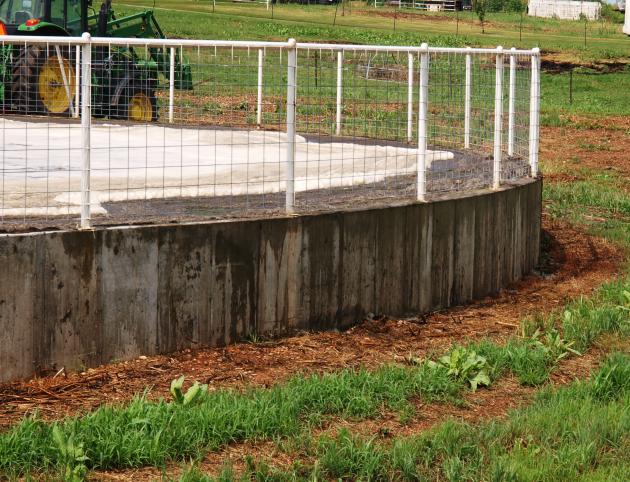
Photo 11. (Above) The manure storage structure on this dairy farm includes a concrete wall near the barn and ramp for access when removing manure. Photo courtesy of David Schmidt, University of Minnesota.
The video below, produced by the University of Wisconsin, introduces systems for handling and storing liquid and slurry manure. It also discusses safety precautions for these systems and structure. The final section covers the importance of agitation, or mixing, when preparing manure for land application.
Process Wastewater
Process wastewater is water used by farms, often for cleaning, which comes in contact with animals, manure, or feed. It may also contain chemicals for sanitizing or cleaning a product or surface. This is not considered to be manure, but must be captured and contained and can be stored in the liquid manure storage structure or a separate structure.
Common types of process wastewater generated on animal farms:
Egg wash water
Milking center wash water
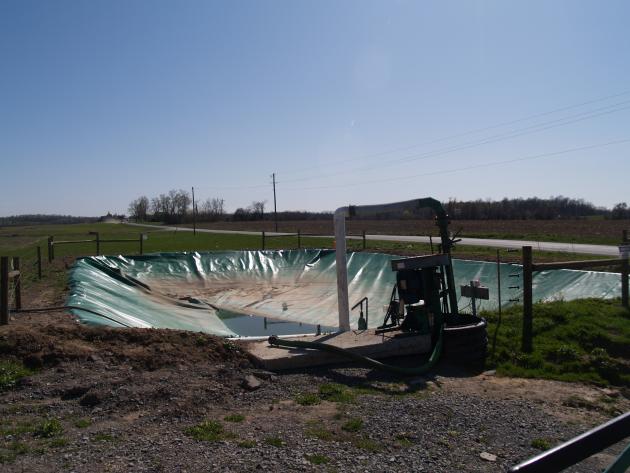
Covered Manure Storage
In recent years, the use of covers on manure storage structures has increased. This is especially true for pig farms. Covers are primarily used to address odor concerns, but can also be part of an anaerobic digestion system. Photo 12, below, shows a covered manure storage structure.
Photo 12: (Above) A very small earthen manure storage structure with a cover installed. Most covered manure storage structures are larger than this but look very similar.
Is There Enough Manure Storage Capacity?
The main purpose of manure storage is to contain manure, process wastewater, and contaminated runoff until it can be safely and appropriately applied to crop fields or be used in an alternative manner. Good stewardship of manure storage involves two important steps:
Designing the facility so it has enough capacity to store manure and process wastewater generated by the farm plus precipitation plus freeboard (margin of safety) during time periods when land application is not possible or appropriate.
Operating and maintaining the manure storage or treatment facility so that problems can be identified and prevented or corrected before they cause overflows or failures.
There are several considerations when calculating the amount of capacity needed in the manure storage or treatment structure and planning for its operation and maintenance.
Regulatory requirements. For some farms, the minimum amount of storage capacity and freeboard as well as frequency of inspections is prescribed by regulation. Keeping records on design and construction, inspections and findings, maintenance activities, corrections made, and amount of manure or process wastewater in the storage structure is essential to prove the requirements are met.
Cropping system. Manure is not usually applied to fields between planting and harvest for cultivated crops. The amount of time fields are unavailable during the growing season should be factored into the planning for manure storage structures. Hay or pasture fields add some flexibility because manure can be applied more often. But, as with cultivated crops, hay or pasture fields should not have more manure nutrients applied than is agronomically indicated in the nutrient management plan. Farmers who rely on off-site manure transfers to neighboring farms or for other uses should also consider the cropping system or other timing needs of manure recipients and plan their storage period appropriately.
Climate. The design capacity of manure storage will be influenced by the amount of time that manure must be stored during extended time periods that are undesirable for land application. Those include times when soils are frozen, snow-covered, or saturated. Design capacity for uncovered manure storage structures also needs to consider how much rain or snow melt may add to manure levels.
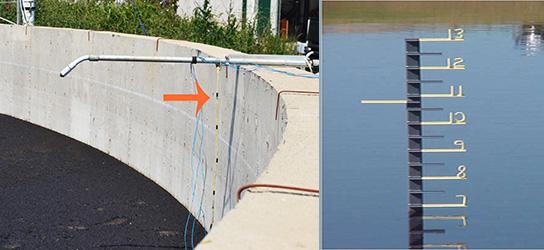
Photo 13. (Above) This collage shows two depth markers in manure storage structures. The concrete structure on the left includes a simple rope (see orange arrow) marked at regular intervals as a way to monitor manure levels. The marker on the right is more elaborate and includes (recommended) a “start pumping” mark (yellow bar extending to the left). The especially important levels a farm manager should know are “start pumping” when the level reaches design capacity and, for some structures, “stop pumping” when it reaches a lower limit. It is also important to know the level to which manure should be pumped/emptied before entering a season where land application is not possible. If a state bans manure application from December 15 until April 1 for example, a farm should know which mark manure levels should be below to ensure enough storage capacity going into that season. Concrete structure image courtesy of Robb Meinen, Pennsylvania State University and metal depth marker image courtesy of Leslie Johnson, University of Nebraska.
Future plans. What are the chances a farm will add more animals in the future? Expanding to 1,500 animals when the manure storage is designed for 1,000 means the structure will fill up faster than originally intended, making unlawful spills or inappropriate land application practices more likely.
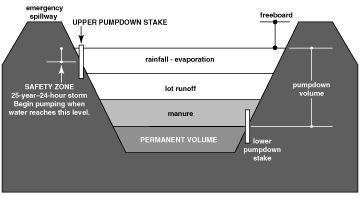
Figure 1. A schematic of the different categories of waste and the related volumes that the storage design must accommodate. More than just manure, process wastewater, or open lot runoff needs to be factored into the designed capacity. Anaerobic lagoons require a minimum volume at all times so that the bacteria treating the manure remain present and active. Some minimum storage level also helps keep the bottom sealed by preventing drying and cracking. Storage or treatment structures that do not have a roof or cover also need to hold typical rainfall or snowmelt for the area. Every storage structure storage should be designed and managed to maintain a margin of safety, or freeboard, so that it is never filled to the top. Figure courtesy of University of Missouri Extension via Dr. Charles Fulhage.
Photo 14. (Above) A manure storage structure about to overflow due to recent rainfall. This problem is most common when long winters or extended wet periods in the fall or spring make manure land application difficult or impossible. Managing this risk requires planning ahead as much as possible to prevent it. In this photo, the farm is agitating the manure and getting ready to apply it to a field to lower the manure level in the storage structure. Favorable weather conditions allowed application when field soil conditions were acceptable, or no longer saturated.
Consistency of Manure/Water Mixtures factsheet by Doug Hamilton (Oklahoma State University) explains the differences between solid, slurry, and liquid manure.
These materials were developed by the Livestock and Poultry Environmental Learning Center (LPELC) with funding from the U.S. Environmental Protection Agency and with input from the Natural Resources Conservation Service, National Cattlemen’s Beef Association, National Milk Producers Federation, National Pork Board, United Egg Producers, and U.S. Poultry and Egg Association.
For questions on these materials, contact Jill Heemstra, jheemstra@unl.edu. All images in this module, unless indicated otherwise, were provided by Jill.
Reviewers: Tetra Tech, Inc.; Joe Harrison, Washington State University; Rick Koelsch, University of Nebraska; and Tom Hebert, Bayard Ridge Group
To provide a forum for the introduction and evaluation of technologies that can treat dairy manure to the dairy farming community and the vendors that provide these technologies.
What Did We Do?
Newtrient has developed an on-line catalog of technologies that includes information on over 150 technologies and the companies that produce them as well as the Newtrient 9-Point scoring system and specific comments on each technology by the Newtrient Technology Advancement Team.
What Have We Learned?
Our interaction with both dairy farmers and technology vendors has taught us that there is a need for accurate information on the technologies that exist, where they are used, where are they effective and how they can help the modern dairy farm address serious issues in an economical and environmentally sustainable way.
Future Plans
Future plans include expansion of the catalog to include the impact of the technology types on key environmental areas and expansion to make the application of the technologies on-farm easier to conceptualize.
Corresponding author name, title, affiliation
Mark Stoermann & Newtrient Technology Advancement Team
All of the vendors and technology providers that have worked with us to make this effort a success need to be recognized for their sincere effort to help this to be a useful and informational resource.
The authors are solely responsible for the content of these proceedings. The technical information does not necessarily reflect the official position of the sponsoring agencies or institutions represented by planning committee members, and inclusion and distribution herein does not constitute an endorsement of views expressed by the same. Printed materials included herein are not refereed publications. Citations should appear as follows. EXAMPLE: Authors. 2017. Title of presentation. Waste to Worth: Spreading Science and Solutions. Cary, NC. April 18-21, 2017. URL of this page. Accessed on: today’s date.
Manage Cookie Consent
To provide the best experiences, we use technologies like cookies to store and/or access device information. Consenting to these technologies will allow us to process data such as browsing behavior or unique IDs on this site. Not consenting or withdrawing consent, may adversely affect certain features and functions.
Functional
Always active
The technical storage or access is strictly necessary for the legitimate purpose of enabling the use of a specific service explicitly requested by the subscriber or user, or for the sole purpose of carrying out the transmission of a communication over an electronic communications network.
Preferences
The technical storage or access is necessary for the legitimate purpose of storing preferences that are not requested by the subscriber or user.
Statistics
The technical storage or access that is used exclusively for statistical purposes.The technical storage or access that is used exclusively for anonymous statistical purposes. Without a subpoena, voluntary compliance on the part of your Internet Service Provider, or additional records from a third party, information stored or retrieved for this purpose alone cannot usually be used to identify you.
Marketing
The technical storage or access is required to create user profiles to send advertising, or to track the user on a website or across several websites for similar marketing purposes.