Alternative Manure Application Windows for Better Nutrient Utilization

Waste to Worth: Spreading science and solutions logoWaste to Worth home | More proceedings….

Abstract

The Maumee River watershed contributes 3% of the water but more than 40% of the nutrients entering Lake Erie. Data from the Ohio Tributary Loading Program has identified increasing levels of dissolved reactive phosphorus as the prime suspect in the recurrence of harmful algal blooms within Lake Erie. Livestock manure represents approximately 25% of the phosphorus applied in the watershed and can be a source of dissolved reactive phosphorus.

One project is a three year research project on applying liquid swine manure as a spring top-dress nitrogen source for soft red winter wheat.  Field-scale randomized block design replicated plots were conducted on farms. Liquid swine manure was surface applied and incorporated on all plots using a Peecon toolbar and compared to urea (46-0-0) fertilizer surface applied with a fertilizer buggy for wheat yield. Manure applications were made using a standard 5,000 gallon manure tanker in early April after the wheat had broken dormancy and field conditions were deemed suitable. Manure was applied at rates to approximate the nitrogen amount in the urea treatments. There was no statistical yield difference between using livestock manure or purchased urea fertilizer as the top-dress nitrogen source.

Another research project started in 2011 compared fall and spring applied manure. The fall treatment included an application of manure just before planting of a wheat cover crop. The wheat was killed in the spring and followed with a corn crop. A direct injection manure application was made to the corn that had not received manure in the fall. The fall applied manure had an average yield of 109 bu/ac and the spring applied had an average yield of 205 bu/ac.

The potential to use liquid manure on growing crops opens a new window of opportunity to reduce phosphorus loading into Lake Erie.

Purpose

To compare manure nutrient field application timing throughout the year and with commercial fertilizer in order to maximize crop yield and minimize nutrient loss.

What Did We Do?

Topdressed wheat in the spring with manure and urea. Corn applications include topdressing and sidedressing corn fields in the fall and spring.

What Have We Learned?

Wheat topdressed with manure has yielded equal to or greater than urea. Preliminary results show sidedressing applications made to corn in the spring yield better than fall applications.

No statistically significant yield difference was found between spring applied urea and manure to soft red winter wheat.

There was a statsitcally significant yield difference between both fall manure applications (manure and manure plus a nitrogen inhibitor) and the spring sidedressed manure.

Future Plans

Continue the wheat study and are adding cover crops to the corn study.

Authors

Amanda Douridas, Extension Educator, The Ohio State University Extension Douridas.9@osu.edu

Glen Arnold, Manure Nutrient Management Field Specialist, The Ohio State University Extension

Additional Information

http://agcrops.osu.edu/on-farm-research

The authors are solely responsible for the content of these proceedings. The technical information does not necessarily reflect the official position of the sponsoring agencies or institutions represented by planning committee members, and inclusion and distribution herein does not constitute an endorsement of views expressed by the same. Printed materials included herein are not refereed publications. Citations should appear as follows. EXAMPLE: Authors. 2013. Title of presentation. Waste to Worth: Spreading Science and Solutions. Denver, CO. April 1-5, 2013. URL of this page. Accessed on: today’s date.

Combustion of Poultry Litter: A Comparison of Using Litter for On-Farm Space Heating Versus Generation of Electricity

Waste to Worth: Spreading science and solutions logoWaste to Worth home | More proceedings….

Abstract

This presentation will compare using litter as a replacement for LP gas for on-farm space heating with using litter to generate electricity. The comparison includes heating system efficiency, amount of LP off-set possible, value of plant nutrients in the litter, quantity and value of plant nutrients in the litter ash, impact of brokerage, and costs of producing the energy. It was concluded that using litter on-farm as a source of space heat and using the litter ash as fertilizer could provide a potential value of $48 per ton of litter. However, on-farm combustion of litter to produce electricity resulted in a loss of about – $3/ton of litter. Therefore, if a heating and ash management system can be implemented in a cost-effective manner use of litter to off-set 90% or more of the heating energy requirements would be the better of these two alternatives.

Why Is Energy Use Important in Poultry Production?

Modern poultry production requires substantial amounts of energy for space heating (propane/LP gas), ventilation, feed handling, and lighting. It was determined that annual LP gas consumption in broiler houses can range from 150 to 300 gallons of LP per 1000 square feet of floor space with an average of about 240 gal LP/1000 ft2 observed in South Carolina. Similarly, broiler production in South Carolina requires about 2326 kWh/1000 ft2 of house area. As a result, a 6-house broiler farm in SC uses about 30,240 gallons of LP and 293.076 kWh of electricity annually. The cost for energy for a 6-house farm is on the order of $57,456 per year for LP ($1.90/gal LP) and $35,169 per year for electricity ($0.12/kWh). Energy costs have more than doubled over the last decade and as a result producers are very interested in ways to reduce on-farm energy costs by using the energy contained in the litter. The objective of this study was to compare using litter as a replacement for LP gas for on-farm space heating with using litter to generate electricity.

What Did We Do?

Our analysis included heating system efficiency, amount of LP off-set possible, value of plant nutrients in the litter, quantity and value of plant nutrients in the litter ash, impact of brokerage, and costs of producing the energy.

What Have We Learned?

It was concluded that using litter on-farm as a source of space heat and using the litter ash as fertilizer could provide a potential value of $46 to $55 per ton of litter. However, on-farm combustion of litter to produce electricity resulted in a loss of about $3/ton of litter. Therefore, if a heating and ash management system can be implemented in a cost-effective manner use of litter to off-set 90% or more of the heating energy requirements would be the better of these two alternatives.

Future Plans

This information is being used in extension programs that target poultry producers.

Authors

Dr. John P. Chastain, Professor and Extension Agricultural Engineer,  School of Agricultural, Forestry, and Environmental Sciences, Clemson University, jchstn@clemson.edu

Additional Information

Chastain, J.P., A. Coloma-del Valle, and K.P. Moore. 2012. Using Broiler Litter as an Energy Source: Energy Content and Ash Composition. Applied Engineering in Agriculture Vol 28(4):513-522.

Acknowledgements

Support was provided by the Confined Animal Manure Managers Program, Clemson Extension, Clemson University, Clemson, SC.


The authors are solely responsible for the content of these proceedings. The technical information does not necessarily reflect the official position of the sponsoring agencies or institutions represented by planning committee members, and inclusion and distribution herein does not constitute an endorsement of views expressed by the same. Printed materials included herein are not refereed publications. Citations should appear as follows. EXAMPLE: Authors. 2013. Title of presentation. Waste to Worth: Spreading Science and Solutions. Denver, CO. April 1-5, 2013. URL of this page. Accessed on: today’s date.

From Waste to Energy: Life Cycle Assessment of Anaerobic Digestion Systems

Waste to Worth: Spreading science and solutions logoWaste to Worth home | More proceedings….

Abstract

In recent years, processing agricultural by-products to produce energy has become increasingly attractive due to several reasons: centralized availability of low cost by-products, avoiding the fuel vs. food debate, reduction of some associated environmental impacts, and added value that has the potential to generate additional income for producers. Anaerobic digestion systems are one waste-to-energy technology that has been proven to achieve these objectives.  However, investigation on the impacts of anaerobic digestion has focused on defined segments, leaving little known about the impacts that take place across the lifecycle. Current systems within the U.S. are dairy centric with dairy manure as the most widely used substrate and electricity production as the almost sole source for biogas end use.  Recently, there is more interest in exploring alternative feedstocks, co-digestion pathways, digestate processing, and biogas end uses.  Different operational and design practices raise additional questions about the wide reaching impacts of these decisions in terms of economics, environment, and operational aspects, which cannot be answered with the current state of knowledge.

Why Study the Life Cycle of Anaerobic Digestion?

Waste management is a critical component for the economic and environmental sustainability of the agricultural sector. Common disposal methods include land application, which consumes large amounts of land resources, fossil energy, and produces significant atmospheric GHG emissions. Proof of this is that agriculture accounts for approximately 50% of the methane (CH4) and 60% of the nitrous oxide (N2O) global anthropogenic emissions, being livestock manure one of the major sources of these emissions (Smith et al., 2007). In the last decades, the development of anaerobic digestion (AD) systems has contributed to achieve both climate change mitigation and energy independence by utilizing agricultural wastes, such as livestock manure, to produce biogas. In addition, it has been claimed that these systems contribute to nutrient management strategies by adding flexibility to the final use and disposal of the remaining digestate. Despite these advantages, the implementation of AD systems has been slow, due to the high investment and maintenance costs. In addition, little is still known about the lifecycle impacts and fate and form of nutrients of specific AD systems, which would be useful to validate their advantages and identify strategic and feasible areas for improvement.

The main goal of this study is to quantify the lifecycle GHG emissions, ammonia emissions, net energy, and fate and form of nutrients of alternative dairy manure management systems including land-spread, solid-liquid separation, and anaerobic digestion. As cow manure is gaining an important role within the biofuel research in the pursuit for new and less controversial feedstocks, such as corn grain, the results of this study will provide useful information to researchers, dairy operators, and policy makers.

What Did We Do?

Lifecycle sustainability assessment (LCSA) methods were used to conduct this research, which is focused in Wisconsin. The state has nearly 1.3 million dairy cows that produce approximately 4.7 million dry tons of manure annually and is the leading state for implemented agricultural based AD systems. Manure from a 1,000 milking cow farm (and related maintenance heifers and dry cows) was taken as the base-case scenario. Four main processes were analyzed using the software GaBi 5 (PE, 2012) for the base case: manure production and collection, bedding sand-separation, storage, and land application. Three different manure treatment pathways were compared to the base-case scenario: including a solid-liquid mechanical separator, including a plug-flow anaerobic digester, and including both the separator and the digester. The functional unit was defined as one kilogram of excreted manure since the function of the system is to dispose the waste generated by the herd. A cradle-to-farm-gate approach was defined, but since manure is considered waste, animal husbandry and cultivation processes were not included in the analysis (Fig. 1). Embedded and cumulative energy and GHG emissions associated with the production of material and energy inputs (i.e. sand bedding, diesel, electricity, etc.) were included in the system boundaries; however, the production of capital goods (i.e. machinery and buildings) were excluded.
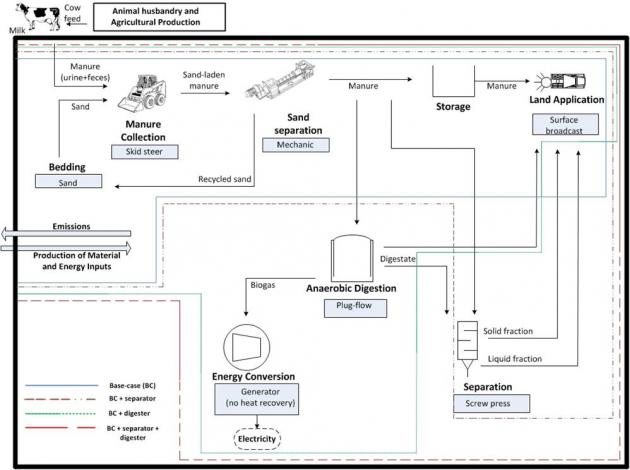
Figure 1. System boundaries of the base case scenario (land-spread manure) and the three manure treatment pathways: 1) solid-liquid separation, 2) anaerobic digestion, 3) anaerobic digestion and solid-liquid separation.

Global warming potential (GWP) was characterized for a 100-year time horizon and measured in kg of carbon dioxide equivalents (CO2-eq). Characterization factors used for gases other than CO2 were 298 kg CO2-eq for N2O, 25 kg CO2-eq for abiotic CH4 based on the CML 2001 method, and 24 kg CO2-eq for biotic CH4. CO2 emissions from biomass are considered to be different from fossil fuel CO2 emissions in this study; the former recycles existing carbon in the system, while the latter introduces new carbon into the atmosphere. In this context, it will be assumed that CO2 emissions from biomass sources were already captured by the plant and will not be characterized towards GWP[1]. This logic was applied when characterizing biogenic methane as one CO2 was already captured by the plant, therefore, reducing the characterization factor from 25 kg CO2-eq to 24 kg CO2-eq. Even though ammonia (NH3) does not contribute directly to global warming potential, it is considered to be an indirect contributor to this impact category (IPCC, 2006).

Data was collected from different sources to develop lifecycle inventory (LCI) as specific to Wisconsin as possible, in order to maximize the reliability, completeness, and representativeness of the model. The following points summarize some of the data sources and assumptions used to construct the LCI:

  • Related research (Reinemann et al., 2010): This model provided data about animal husbandry and crop production for dairy diet in Wisconsin.
  • Manure management survey: The survey, sent to dairy farms in Wisconsin, has the objective of providing information related to manure management practices and their associated energy consumption.
  • In house experiments: laboratory experiments, conducted at the University of Wisconsin-Madison, provided characterization data about manure flows before and after anaerobic digestion and solid-liquid separation and manure density in relation to total solids (Ozkaynak and Larson, 2012).
  • Material and energy databases: National Renewable Energy Laboratory U.S. LCI dataset (NREL, 2008), PE International Professional database (PE, 2012), and EcoInvent (EcoInvent Center, 2007), which are built into GaBi 5. The electricity matrix used in this LCA represents the mix of fuels that are part of the electric grid of Wisconsin.
  • Representative literature review.

Biotic emissions from manure have been cited to be very site specific (IPCC, 2006) and even though the Intergovernmental Panel on Climate Change (IPCC) provides regional emission factors, they are only for CH4 and N2O. Specific GHG emission factors were developed for Wisconsin based on the Integrated Farm System Model (IFSM) (Rotz et al., 2011), and by using key parameters that affect emissions (e.g. temperature, volatile solids, manure management practices) for each stage of the manure management lifecycle.

What Have We Learned?

Emissions are produced from consumed energy and from manure during each stage of the manure management lifecycle. In the base-case scenario, manure storage is the major contributor to GHG emissions. In this scenario, a crust tends to form on top of stored manure due to the higher total solids content when compared to digested manure and the liquid fraction of the separated manure. The formation of this crust affects overall GHG emissions (e.g. crust formation will increase N2O emissions but reduce CH4 emissions). The installation of a digester reduces CH4 emissions during storage due to the destruction of volatile solids that takes place during the digestion process. However, some of the organic nitrogen changes form to ammoniacal nitrogen, increasing ammonia and N2O emissions posterior to storage and land application. Energy consumption increases with both anaerobic digester and separation, but net energy is higher with anaerobic digestion due to the production of on-farm electricity. The nutrient balance is mostly affected by the solid-liquid separation process rather than the anaerobic digestion process.

Future Plans

A comprehensive and accurate evaluation of the lifecycle environmental impacts of AD systems requires assessing the multiple pathways that are possible for the production of biogas, which are defined based on local resources, technology, and final uses of the resulting products.  A second goal of this research is to quantify the net GHG and ammonia emissions, net energy gains, and fate of nutrients of multiple and potential biogas pathways that consider different: i) biomass feedstocks (e.g miscanthus and corn stover), ii) management practices and technology choices, and iii) uses of the produced biogas (e.g. compressed biogas for transportation and upgraded biogas for pipeline injection) and digestate (e.g. bedding). This comprehensive analysis is important to identify the most desirable pathways based on established priorities and to propose improvements to the currently available pathways.

Authors

Aguirre-Villegas Horacio Andres. Ph.D. candidate. Department of Biological Systems Engineering, University of Wisconsin-Madison.  aguirreville@wisc.edu

Larson Rebecca. Ph.D. Assistant Professor. Department of Biological Systems Engineering, University of Wisconsin-Madison.

Additional Information

    • Ozkaynak, A. and R.A. Larson.  2012.  Nutrient Fate and Pathogen Assessment of Solid Liquid Separators Following Digestion.  2012 ASABE International Meeting, Dallas, Texas, August 2012

References

De Klein C., R. S.A. Novoa, S. Ogle, K. A. Smith, P. Rochette, T. C. Wirth,  B. G. McConkey, A. Mosier, and K. Rypdal. 2006. Chapter 11: N2O emissions from managed soils, and CO2 emissions from lime and urea application. In Volume 4: Agriculture, Forestry and Other Land Use. IPCC 2006, 2006 IPCC Guidelines for National Greenhouse Gas Inventories, Prepared by the National Greenhouse Gas Inventories Programme, Eggleston H.S., Buendia L., Miwa K., Ngara T. and Tanabe K. (eds). Published: IGES, Japan.

Ecoinvent Centre.2007. Ecoinvent Eata. v2.0. Ecoinvent Reports No.1-25. Swiss Centre for Life Cycle Inventories. Dübendorf.

National Renewable Energy Laboratory (NREL). 2008. U.S. Life-Cycle Inventory (LCI) Database.

Ozkaynak, A. and R.A. Larson.  2012.  Nutrient Fate and Pathogen Assessment of Solid Liquid Separators Following Digestion.  2012 ASABE International Meeting, Dallas, Texas, August 2012

PE International. 2012. Software-systems and databases for lifecycle engineering.

Reinemann D. J., T.H. Passos-Fonseca, H.A. Aguirre-Villegas, S. Kraatz, F. Milani, L.E. Armentano, V. Cabrera, M. Watteau, and J. Norman. 2011. Energy intensity and environmental impact of integrated dairy and bio-energy systems in Wisconsin, The Greencheese Model.

Rotz, C. A., M. S. Corson, D. S. Chianese, F. Montes, S.D. Hafner, R. Jarvis, and C. U. Coiner. 2011. The Integrated Farm System Model (IFSM). Reference Manual Version 3.4. Accessed on Nov, 2012. Available at: http://www.ars.usda.gov/Main/docs.htm?docid=8519

Smith, P., D. Martino, Z. Cai, D. Gwary, H. Janzen, P. Kumar, B. McCarl, S. Ogle, F. O’Mara, C. Rice, B. Scholes, O. Sirotenko. 2007: Agriculture. In Climate Change 2007: Mitigation. Contribution of Working Group III to the Fourth Assessment Report of the Intergovernmental Panel on Climate Change [B. Metz, O.R. Davidson, P.R. Bosch, R. Dave, L.A. Meyer (eds)], Cambridge University Press, Cambridge, United Kingdom and New York, NY, USA.

Acknowledgements

This work was funded by the Wisconsin Institute for Sustainable Agriculture (WISA-Hatch)

The authors are solely responsible for the content of these proceedings. The technical information does not necessarily reflect the official position of the sponsoring agencies or institutions represented by planning committee members, and inclusion and distribution herein does not constitute an endorsement of views expressed by the same. Printed materials included herein are not refereed publications. Citations should appear as follows. EXAMPLE: Authors. 2013. Title of presentation. Waste to Worth: Spreading Science and Solutions. Denver, CO. April 1-5, 2013. URL of this page. Accessed on: today’s date.

What Is Manure Worth Web Calculator


Livestock producers face uncertain markets and narrow margins

calculatorThis situation motivates growers to optimize production methods, utilizing all resources including manure. In addition, an increase in the price of commercial fertilizer experienced since 2009, has heightened interest in the use of manure for supplying crop nutrients and has significantly increased the value of manure as a nutrient source.

Estimates of the economic value of manure are important in comparing manure application rates and methods, valuing manure for off-farm sale, budgeting new facilities, and evaluating contract livestock production opportunities.

Free Manure Value Calculator

The University of Minnesota has developed a free calculator to rapidly estimate the value of manure for specific manure types, application methods, soil nutrient status, and crop need.

For more information, see the University of Minnesota’s page on Animal Waste/Manure Economics

The estimates are based on fertilizer replacement value and application costs. The manure economic value is calculated as shown below.

Net Economic Impact of Manure = Value of First-Year Fertilizer Replaced (N, P2O5, K2O, and micronutrients) & Fertilizer Application Costs Avoided + Residual Value in the Second Year or Later (if any, this relates to fertilizer nutrients that would have been purchased) +/- Non-NPK Yield Response (and possibly tillage impacts and weed control impacts)

Simple Steps to Evaluate Manure Value

In Step 1, enter current fertilizer (if using no manure) and N, P, K, and micronutrients needs for the crop.

In Step 2, choose the manure source, amount and nutrient content, and application method.

Step 3 considers some final adjustments such as second year benefits, tillage saving and yield boost impact.

How much land will I need for land-applying manure from dairy cattle?

Many factors impact land requirements including:
1) Dairy feeding program: Feeding excess protein or P increases N and P excretion.
2) Animal performance: Higher-producing cows excrete more manure; 90 lb milk/day was assumed in the example below.
3) Crop yields: A 24-ton/acre and 6-ton/acre yield for corn silage and alfalfa was assumed in the example below.
4) Use of manure on legume crops: Lack of economic return from manure N and possible damage to alfalfa may discourage use of manure on alfalfa by some dairies.

An additional factor is whether a nutrient plan is based on nitrogen (N) or phosphorus (P). For a crop rotation that is predominantly corn silage and alfalfa hay, the approximate land requirement per lactating cow is shown below for a manure system that conserves N and for three distinct dairy rations:

Manure Applied to Corn Only: N / P-based rates
Current Recommendations (18.5% CP & 0.33 %P): 3.1 / 3.1 acres per cow.
Ration with 30% DGS (20.4% CP & 0.45% P): 3.6 / 3.8 acres per cow.
Ration from 10 years ago (18.5% CP & 0.5% P): 3.1 / 4.1 acres per cow.

Manure Applied to Corn and Alfalfa: N / P-based rates
Current Recommendations (18.5% CP & 0.33 %P): 1.7 / 1.7 acres per cow.
Ration with 30% DGS (20.4% CP & 0.45% P): 1.9 / 2.0 acres per cow.
Ration from 10 years ago (18.5% CP & 0.5% P): 1.7 / 2.2 acres per cow.

30% DGS: 30% inclusion of distillers grains with solubles on a dry matter basis.

Several observations result from this information. First, a traditional rule of thumb of 1 acre per cow is possibly too simplistic for modern dairy cattle. Second, as the concentration of P in the dairy ration has decreased, N often becomes the limiting nutrient for manure application, and so an N and P-based application rate is often similar (this is true for nitrogen-conserving system only and assumes that manure application never exceeds N requirement). Third, use of DGS in the diet increases both N and P excretion and the resulting land required for managing manure.

Tools and fact sheets to assist dairy nutrient planning can be found at eXtension LPE Feed Management. To determine land requirements for your own farm, you may want to enter your own farm-specific information into a Nutrient Inventory spreadsheet.

Author: Rick Koelsch, University of Nebraska

What’s the P Index?

The P Index is the Phosphorus Index, a risk assessment tool to quantify the potential for phosphorus runoff from a field. The P Index helps to target critical source areas of potential P loss for greater management attention. It includes source and transport factors. Source factors address how much P is available (for example, soil test P level and P fertilizer and manure application amounts). Transport factors evaluate the potential for runoff to occur (for example, soil erosion, distance and connectivity to water, soil slope, and soil texture). The P Index allows for relative comparisons of P runoff risk. When the P Index is high, recommendations are made either to apply manure on a P basis or not to apply manure at all. When the P Index is low, manure can be applied on a N basis. Also, if the P Index is high, the factors that are responsible for the higher risk of P loss are identified, and this information provides guidance for management practices to reduce the risk. For example, if the P Index is high because of high soil erosion, a recommendation to implement soil conservation best management practices (BMPs) may lower the risk and allow safe manure application.

For additional information:

To find your state’s P Index, do a web search for “phosphorus index” plus your state name.

Author: Jessica Davis, Colorado State University

What are typical values for the higher heating value of manure scraped from cattle feedyard surfaces?

The higher heating value of manure scraped from cattle feedyard surfaces depends primarily on its ash and moisture content. If the manure’s ash and water were completely removed with only the combustible fraction remaining as a residue, that (primarily organic) residue would have a higher heating value (HHV) of about 8,500 BTU per pound, as determined experimentally by Annamalai et al. (1987) and Rodriguez et al. (1998). That figure of 8,500 BTU/lb is known as a “dry, ash-free” (DAF) fuel value. To estimate the HHV of actual feedyard manure (i.e., in its “as-received” or “as-is” state), which always has some ash and some moisture in it, you can multiply the 8,500 BTU/lb figure by (1 – ash) and (1 – moisture). In this case, “ash” is the manure’s ash content expressed as a fraction (dry basis), and “moisture” is the manure’s moisture content as a fraction (wet basis). For example, a manure sample having 40% ash (dry basis) and 20% moisture (wet basis) would have an HHV of approximately: HHV(ash = 40%, moisture = 20%) = 8,500 BTU/lb x (1 – 0.40) x (1 – 0.20) = 8,500 x 0.6 x 0.8 = 4,080 BTU/lb Cattle manure (as excreted) has about 75% moisture and 15% ash, which translates to an HHV around 1,750 BTU/lb. On the feedyard surface, it generally dries out and may reach moisture contents as low as 15 to 20%. Depending on whether the corral surfaces are paved or native soil, the ash content may increase dramatically. HHV values between 2,000 and 5,000 BTU/lb are common, but they are highly variable because of moisture and ash dynamics of these outdoor facilities. Fuel value of manure generated in full confinement?under roof, on concrete?can be more tightly controlled.

Other cited literature:

Annamalai, K., J. M. Sweeten and S.C. Ramalingam. 1987. Estimation of gross heating values of biomass fuels. Transactions of the ASAE 30(4):1205-1208. Rodriguez, P.G., K. Annamalai, and J.M. Sweeten. 1988. The effect of drying on the heating value of biomass fuels. Transactions of the ASAE 41(4):1083-1087


How can I prevent leaching of nitrate into groundwater from manure applications?

Nitrate contamination of groundwater occurs when excess nitrate in the soil profile moves along with water that is moving down past the root zone of the crop. In most cases, it is not possible to keep water from moving past the roots, so the only other option for preventing nitrate leaching is to avoid having excess nitrate present in the root zone during times when leaching events are likely to occur. Determine the available nitrogen content of manure prior to application, and don’t apply more available nitrogen than the crop can use. Make the applications as close to the time the crop will use the nitrogen as possible.

Although only available nitrogen is subject to leaching, organic form nitrogen will become available as it mineralizes, at which time it too can leach if not utilized by the crop. The amount of nitrogen that will mineralize prior to and during the crop season should be taken into account when calculating manure application rates. If significant mineralization from previous applications is expected, plan to have a crop present to utilize it prior to leaching events.