Greenhouse gas impacts resulting from co-digestion of dairy manure with community substrates

Purpose

The US Dairy industry established a voluntary environmental stewardship goal to achieve greenhouse gas (GHG) neutrality by 2050 among farmers and processors collectively. Manure management and enteric emissions combined account for approximately 70% of the GHG footprint of the US dairy industry, with nearly equal contributions from each (Thoma, 2013). There are multiple manure management systems used by dairy farmers in the Northeast and Upper Midwest that substantially impact GHG emissions. Quantification of GHG emissions for different manure management systems is necessary to compare options and strategies that can be applied to reduce GHG, especially methane, to move toward sustainability and reach the targets set by industry and governments.

Methane is the primary GHG emitted from the long-term storage of dairy manure, a water quality best management practice employed by many dairy farms today. Landfills are also a significant source of methane emission primarily due to degradation of organic waste, notably pre- and post-consumer food wastes (community substrates). Methane is a highly potent GHG that impacts warming by 25 – 28 times as much as carbon dioxide (CO2) on a 100-year global warming potential (GWP) time scale (US EPA). However, because methane has a lifespan in the atmosphere of around 12 years, it has been accounted for on a 20-year GWP scale (84 times the impact of CO2) by the State of New York (Climate Leadership and Community Protection Act). Manure management systems that substantially reduce methane, such as the co-digestion of manure with food waste, can achieve significant reductions of the GHG emissions associated with milk production.

What Did We Do?

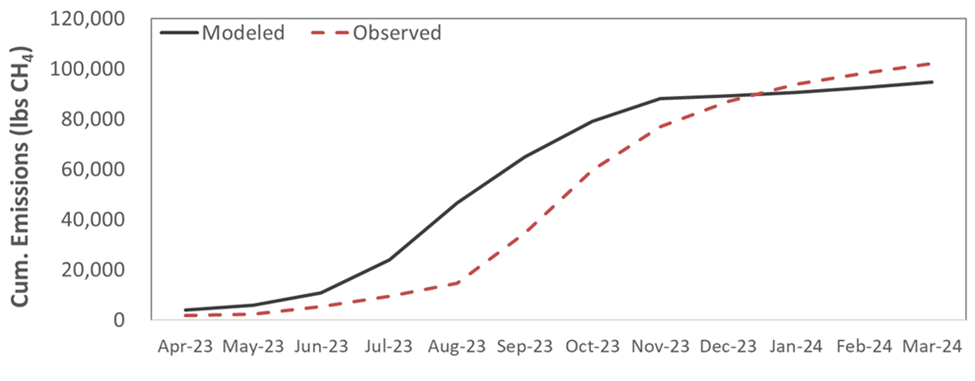
The GHG emissions resulting from the anaerobic co-digestion of raw dairy manure and community substrate (i.e., food processing waste mixture diverted from landfilling) in an equal mass of each (total mass basis) were calculated as part of a larger study comparing eight different manure management systems. The community substrate was modeled as 50% ice cream and 50% dog food by mass. Methane and nitrous oxide emissions were calculated with equations that use the mass flow of volatile solids (VS) and nitrogen through the co-digestion manure management system that included digestate solid-liquid separation using a screw press and the long-term storage of separated liquid. Carbon dioxide and methane associated with system energy use and energy production as pipeline-quality renewable natural gas (RNG), as well as landfill organics diversion were also calculated. The parasitic energy use (heat and electricity) of the digester and related manure management and biogas upgrading equipment was supplied on an average annual load basis by a portion of the biogas produced. The total net GHGs were summed using a CO2-equivalent (CO2e) methodology (both GWP100 and GWP20 were computed) and normalized on a per lactating cow per year basis. A sensitivity analysis of eleven variables was conducted to quantify the impact of each on the net GHG result.

What Have We Learned?

The co-digestion system net annual GHG impact was calculated to be −16 metric tons (MT) CO2e cow-1 (GWP100) and −43 MT CO2e cow-1 (GWP20). For the co-digestion mixture analyzed (50% liquid dairy manure, 25% ice cream, and 25% dog food), the anaerobic digester biogas production was 4 times greater than the biogas production for manure alone (on a per lactating cow basis). This significant energy production potential contributed an offset of 3.9 MT CO2 cow-1 year-1, assuming the net RNG after supplying the system’s parasitic energy usage displaced the CO2 emissions from combusting approximately 380 gallons of diesel. In comparison, a methane leakage (or loss) of 2% from the digester to RNG system was equivalent to 18% of the energy offset at GWP100 (0.7 MT CO2e cow-1 year-1) and 62% at GWP20 (2.4 MT CO2e cow-1 year-1). Despite the greater contribution of methane leakage at GWP20 on a CO2e basis, the methane offset from landfilling the community substrate also substantially increased, resulting in just a 5 – 6% increase in the net annual GHG (remaining net negative) when methane leakage was varied from 1 to 3% under both GWP time scales. The methane leakage amount was also the most sensitive variable studied for the co-digestion system and the relatively low impact on total net GHG indicates the effectiveness of this type of manure management system as a tool to reach net GHG neutrality.

Future Plans

A next step in the assessment of co-digestion of dairy manure and food waste diverted from landfills is to continue improvement of our Cornell Dairy Digester Simulation Tool that predicts biogas production from a variety of food wastes combined in different quantities with dairy manure. This tool will also allow for the economic feasibility analysis of different co-digestion system sizes and substrate mixtures, inclusive of tipping fee variation and energy generation options (electricity and RNG) and associated values. This work will help farmers assess the feasibility of implementing or participating in a co-digestion system for manure management.

In future work contingent on funding, we plan to conduct comprehensive field measurements of methane emissions from the long-term storage of raw manure, separated manure liquid, and digested effluent. The equations that calculate methane are gross and depend on volatile solid content and degradability of the stored material, as well as temperature and retention time. Verification of these equations and inputs will give more confidence in utilizing bottom-up calculations of GHGs from manure management practices.

Authors

Lauren Ray, Extension Support Specialist III, Cornell PRO-DAIRY Dairy Environmental Systems Program

Corresponding author email address

LER25@cornell.edu

Additional authors

Curt A. Gooch, Sustainable Dairy Product Owner, Land O’Lakes – Truterra; Peter E. Wright, Extension Associate, Cornell PRO-DAIRY Dairy Environmental Systems Program

Additional Information

More information on related work can be found on the Cornell University PRO-DAIRY website under Environmental Systems: https://cals.cornell.edu/pro-dairy/our-expertise/environmental-systems.

Thoma, G., J. Popp, D. Shonnard, D. Nutter, M. Matlock, R. Ulrich, W. Kellogg, D. S. Kim, Z. Neiderman, N. Kemper, F. Adom, and C. East. (2013). Regional analysis of greenhouse gas emissions from USA dairy farms: A cradle to farm-gate assessment of the American dairy industry circa 2008. Int. Dairy J. 31:S29–S40. https://doi.org/10.1016/j.idairyj.2012.09.010.

US EPA, https://www.epa.gov/ghgemissions/understanding-global-warming-potentials. Accessed 2/24/2022.

Climate Leadership and Community Protection Act. 2020. New York State Senate Bill S6599.

Acknowledgements

The Coalition for Renewable Natural Gas and the New York State Department of Agriculture and Markets provided a portion of the financial resources to support the development of this work.


The authors are solely responsible for the content of these proceedings. The technical information does not necessarily reflect the official position of the sponsoring agencies or institutions represented by planning committee members, and inclusion and distribution herein does not constitute an endorsement of views expressed by the same. Printed materials included herein are not refereed publications. Citations should appear as follows. EXAMPLE: Authors. 2022. Title of presentation. Waste to Worth. Oregon, OH. April 18-22, 2022. URL of this page. Accessed on: today’s date.
Emission of ammonia, hydrogen sulfide, and greenhouse gases following application of aluminum sulfate to beef feedlot surfaces

Purpose

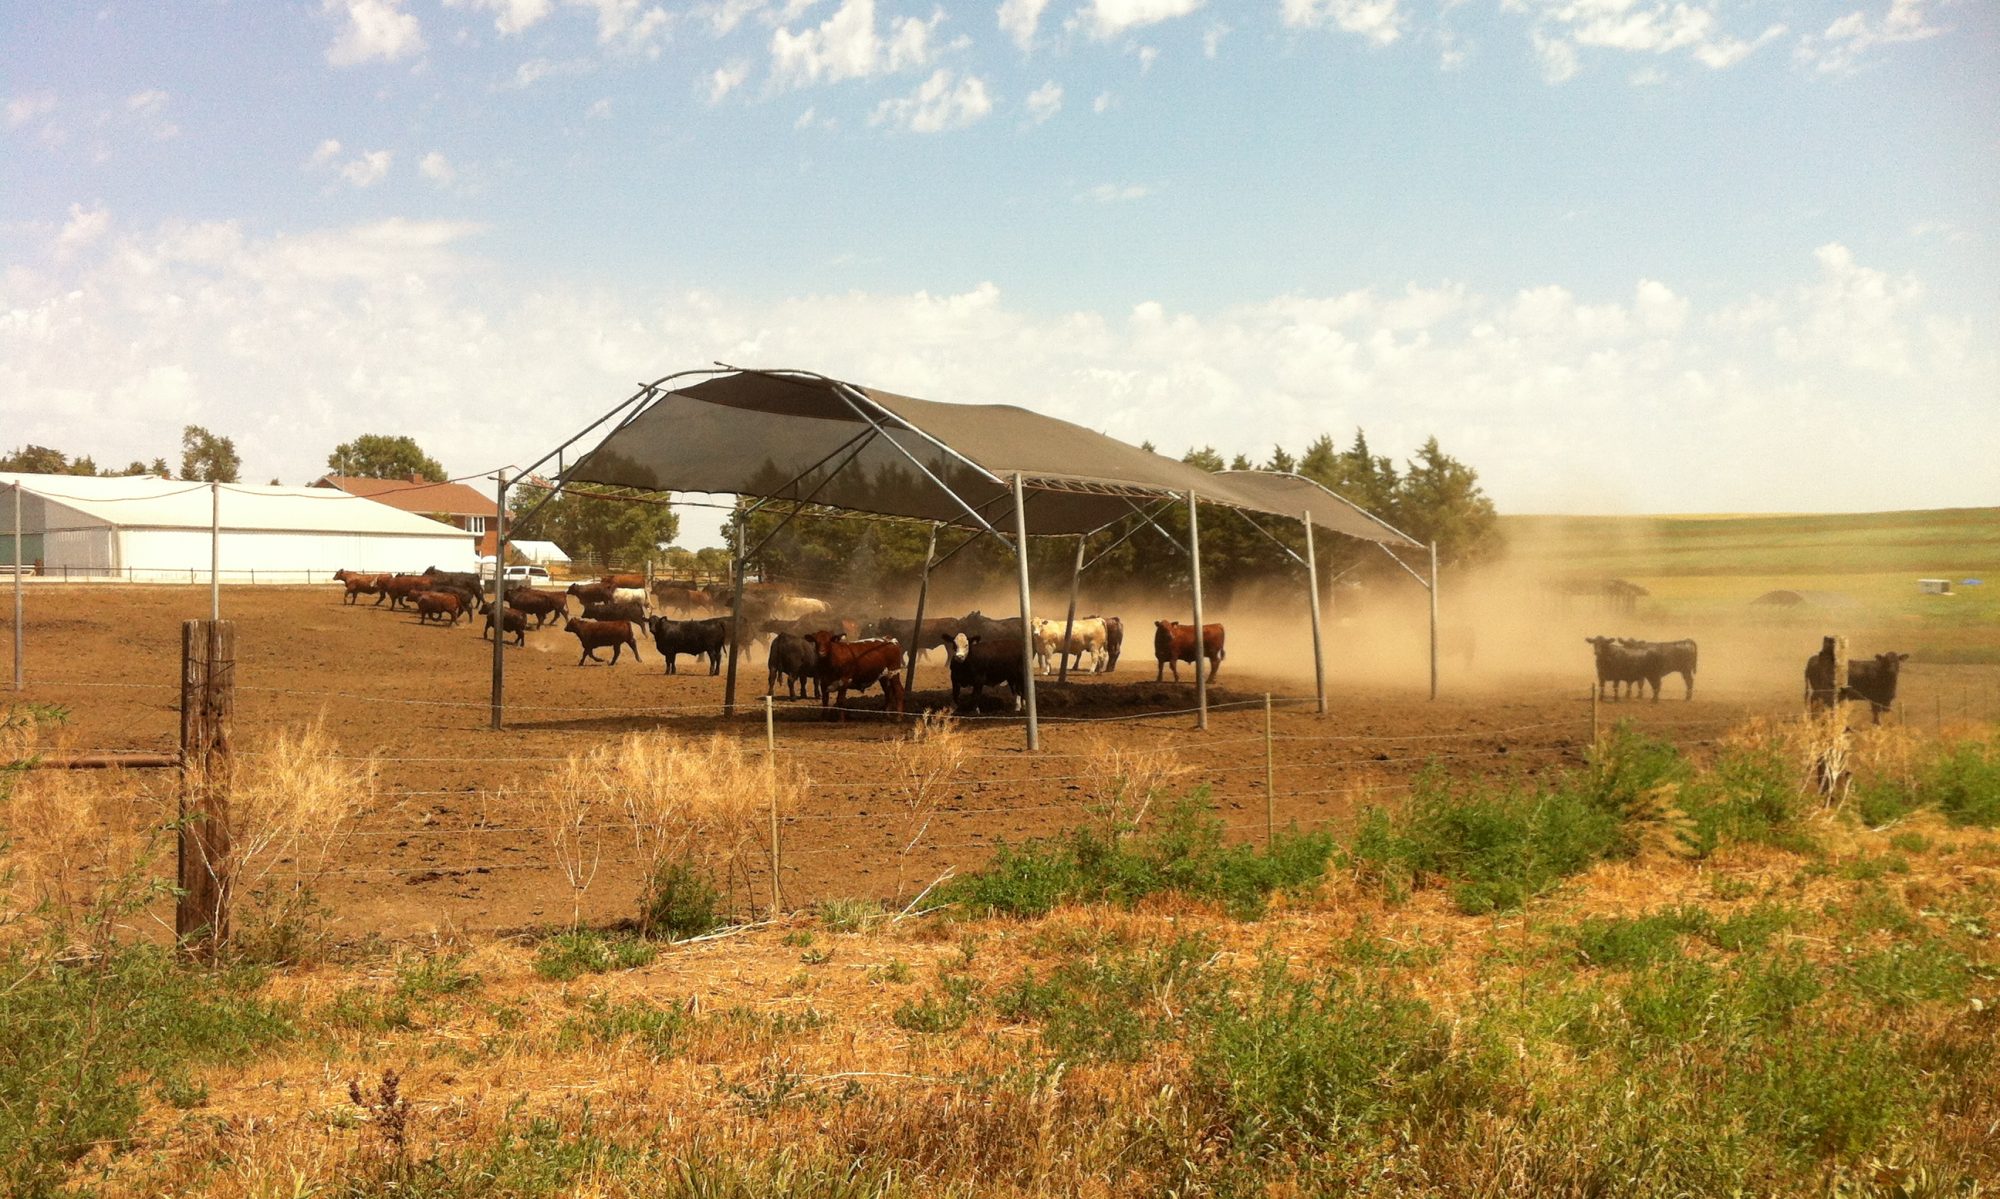
Alum has been successfully used in the poultry industry to lower ammonia (NH3) emission from the barns. However, it has not been evaluated to reduce NH3 on beef feedlot surfaces. Additionally, it is not known how it would affect other common emissions from beef feedlot surfaces. The purpose of this study was to determine the effect of adding aluminum sulfate to beef feedlot surfaces on NH3, hydrogen sulfide (H2S), carbon dioxide (CO2), methane (CH4), and nitrous oxide (N2O) emissions.

What Did We Do?

Eight feedlot pens (30 animals per pen) at the U.S. Meat Animal Research Center feedlot were utilized. The pens had a central mound constructed on manure and soil and 3 m concrete apron by the feed bunk and cattle were fed a corn-silage based diet. Four pens (30 cattle/pen) had 10% (g g-1) alum applied to the 6 meters immediately behind the concrete bunk apron and four did not receive alum. The amount of alum added to the area was determined on a mass basis for a depth of 5 cm of feedlot surface material (FSM) using the estimated density of feedlot surface material for Nebraska feedlots (1.5 g cm−3). On sampling days, six representative grab samples were collected from the feedlot surface from the six-meter area behind the bunk apron in each pen; samples were combined within pen to make three representative replicates per pen (N=24). Each of the three pooled samples per pen were measured for pH, NH3, H2S, CH4, CO2, and N2O using petri dishes and wind tunnels in an environmental chamber at an ambient temperature of 25°C (77°F) and 50% relative humidity. Flux measurements for NH3, H2S, CH4, CO2, and N2O flux were measured for 15 minutes using Thermo Fisher Scientific 17i, 450i, 55i, 410iQ, and 46i gas analysis instruments, respectively. Samples were analyzed at day -1, 0, 5, 7, 12, 14, 19, 21, and 26.

What Have We Learned?

Addition of alum lowered pH of FSM from 8.3 to 4.8 (p < 0.01) and the pH remained lower in alum-treated pens for 26 days (p < 0.01). Although the pH remained low, NH3 flux was only lower (p < 0.01) at day 0 and day 5 for alum-treated pens compared to the pens with no alum treatment. Nitrous oxide emission was not affected by alum treatment (6.2 vs 5.7 mg m-2 min-1, respectively for 0 and 10% alum treated pens). Carbon dioxide emission was lower for alum-treated pens than non-treated pens from day 5 until the end of the study (p < 0.05), perhaps due to suppressed microbial activity from the lower pH. Hydrogen sulfide emission was higher (p < 0.05) from alum-treated feedlot surface material (0.8 mg m-2 min-1) compared to non-treated feedlot surface material (0.3 mg m-2 min-1), likely due to addition of sulfate with alum. Methane emission was also higher in alum-treated pens (173.6 mg m-2 min-1) than non-treated pens (81.4 mg m-2 min-1). The limited reduction in NH3, along with increased H2S and CH4 emission from the FSM indicates that alum is not a suitable amendment to reduce emissions from beef feedlot surfaces.

Table 1. pH, ammonia (NH3), hydrogen sulfide (H2S), methane (CH4), carbon dioxide (CO2) and nitrous oxide (N2O) emission from feedlot surface material treated with 0 or 10% alum (g g-1 mass basis).
pH NH3
(mg m-2 min-1)
H2S
(mg m-2 min-1)
CH4
(mg m-2 min-1)
CO2
(mg m-2 min-1)
N2O
(mg m-2 min-1)
Day 0% Alum 10% Alum 0% Alum 10% Alum 0% Alum 10% Alum 0% Alum 10% Alum 0% Alum 10% Alum 0% Alum 10% Alum
-1 8.1 8.3 229.6d 515.9c 0.3 0.4 136.3 x 73.4w 4,542 3,234 3.1 4.2
0 8.3a 4.8b 163.0c 32.4d 0.2 f 1.8 e 43.1 x 193.8w 4,372 5,294 2.9 1.8
5 8.5a 6.3b 279.5c 83.6d 0.4 0.5 84.1 x 309.5w 404y 1,347z 6.0 6.8
7 8.6a 6.7b 120.2 130.0 0.6 f 1.2e 53.4 61.7 468 y 1,903z 15.3 10.9
12 8.6a 7.2b 418.0 320.3 0.3 0.3 104.5 145.7 3,742y 1,939z 3.3 8.0
14 8.9a 7.6b 229.0 145.5 0.2 0.4 25.4x 180.7w 4,203y 2,018z 11.5 9.3
19 8.6a 7.5b 228.0 225.1 0.1 f 1.1e 132.3x 254.7w 5,999y 3,116z 6.9 5.8
21 8.4a 7.2b 232.0 257.0 0.5 0.8 81.9x 250.0w 4,324y 2,477z 2.2 1.9
26 8.6a 8.0b 584.5c 319.9d 0.1f 0.7e 72.2 92.9 5,534y 3,540z 4.7 2.9
Within a parameter and day, different superscripts indicate a significant difference (p < 0.05) between the emissions from the feedlot surface material treated with 0% and 10% alum.

Future Plans

Future research will evaluate the use of aluminum chloride instead of aluminum sulfate to lower pH of FSM and retain nitrogen. Additionally, microbial amendments are being evaluated to determine if they can reduce gaseous emissions from the feedlot surface.

Authors

Presenting author

Mindy J. Spiehs, Research Animal Scientists, USDA ARS Meat Animal Research Center

Corresponding author

Bryan L. Woodbury, Agricultural Engineer, USDA ARS Meat Animal Research Center

Corresponding author email address

bryan.woodbury@usda.gov

Additional Information

For additional information about the use of alum as a feedlot surface amendment, readers are direct to the following: Effects of using aluminum sulfate (alum) as a surface amendment in beef cattle feedlots on ammonia and sulfide emissions. 2022. Sustainability 14(4): 1984 – 2004. https://doi.org/10.3390/su14041984

Acknowledgements

The authors wish to acknowledge USMARC technicians Alan Kruger and Jessie Clark for their assistance with data collection and analysis.


The authors are solely responsible for the content of these proceedings. The technical information does not necessarily reflect the official position of the sponsoring agencies or institutions represented by planning committee members, and inclusion and distribution herein does not constitute an endorsement of views expressed by the same. Printed materials included herein are not refereed publications. Citations should appear as follows. EXAMPLE: Authors. 2022. Title of presentation. Waste to Worth. Oregon, OH. April 18-22, 2022. URL of this page. Accessed on: today’s date.

Production of Greenhouse Gases, Ammonia, Hydrogen Sulfide, and Odorous Volatile Organic Compounds from Manure of Beef Feedlot Cattle Implanted with Anabolic Steroids

Animal production is part of a larger agricultural nutrient recycling system that includes soil, water, plants, animals and livestock excreta. When inefficient storage or utilization of nutrients occurs, parts of this cycle become overloaded. The U.S. Beef industry has made great strides in improving production efficiency with a significant emphasis on improving feed efficiency. Improved feed efficiency results in fewer excreted nutrients and volatile organic compounds (VOC) that impair environmental quality. Anabolic steroids are used to improve nutrient feed efficiency which increases nitrogen retention and reduces nitrogen excretion. This study was conducted to determine the methane (CH4), carbon dioxide (CO2), nitrous oxide (N2O), odorous VOCs, ammonia (NH3), and hydrogen sulfide (H2S) production from beef cattle manure and urine when aggressive steroid implants strategies were used instead of moderate implant strategies.

What Did We Do?

Two groups of beef steers (60 animals per group) were implanted using two levels of implants (moderate or aggressive). This was replicated three times, twice with spring-born calves and once with fall-born calves, for a total of 360 animals used during the study. Both moderate and aggressive treatment groups received the same initial implant that contain 80 mg trenbolone acetate and 16 mg estradiol. At second implant, steers in the moderate group received an implant that contained 120 mg trenbolone acetate and 24 mg estradiol, while those in the aggressive group received an implant that contained 200 mg trenbolone acetate and 20 mg estradiol. Urine and feces samples were collected individually from 60 animals that received a moderate implant and 60 animals that received an aggressive implant at each of three sampling dates (Spring and Fall 2017 and Spring 2018). Within each treatment, fresh urine and feces from five animals were mixed together to make a composite sample slurry (2:1 ratio of manure:urine) and placed in a petri dish. There were seven composite mixtures for each treatment at each sampling date. Wind tunnels were used to pull air over the petri dishes. Ammonia, carbon dioxide, and nitrous oxide concentrations were measured using an Innova 1412 Photoacoustic Gas Analyzer. Hydrogen sulfide and methane were measured using a Thermo Fisher Scientific 450i and 55i, respectively. Gas measurements were taken a minimum of six times over 24- to 27-day sampling periods.

What Have We Learned?

Flux of ammonia, hydrogen sulfide, methane, nitrous oxide, and total aromatic volatile organic compounds were significantly lower when an aggressive implant strategy was used compared to a moderate implant strategy. However, the flux of total branched-chained volatile organic compounds from the manure increased when aggressive implants were used compared to moderate implants. Overall, this study suggests that air quality may be improved when an aggressive implant is used in beef feedlot animals.

Table 1. Overall average flux of compounds from manure (urine + feces) from beef feedlot cattle implanted with a moderatea or aggressiveb anabolic steroid.
Hydrogen Sulfide Ammonia Methane Carbon Dioxide Nitrous  Oxide Total Sulfidesc Total SCFAd Total BCFAe Total Aromaticsf
µg m-2 min-1 ——–mg m-2 min-1——–
Moderate 4.0±0.1 2489.7±53.0 117.9±4.0 8795±138 8.6±0.1 0.7±0.1 65.2±6.6 5.9±0.5 2.9±0.3
Aggressive 2.7±0.2 2186.4±46.2 104.0±3.8 8055±101 7.4±0.1 0.8±0.1 63.4±5.7 7.6±0.8 2.1±0.2
P-value 0.01 0.04 0.01 0.01 0.01 0.47 0.83 0.05 0.04
aModerate treatment =  120 mg trenbolone acetate and 24 mg estradiol at second implant; bAggressive treatment = 200 mg trenbolone acetate and 20 mg estradiol at second implant; cTotal sulfides = dimethyldisulfide and dimethyltrisulfide; dTotal straight-chained fatty acids (SCFA) = acetic acid, propionic acid, butyric acid, valeric acid, hexanoic acid, and heptanoic acid;  eTotal branch-chained fatty acids (BCFA) = isobutyric acid and isovaleric acid; fTotal aromatics = phenol, 4-methylphenol, 4-ethylphenol, indole, and skatole

Future Plans
Urine and fecal samples are being evaluated to determine the concentration of steroid residues in the livestock waste and the nutrient content (nitrogen, phosphorus, potassium and sulfur) of the urine and feces.

Authors

mindy.spiehs@ars.usda.gov Mindy J. Spiehs, Research Animal Scientist, USDA ARS Meat Animal Research Center, Clay Center, NE

Bryan L. Woodbury, Agricultural Engineer, USDA ARS Meat Animal Research Center, Clay Center, NE

Kristin E. Hales, Research Animal Scientist, USDA ARS Meat Animal Research Center, Clay Center, NE

Additional Information

Will be included in Proceedings of the 2019 Annual International Meeting of the American Society of Agricultural and Biological Engineers.

USDA is an equal opportunity provider and employer. 

Acknowledgements

The authors wish to thank Alan Kruger, Todd Boman, Bobbi Stromer, Brooke Compton, John Holman, Troy Gramke and the USMARC Cattle Operations Crew for assistance with data collection.

The authors are solely responsible for the content of these proceedings. The technical information does not necessarily reflect the official position of the sponsoring agencies or institutions represented by planning committee members, and inclusion and distribution herein does not constitute an endorsement of views expressed by the same. Printed materials included herein are not refereed publications. Citations should appear as follows. EXAMPLE: Authors. 2019. Title of presentation. Waste to Worth. Minneapolis, MN. April 22-26, 2019. URL of this page. Accessed on: today’s date.

Production of Greenhouse Gases and Odorous Compounds from Manure of Beef Feedlot Cattle Fed Diets With and Without Ionophores

Ionophores are a type of antibiotics that are used in cattle production to shift ruminal fermentation patterns. They do not kill bacteria, but inhibit their ability to function and reproduce. In the cattle rumen, acetate, propionate, and butyrate are the primary volatile fatty acids produced. It is more energetically efficient for the rumen bacteria to produce acetate and use methane as a hydrogen sink rather than propionate. Ionophores inhibit archaea forcing bacteria to produce propionate and butyrate as hydrogen sinks rather than working symbiotically with methanogens to produce methane as a hydrogen sink. Numerous research studies have demonstrated performance advantages when ionophores are fed to beef cattle, but few have considered potential environmental benefits of feeding ionophores. This study was conducted to determine if concentrations of greenhouse gases, odorous volatile organic compounds (VOC), ammonia, and hydrogen sulfide from beef cattle manure could be reduced when an ionophore was fed to finishing cattle.

What Did We Do?

Four pens of feedlot cattle were fed an ionophore (monensin) and four pens received no ionophore (n=30 animals/pen). Samples were collected six times over a two-month period. A minimum of 20 fresh fecal pads were collected from each feedlot pen at each collection. Samples were mixed within pen and a sub-sample was placed in a small wind-tunnel. Duplicate samples for each pen were analyzed. Ammonia, carbon dioxide (CO2), and nitrous oxide (N2O) concentrations were measured using an Innova 1412 Photoacoustic Gas Analyzer. Hydrogen sulfide (H2S) and methane (CH4) were measured using a Thermo Fisher Scientific 450i and 55i, respectively.

What Have We Learned?


Table 1. Overall average concentration of compounds from feces of beef feedlot cattle fed diets with and without monensin.
Hydrogen Sulfide Ammonia Methane Carbon Dioxide Nitrous  Oxide Total Sulfidesa Total  SCFAb Total BCFAc Total Aromaticsd
µg L-1 —————-mg L-1—————-
No Monensin 87.3±2.2 1.0±0.2 4.3±0.1 562.5±2.2 0.4±0.0 233.4±18.3 421.6±81.9 16.8±3.1 83.7±6.4
Monensin 73.9±1.4 1.1±0.2 3.2±0.2 567.1±2.1 0.5±0.0 145.5±10.9 388.9±32.5 20.3±2.3 86.4±5.6
P-value 0.30 0.40 0.01 0.65 0.21 0.01 0.79 0.48 0.75
aTotal sulfides = dimethyldisulfide and dimethyltrisulfide; bTotal straight-chained fatty acids (SCFA) = acetic acid, propionic acid, butyric acid, valeric acid, hexanoic acid, and heptanoic acid;  cTotal branch-chained fatty acids (BCFA) = isobutyric acid and isovaleric acid; dTotal aromatics = phenol, 4-methylphenol, 4-ethylphenol, indole, and skatole

Total CH4 concentration decreased when monensin was fed. Of the VOCs measured, only total sulfide concentration was lower for the manure from cattle fed monensin compared to those not fed monensin. Ammonia, N2O, CO2, H2S, and all other odorous VOC were similar between the cattle fed monensin and those not fed monensin. The results only account for concentration of gases emitted from the manure and do not take into account any urinary contributions, but indicate little reduction in odors and greenhouse gases when monensin was fed to beef finishing cattle.

Future Plans

A study is planned for April – July 2019 to measure odor and gas emissions from manure (urine and feces mixture) from cattle fed with and without monensin. Measurements will also be collected from the feedlot surface of pens with cattle fed with and without monensin.  

Authors

Mindy J. Spiehs, Research Animal Scientist, USDA ARS Meat Animal Research Center, Clay Center, NE

mindy.spiehs@ars.usda.gov

Bryan L. Woodbury, Agricultural Engineer, USDA ARS Meat Animal Research Center, Clay Center, NE

Kristin E. Hales, Research Animal Scientist, USDA ARS Meat Animal Research Center, Clay Center, NE

Additional Information

Dr. Hales also looked at growth performance and E. coli shedding when ionophores were fed to finishing beef cattle. This work is published in Journal of Animal Science.

Hales, K.E., Wells, J., Berry, E.D., Kalchayanand, N., Bono, J.L., Kim, M.S. 2017. The effects of monensin in diets fed to finishing beef steers and heifers on growth performance and fecal shedding of Escherichia coli O157:H7. Journal of Animal Science. 95(8):3738-3744. https://pubmed.ncbi.nlm.nih.gov/28805884/.

USDA is an equal opportunity provider and employer.

Acknowledgements

The authors wish to thank Alan Kruger, Todd Boman, and the USMARC Cattle Operations Crew for assistance with data collection.

The authors are solely responsible for the content of these proceedings. The technical information does not necessarily reflect the official position of the sponsoring agencies or institutions represented by planning committee members, and inclusion and distribution herein does not constitute an endorsement of views expressed by the same. Printed materials included herein are not refereed publications. Citations should appear as follows. EXAMPLE: Authors. 2019. Title of presentation. Waste to Worth. Minneapolis, MN. April 22-26, 2019. URL of this page. Accessed on: today’s date.

Aeration to Improve Biogas Production by Recalcitrant Feedstock

Proceedings Home W2W Home w2w17 logo

Purpose

Why aerate biogas digesters?

Most agricultural waste is largely composed of polymers such as lignin and complex carbohydrates that are slowly or nearly completely non-degradable in anaerobic environments. An example of such a waste is chicken litter in which wood chips, rice hulls, straw and sawdust are commonly employed bedding materials.  This makes chicken litter a poor candidate for anaerobic digestion because of inherently poor digestibility and, as a consequence, low gas production rates.

Previous studies, however, have shown that the addition of small amounts of air to anaerobic digestates can improve degradation rates and gas production. These studies were largely performed at laboratory-scale with no provision to keep the added air within the anaerobic sludge.

What Did We Do?

Picture of 4 digesters with sprayer tanksFour digesters were constructed out of 55 gallon sprayer tanks. The digestate was 132 L in volume with a dynamic headspace of 76 L. At the bottom of each tank a manifold was constructed from ½” PVC pipe in an “H” configuration and with a volume of approximately 230 mL. The bottom of the manifold had holes drilled in it to allow exchange with the sludge. Tanks were fed 400 g of used top dressing chicken litter (wood shaving bedding) obtained from a local producer (averaging 40% moisture and 15% ash) in 2 L of water through a port in the tank [labeled “1” in figure]. Two hundred mL of air were fed to the manifold through a flow meter [2] 0, 1, 4, or 10 times daily in 15-minute periods at widely spaced intervals by means of an air pump and rotary timer [4]. A gas port [3] at the top of the tank allowed for sampling and led to a wet tip flow meter (wettipflowmeters.com) to measure gas production. Digestate samples were taken out of a side port [5] for measurement of water quality and dissolved gases and overflow was discharged from the tank by means of a float switch wired in line with a ½” PVC electrically actuated ball valve.

Seven dried and weighed tulip poplar disks were added to each tank at the beginning of the experiment. At the end of the experiment, the disks were cleaned and dried for three days at 105 0C before re-weighing. Dissolved and headspace gases were measured on a gas chromatograph equipped with FID, ECD, and TCD detectors. Water quality was measured by standard APHA methods.

What Have We Learned?

Graph of chemical oxygen demand per liter and graph of liters of biogas per day

Adding 800 mL of air daily increased biogas production by an average of 73.4% compared to strictly anaerobic digestate. While adding 200 mL of air daily slightly increased gas production, adding 2 L per day decreased gas production by 16.7%.

Aerating the sludge improved chemical oxygen demand (COD) with the greatest benefit occurring at 2,000 mL added air per day. As noted, however, this decreased gas production in the control indicating toxicity to the anaerobic sludge.

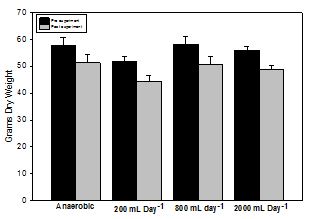
The experiment was stopped after 148 days. When the tanks were opened, there was widespread fungal growth both on the surface of the digestate and the wood disks in the aerated tanks [left], whereas non-aerated tanks showed little evidence of fungal growth [right]. While wood disks subjected to all treatments lost significant mass (t-test, α=0.05), disks in the anaerobic tank lost the least amount of weight on average (6.3 g) while all other treatments lost over 7 g weight on average.

Picture of widespread fungal growth on the surface of the digestate and the wood discs in aerated tanks

Future Plans

Research on other feedstocks and aeration regimes are being conducted as are 16s and 18s community analyses.

Chart of grams dry weight pre experiment and post experiment

Corresponding author (name, title, affiliation)

John Loughrin, Research Chemist, Food Animal Environmental Research Systems, USDA-ARS, 2413 Nashville Rd. B5, Bowling Green, KY 42104

Corresponding author email address

John.loughrin@ars.usda.gov.

Other Authors

Karamat Sistani, Supervisory Soil Scientist, Food Animal Environmental Research Systems. Nanh Lovanh, Environmental Engineer, Food Animal Environmental Research Systems.

Additional Information

https://www.ars.usda.gov/midwest-area/bowling-green-ky/food-animal-envir…

Acknowledgements

We thank Stacy Antle and Mike Bryant (FAESRU) and Zachary Berry (WKU Dept. of Chemistry) for technical assistance.

Greenhouse Gases and Agriculture (Self Study Lesson)

This is a self-guided learning lesson about greenhouse gases (GHG) and their connections to livestock and poultry production. It is useful for self-study and for professionals wishing to submit continuing education credits to a certifying organization. Anticipated time: 60 minutes. At the bottom of the page is a quiz that can be submitted and a score of 7 out of 10 or better will earn a certificate of completion. (Teachers/educators: visit the accompanying GHG curriculum materials page)

Module Topics

  1. Why does climate change?
  2. How does US agriculture to compare to other industries and worldwide agriculture?
  3. What greenhouse gases (GHG) are emitted by livestock and poultry farms?
  4. What are mitigation and adaptation strategies

What is Climate Change?

Download and read “Why Does Climate Change?” (PDF; 8 pages). Includes basics and terminology about natural and man-made drivers of climate change.

US Agriculture Comparisons to Other Industries and Worldwide Agriculture

Watch this short video “Agriculture and Greenhouse Gases: Some Perspective” (5 minutes). This also includes some very good reasons why farmers, ranchers, and ag professionals should care about the topic of climate change, regardless of political stances on solutions.

Greenhouse Gases Emitted by Livestock, Poultry. and Other Agricultural Activities

Watch this short video discussing the most important gases produced through livestock, poultry, and cropping activities on farms and ranches. (8 minutes)

Review the following fact sheet:

Mitigation and Adaptation

Watch this short video “Carbon, Climate Change, and Controversy” by Marshall Sheperd, University of Georgia (4 minutes)

Watch this video on “Mitigation and Adaptation: Connections to Agriculture” (13 minutes)

Quiz

When you have completed the above activities, take this quiz. If you score at least 7 of 10 correct, you will receive a certificate of completion via email. If you are a member of an organization that requires continuing education units (CEUs), we recommend that you submit your certificate to them for consideration as a self-study credit (each individual organization usually has a certification board that decides which lessons are acceptable). Go to quiz….

American Registry of Professional Animal Scientist (ARPAS) members can self-report their completion of this module at the ARPAS website.

Acknowledgements

Author: Jill Heemstra, University of Nebraska-Lincoln

Building Environmental Leaders in Animal Agriculture (BELAA) is a collaborative effort of the National Young Farmers Educational Association, University of Nebraska-Lincoln, and Montana State University. It was funded by the USDA National Institute for Food and Agriculture (NIFA) under award #2009-49400-05871. This project would not be possible without the Livestock and Poultry Environmental Learning Community and the National eXtension Initiative.

Measuring Nitrous Oxide and Methane Emissions from Feedyard Pen Surfaces; Experience with the NFT-NSS Chamber Technique

Why Study Nitrous Oxide and Methane at Cattle Feedyards?

Accurate estimation of greenhouse gas emissions, including nitrous oxide and methane, from open beef cattle feedlots is an increasing concern given the current and potential future reporting requirements for GHG emissions. Research measuring emission fluxes of GHGs from open beef cattle feedlots, however, has been very limited. Soil and environmental scientists have long used various chamber based techniques, particularly non-flow-through – non-steady-state (NFT-NSS) chambers for measuring soil fluxes. Adaptation of this technique to feedyards presents a series of challenges, including spatial variability, presence of animals, chamber base installation issues, gas sample collection and storage, concentration analysis range, and flux calculations.

What did we do? 

Following an extensive review of the literature on measuring emissions from cropping and pasture systems, it was decide to adopt non-flow-through – non-steady-state (NFT-NSS) chambers as the preferred measurement methodology. However, the use of these NFT-NSS chambers had to be adapted for use in conditions of beef cattle feedyards and open corral dairies.

What have we learned? 

Trials of various techniques for sealing the chamber to the manure surface including piling soil/manure around the chamber and various weighted skirts were trial, however no technique was as good at sealing the chamber as a metal ring driven 50-75 mm into the underlying substrate.

Chamber bases could potentially injure animal in the pen and/or animal could disturb the measurement installation, so measurements were only conducted in recently vacated pens.

Gas samples were drawn from a septa in the chamber cap using a 20 ml polyethylene syringe and immediately injected into a 12 ml evacuated exetainer vial for transport, storage and analysis. Trials of alternative vials led to sample loss and contamination issues.

Gas samples were analyzed using a gas chromatograph equipped with ECD, FID and TCD detectors for nitrous oxide, methane and carbon dioxide determination, respectively.

The metal rings or bases must be installed at least 24 and preferably 48 hours before measurements are commenced as the disturbance caused when installing the bases will result in a temporarily enhanced emission flux.

Ten, 20 cm dia chambers constructed from PVC pipe caps are deployed in a pen and yield a reasonable approximation of the average emission fluxes from the pen.

The range of gas concentrations measured in the chamber at the end of a 30 minute deployment was up to 2 orders of magnitude greater than that typically measured in cropping systems research. This required careful choice of calibration gas concentrations and calibration of the gas chromatograph. The response of the ECD detector used for determining N2O concentration may not be linear over the entire range experienced.

The rate of increase in concentration in the chamber is often curvilinear in form and a quadratic approach was adopted for determination of the flux rate.

Future Plans 

On-going studies are quantifying N2O and CH4 flux rates from pen surfaces in a cattle feedlots under varying seasonal conditions; further work is identifying contributing factors.

Authors

Kenneth D. Casey, Associate Professor at Texas A&M AgriLife Research, Amarillo TX kdcasey@ag.tamu.edu

Heidi M. Waldrip, Research Soil Scientist at USDA ARS CPRL, Bushland TX; Richard W. Todd, Research Soil Scientist at USDA ARS CPRL, Bushland TX; and N. Andy Cole, Research Soil Scientist at USDA ARS CPRL, Bushland TX;

Additional information 

For further information, contact Ken Casey, 806-677-5600

Acknowledgements

Research was partially funded from USDA NIFA Special Research Grants

The authors are solely responsible for the content of these proceedings. The technical information does not necessarily reflect the official position of the sponsoring agencies or institutions represented by planning committee members, and inclusion and distribution herein does not constitute an endorsement of views expressed by the same. Printed materials included herein are not refereed publications. Citations should appear as follows. EXAMPLE: Authors. 2015. Title of presentation. Waste to Worth: Spreading Science and Solutions. Seattle, WA. March 31-April 3, 2015. URL of this page. Accessed on: today’s date.

University and Anaerobic Digestion Industry Partnerships – Laboratory Testing

The anaerobic digestion (AD) industry often is in need of laboratory testing to assist them with issues related to project development, digester performance and operation, and co-digestion incorporation. This presentation will highlight laboratory procedures that can be carried out through a University partnership, including biochemical methane productivity (BMP), specific methane activity assays (SMA), anaerobic toxicity assays (ATA), solids, nutrient and elemental proximate analysis for inputs, outputs and co-products, as well as a host of other activities. The presentation will illustrate the lessons that can be learned from the results of these tests, using real-life examples of testing already completed for industry partners.

Why Provide Guidance on Laboratory Testing for Anaerobic Digestion?

Laboratory testing allows characterization of anaerobic digestion (AD) inputs, outputs, and process stability. Testing can be carried out within AD industry laboratories, and they can also be carried out through partnerships with active AD research laboratories at academic institutions. The purpose of this project was to provide a document that summarizes common laboratory procedures that are used to evaluate AD influents, effluents, and process stability and to illustrate real-life examples of laboratory test results.

What did we do? 

The overview of common laboratory procedures was written based on the need to introduce third-party AD developers and government agencies to evaluating AD outputs and process stability. The authors are practiced at performing AD laboratory tests and have expertise and valuable information concerning these types of evaluations. Following a description of each test, we included the purpose of the test and an example of how the test results can be interpreted.

What have we learned? 

Laboratory testing of AD samples is performed to determine the concentration of certain constituents such as organic carbon, volatile fatty acids, ammonia-N, organic-N, phosphorus, and methane. Contaminants can be tested for such as fecal coliform indicator pathogens, pesticides, and pharmaceuticals. Understanding the concentration of specific constituents enables informed decisions to be made about appropriate effluent management.

Biochemical methane potential (BMP) and specific methanogenic activity (SMA) tests are used to estimate the biogas and methane that can be produced from an organic waste or wastewater during AD. These tests are often used by industry during the design phase to predict total biogas output, allowing for correct sizing of engines and estimation of potential revenue.

Anaerobic toxicity assays (ATAs) test the effect of different materials on biogas production. Unknown inhibitors may reside within new feedstock materials which can lead to an unanticipated reduction in digester performance, so it is important to use ATAs to test the effect of new feedstock material on the AD system before it is used. A common example is when energy-rich organic materials are added to a digester that practices co-digestion.

Future Plans 

Future plans are to prepare an extension fact sheet about the basics of anaerobic digestion effluents and processes, including the overview of common laboratory testing used to evaluate AD influents, effluents, and process stability.

Authors

Shannon Mitchell, Post-doctoral Research Associate at Washington State University shannon.mitchell@email.wsu.edu

Jingwei Ma, Post-doctoral Research Associate at Washington State University

Liang Yu, Post-doctoral Research Associate at Washington State University

Quanbao Zhao, Post-doctoral Research Associate at Washington State University

Craig Frear, Assistant Professor at Washington State University

Additional information 

Craig Frear, PhD

Assistant Professor

Center for Sustaining Agriculture and Natural Resources

Department of Biological Systems Engineering

Washington State University

PO Box 646120

Pullman WA 99164-6120

208-413-1180 (cell)

509-335-0194 (office)

cfrear@wsu.edu

www.csanr.wsu.edu

Acknowledgements

This research was supported by funding from USDA National Institute of Food and Agriculture, Contract #2012-6800219814; and by Biomass Research Funds from the WSU Agricultural Research Center.

The authors are solely responsible for the content of these proceedings. The technical information does not necessarily reflect the official position of the sponsoring agencies or institutions represented by planning committee members, and inclusion and distribution herein does not constitute an endorsement of views expressed by the same. Printed materials included herein are not refereed publications. Citations should appear as follows. EXAMPLE: Authors. 2015. Title of presentation. Waste to Worth: Spreading Science and Solutions. Seattle, WA. March 31-April 3, 2015. URL of this page. Accessed on: today’s date.

Impact of Manure Incorporation on Greenhouse Gas Emissions in Semi-Arid Regions


Purpose

Gaseous emissions from animal feeding operations (AFOs) can create adverse impacts ranging from short-term local effects on air quality, to long-term effects due to greenhouse gas generation. This study evaluates gaseous emissions from manure application with differing times to incorporation. The purpose of the study is to identify ways to improve manure management and land application BMPs in semi-arid regions with a high soil pH.

What did we do?

Manure application and incorporation methods were evaluated in a field setting on a soil with high pH. Scraped dairy manure was surface applied at a rate of 50 tons/acre to a Millville silt loam. Incorporation events occurred immediately, 24hrs after application, 72 hrs after application, and no incorporation. Gaseous emissions were monitored using a closed dynamic chamber with a Fourier Transformed Infrared (FTIR) spectroscopy gas analyzer, which is capable of monitoring 15-pre-programmed gases simultaneously including ammonia, carbon dioxide, methane, nitrous oxide, oxides of nitrogen, and volatile organic compounds. Emissions were monitored for 15 days.

What have we learned?

Emissions for methane (CH4) and ammonia (NH3) stopped when the manure was incorporated. For methane, 33% of the emissions occurred within the first 24 hours, 61% within the first 72 hrs. For ammonia, 50% of the emissions occurred within the first 24 hours, 88% within the first 72 hours. Carbon dioxide (CO2) emissions were reduced, but continued at a baseline level after incorporation. Immediate incorporation reduced total CO2 emissions for the 15 days by approximately 50%. Incorporation within 24 hours and 72 hours, reduced total CO2 emissions for the 15 days by 40% and 18%, respectively. Based on this data, incorporation greatly reduces NH3, CH4, and CO2 emissions. Rapid incorporation is needed to have a meaningful impact on NH3 and CH4 emissions. Best management practices should emphasize the need for immediate incorporation.

(Click to enlarge the graphs below).

Cumulative emissions summary: ammonia, carbon dioxide, and methane

Future Plans  

Examine the impact of tannins on gaseous emissions.

Authors   

Rhonda Miller, Ph.D.; Agricultural Systems Technology and Education Dept.; Utah State University rhonda.miller@usu.edu

Pakorn Sutitarnnontr, Ph.D.; South Florida Water Management District; Naples, FL Markus Tuller, Ph.D.; Soil, Water, and Environmental Science Dept.; University of Arizona Jim Walworth, Ph.D.; Soil, Water, and Environmental Science Dept.; University of Ar

Additional Information

Sutitarnnonntr, P., E. Hu, R. Miller, M. Tuller, and S. B. Jones. 2013. Measurement Accuracy of a Multiplexed Portable FTIR- Surface Chamber System for Estimating Gas Emissions. ASABE 2013 Paper and Presentation No. 131620669. St. Joseph, MI: American Society of Agricultural and Biological Engineers.

Website: http://agwastemanagement.usu.edu

Acknowledgements      

The authors gratefully acknowledge support from a USDA-CSREES AFRI Air Quality Program Grant #2010-85112-50524.

The authors are solely responsible for the content of these proceedings. The technical information does not necessarily reflect the official position of the sponsoring agencies or institutions represented by planning committee members, and inclusion and distribution herein does not constitute an endorsement of views expressed by the same. Printed materials included herein are not refereed publications. Citations should appear as follows. EXAMPLE: Authors. 2015. Title of presentation. Waste to Worth: Spreading Science and Solutions. Seattle, WA. March 31-April 3, 2015. URL of this page. Accessed on: today’s date.

Antibiotic Degradation During Anaerobic Digestion and Effects of Antibiotics on Biogas Production


Purpose 

The purpose of this research was to investigate the degradation of four animal husbandry antibiotics during anaerobic digestion (AD) and study biogas inhibition from the antibiotics. This study was designed to fill information gaps related to AD inhibition by different antibiotic classes in diluted manures received by anaerobic digesters, particularly cattle manure, and the need to more thoroughly investigate antibiotic degradation products from the AD process.

What did we do? 

We conducted AD bench-scale experiments that investigated biogas inhibition and antibiotic degradation. First, cattle manure was added to glass bottles. A known amount of antibiotic standard was added to the manure. A small amount of dilution water was added and the manure-antibiotic slurry was mixed briefly. Then, anaerobic digestion inoculum was added to the bottle. The air in the bottle was purged with nitrogen gas. Finally, the bottles were sealed and placed in an incubator set at 37°C. Biogas measurements and small liquid samples for antibiotic analysis were taken daily. At the end of the 40 day AD study, the solids were extracted to determine the amount of antibiotic adsorbed to the solids.

What have we learned? 

Results from our research showed that three out of four antibiotics degraded within 5 days of AD. Several degradation products were detected, some of which could be biologically active. The antibiotic that did not degrade was mostly found in the liquid phase of the AD reactor slurry and a small portion was adsorbed to the solids. Our results suggest that when antibiotic contaminated feedstocks are added to AD reactors, persistent antibiotics and transformation products may contaminate the liquid and solid effluents.

Our results showed the one of the antibiotics tested was more toxic to the AD process. Approximately 6.4-36 mg/L florfenicol lowered biogas production by 5-40%. Greater than 91 mg/L of the other antibiotics was needed to lower biogas production. These higher concentrations can be found in urine and feces of treated animals but they are not typical for the AD reactor following the addition of multiple feedstocks, inoculum, and dilution water. Our results suggest that there is little concern for these antibiotics to lower biogas production when cattle manure is used as an AD feedstock because the antibiotic concentration should be below inhibitory concentrations.

Future Plans 

Future research plans are to investigate the microbial population change in anaerobic digesters due to antibiotic contaminated cattle manure.

Authors

Shannon Mitchell, Post-doctoral Research Associate at Washington State University shannon.mitchell@email.wsu.edu

Craig Frear, Assistant Professor at Washington State University

Additional information 

http://www.ncbi.nlm.nih.gov/pubmed/24113548

Acknowledgements

This research was supported by Biomass Research Funds from the WSU Agricultural Research Center; and by the BioAg (Biologically Intensive Agriculture and Organic Farming) Grant Program of the Washington State University Center for Sustaining Agriculture and Natural Resources.

The authors are solely responsible for the content of these proceedings. The technical information does not necessarily reflect the official position of the sponsoring agencies or institutions represented by planning committee members, and inclusion and distribution herein does not constitute an endorsement of views expressed by the same. Printed materials included herein are not refereed publications. Citations should appear as follows. EXAMPLE: Authors. 2015. Title of presentation. Waste to Worth: Spreading Science and Solutions. Seattle, WA. March 31-April 3, 2015. URL of this page. Accessed on: today’s date.