Assessing the impacts of crop and nutrient management practices on long-term water quality and quantity in a dairy intensive irrigated agricultural region using the SWAT model

Purpose

The dairy industry in Idaho has grown substantially over the past 30 years and is the state’s largest agricultural commodity, accounting for $3.7 billion in sales in 2022. Roughly 500,000 of Idaho’s 660,000 dairy cows reside in a six-county region known as the Magic Valley, a name originating in the early 1900s when large canal irrigation projects turned a dry landscape into verdant farmland. The Magic Valley is semi-arid, receiving around 254 mm of precipitation each year and requiring cropland to be irrigated throughout the growing season. Due to a limited amount of water available for irrigation each season cropland area has not expanded since the 1980s.

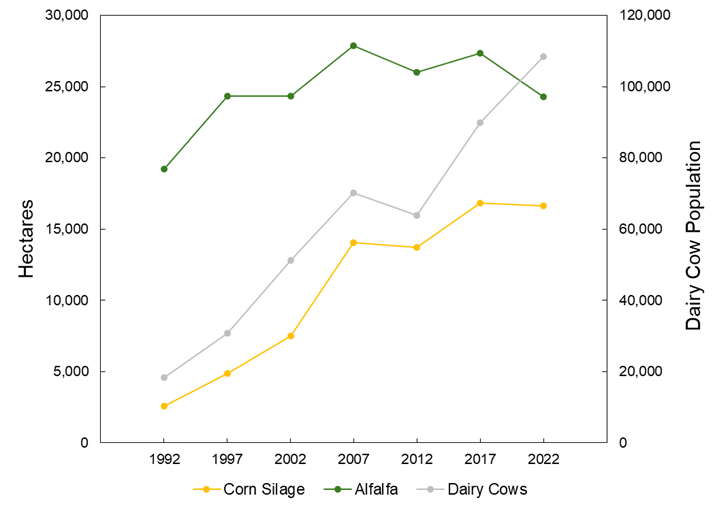
The large number of dairy cows in the Magic Valley has shifted crop production towards forage crops, predominantly silage corn and alfalfa. For example, between 1992 and 2022 the number of dairy cows in Twin Falls County increased from 18,000 to 108,000. During this same timespan corn silage and alfalfa saw a 14,000 and 5,000 hectare increases in land cover, respectively (Figure 1). This change in land cover has potentially increased consumptive water use within the region through the replacement of crops with shorter irrigation seasons (e.g., wheat and beans) with forage crops. In addition to changes in water use, the increase in dairy cattle has resulted in greatly increased manure applications to surrounding fields. It is typical for cropland to receive manure at rates of 52 Mg ha-1 year-1, which can input high amounts of nitrogen and phosphorus beyond what is removed by the crop. Over time, this could result in soil phosphorus enrichment and the leaching of nitrate to groundwater.

Figure 1. Population of dairy cows in Twin Falls County from 1992 to 2022 along with total hectares of corn silage and alfalfa.

What Did We Do?

The study area for this project was the Twin Falls Canal Company, a large irrigation project in southern Idaho. Investigation into potential changes in water quality and quantity brought about by the growing dairy agriculture in southern Idaho was carried out using the Soil and Water Assessment Tool (SWAT) model. SWAT is a physically based geospatial watershed-scale hydrologic model that incorporates climate, topography, soils, land cover, and management practice data. Model scenarios included examining changes in consumptive water use over time, effects of irrigation practices on the leaching of water and nutrients, and the impact of continuous manure applications on the buildup and leaching of nutrients. Nutrient cycling and crop nutrient uptake were calibrated in the model using two USDA-ARS eight-year studies. The first study applied manure under a corn-barley-alfalfa rotation only when soil nutrient concentrations were deficient, and the second study applied manure on a yearly basis in the spring at a rate of 52 Mg ha-1 under a barley-sugar beet-wheat-potato rotation.

Table 1. Crop areas and percentages under the 1992 and 2022 scenarios.

1992 km2 (%) 2022 km2 (%)
Alfalfa 189 (25.3) 244 (32.8)
Barley 104 (13.9) 132 (17.7)
Beans 169 (22.7) 60 (8.0)
Corn Silage 55 (7.4) 191 (25.7)
Potatoes 35 (4.6) 34.5 (4.6)
Sugar Beets 46 (6.2) 26 (3.5)
Wheat 148 (19.8) 57 (7.6)

Table 1. Crop areas and percentages under the 1992 and 2022 scenarios.

Consumptive water use within the Twin Falls Canal Company was compared between two distinct time periods: pre-dairy and present. 1992 was selected as the pre-dairy benchmark due to being before large increases in dairy cattle numbers. Modeled crops were alfalfa, barley, beans, corn silage, potatoes, sugar beets, and wheat, which account for over 95% of irrigated cropland within the TFCC. Land cover in 2022 was used as the present scenario, and crop distributions were altered for the 1992 scenario based on USDA agricultural census data (Table 1). The model was run using climate data from 2002 to 2022 to have consistency between the two scenarios and to allow for year-to-year variability weather patterns. Automatic irrigation routines were used in the model, with a 9.1 mm irrigation event being triggered when soil water content dropped 5 mm below field capacity. 9.1 mm was chosen as the daily irrigation amount because it is roughly equivalent to the flow rate of an 850 gallon per minute center pivot. Irrigation schedules varied by crop within the April 15th – October 31st irrigation season (Table 2).

Table 2. Irrigation seasons for modeled crops.

Irrigation Season
Alfalfa April 15th – October 9th
Barley April 15th – July 25th
Beans June 26th – September 10th
Corn Silage May 25th – September 18th
Potatoes May 15th – September 1st
Sugar Beets April 20th – September 25th
Wheat April 15th – July 16th

What Have We Learned?

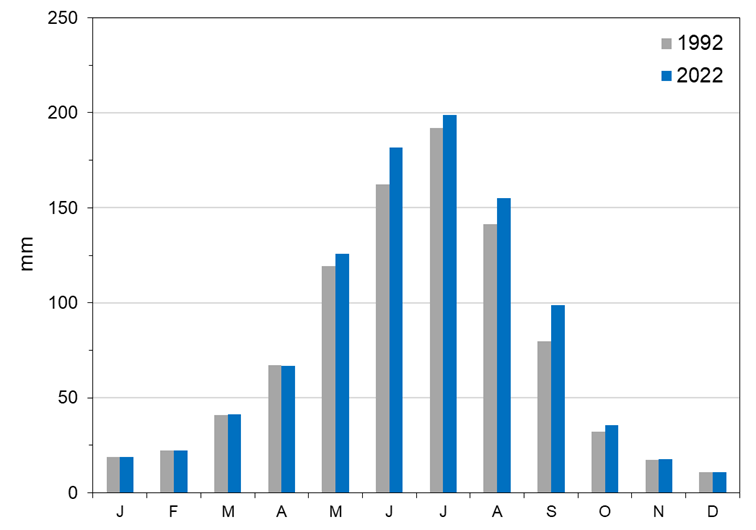
Modeled changes in land use within the Twin Falls Canal Company towards forage crops for dairy cattle have increased consumptive use during the year by 9% on average. June, August and September showed the greatest average increases in evapotranspiration (ET) (Figure 2). Irrigation amounts increased under the 2022 land use scenario for all months except April. Percolation under the 2022 scenario also increased to an average of 155 mm each year, up from 132 mm in the 1992 land use scenario.

Figure 2. Modeled monthly average cropland ET for the pre-dairy (1992) and post-dairy (2022) land cover scenarios.

Typical yearly water diversions for the Twin Falls Canal Company were sufficient to meet the current and future irrigation demand. Diversion reductions in August and September are common depending on reservoir storage and the timing and volume of snowmelt. A shift towards greater cropland area irrigated during those months could require deficit irrigation during extreme drought years, which are likely to become more common given climate change projections indicating reduced snowpack and earlier snowmelt runoff.

SWAT was able to reasonably represent manure nitrification, including the increases in nitrification during the year following sugar beet and potato residue being left on the field (Table 3).  Crop nutrient uptake in the two USDA-ARS studies was also able to be accurately modeled after adjusting nutrient uptake parameters. Modeled soil nitrate and plant-available phosphorus concentrations were similar to field samples. Changes to SWAT source code was necessary to better partition “fast” and “slow” organic nitrogen fractions in manure between the two pools and limit mineralization when the air temperature is below 6 degrees Celsius. Under a manure application rate of 52 Mg ha-1 soil plant-available phosphorus levels exceed the allowed maximum of 40 mg kg-1 in just two years. Applying manure only when needed to satisfy crop nutrient requirements did not result in soil plant-available phosphorus approaching or exceeding the 40 mg kg-1 threshold. In addition to high soil phosphorus levels, nitrogen mineralization from yearly applications of manure resulted in high soil nitrate levels. Modeled percolation using actual irrigation amounts over the eight-year study totaled 1,176 mm and resulted in 1,256 kg ha-1 of leached nitrogen. This highlights the risk that yearly manure applications can have to water quality, especially if water is applied in excess of crop needs when also accounting for soil moisture. In addition, high variability in manure nitrogen and phosphorus concentrations suggests yearly fixed-rate applications are not the ideal for managing nutrient budgets.

Table 3. Yearly and in-season manure nitrogen mineralization from the SWAT model output compared to in-season nitrogen mineralization collected from field samples during the long-term manure study. Asterisks denote years in which sugar beet or potato residue was left on the field, resulting in greater N mineralization the following year.

Year SWAT N Mineralization SWAT In-Season N

Mineralization

Field In-Season Mineralization
kg ha-1 kg ha-1 kg ha-1
2013 211 117 180
2014* 287 192 110
2015 442 308 280
2016* 321 205 190
2017 399 242 250
2018* 297 197 150
2019 393 285 230
2020 357 145 150
Total 2,707 1,690 1,540

Future Plans

Now that the SWAT model has been fully calibrated, the next step will be to test various scenarios in which yearly manure application amounts, crop rotations, and irrigation schedules are adjusted. Typical regional dairy crop rotations include silage corn, alfalfa, wheat, barley, triticale, and occasionally potatoes or sugar beets. Manure is not applied to alfalfa, possibly allowing for a drawdown of phosphorus that has accumulated over previous years. Changing irrigation schedules will alter the timing and quantity of percolated water which will change nutrient export characteristics. Incorporating these scenarios over a large irrigation district with variable soils should identify areas that are more at risk of nutrient losses through runoff or leaching. Results from this research will be used to inform management agencies on the water use and water quality implications of crop rotations, manure applications, and irrigation schedules in southern Idaho.

Authors

Presenting & corresponding author

Galen I. Richards, PhD Candidate, University of Idaho, grichards@uidaho.edu

Additional authors

Erin Brooks, Professor, Department of Soil and Water Systems, University of Idaho

Linda Schott, Assistant Professor and Nutrient & Waste Management Extension Specialist, Department of Soil and Water Systems, University of Idaho

Kossi Nouwakpo, Research Soil Scientist, USDA-ARS Northwest Irrigation and Soils Research Station

Daniel Strawn, Professor, Department of Soil and Water Systems, University of Idaho

Additional Information

https://www.uidahoisaid.com/

Acknowledgements

This research was funded under the University of Idaho Sustainable Agriculture Initiative for Dairy (ISAID) grant USDA-NIFA SAS 2020-69012-31871

I would like to thank USDA-ARS researchers April Leytem, Robert Dungan, and Dave Bjorneberg at the Northwest Irrigation and Soils Research Station in Kimberly, ID for providing me with data from their long-term research studies and general assistance in accurately modeling regional agricultural practices.

The authors are solely responsible for the content of these proceedings. The technical information does not necessarily reflect the official position of the sponsoring agencies or institutions represented by planning committee members, and inclusion and distribution herein does not constitute an endorsement of views expressed by the same. Printed materials included herein are not refereed publications. Citations should appear as follows. EXAMPLE: Authors. 2025. Title of presentation. Waste to Worth. Boise, ID. April 7-11, 2025. URL of this page. Accessed on: today’s date. 

Risk Mapping of Potential Groundwater Contamination from Swine Carcass Leachate Using HYDRUS-1D and GIS

Purpose

The on-farm disposal of swine carcasses poses a potential risk to groundwater quality due to the generation of leachate with nitrate compounds (Koh et al., 2019). This study aims to evaluate the vertical movement of nitrate nitrogen from leachate produced during decomposition of swine carcasses in Nebraska soil types by integrating HYDRUS-1D modeling with GIS-based spatial analysis.

What Did We Do?

Leachate from six on-farm mortality disposal units was gathered during a year-long field study. A soil column study was conducted using the leachate from the field study to evaluate contaminant fate and transport through two common Nebraska soil types – a sandy clay loam and a silty clay.

HYDRUS-1D Model Calibration and Simulation. The model was calibrated using laboratory soil column data; no field-scale observations were used for validation. The objective was to parameterize the model based on controlled experimental conditions and use these simulations to inform spatial risk assessments.

Soil Hydraulic and Solute Transport Parameters. The van Genuchten-Mualem model was chosen to define the soil hydraulic properties for the two soil types used in the columns study, sandy clay loam (SCL) and silty clay (SC). Ten simulations were conducted to develop the HYDRUS-1D model, each run for 365 days, using the mean monthly nitrogen (N lb/ac) generated in leachate during the field study, which was converted into NO₃-N units. The model simulated nitrate leaching in a 10-meter soil column profile using boundary conditions that replicated laboratory leachate transport where the upper boundary represents a constant flux boundary to simulate leachate application based on controlled experimental data and lower boundary represents a free drainage condition representing natural percolation.

Model Calibration. Calibration was performed using inverse modeling within HYDRUS-1D, adjusting key parameters to minimize the sum of squared errors (SSQ) between observed and simulated nitrate concentrations in soil columns at 5 cm, 15 cm, and 25 cm. The results may not fully represent field-scale variability since the model was calibrated only using laboratory data. However, the controlled conditions ensured that parameterization was optimized for subsequent spatial risk assessment using GIS. The sandy clay loam soil strongly correlated with observed and simulated values (R²=0.99). The silty clay soil had a slightly lower R² (0.86). Identical RMSEs of 3.15 for both soil types suggest similar levels of overall deviation from observed concentrations.

The model outputs were exported as time-series CSV data and georeferenced to the study area using ArcGIS Pro. Statewide soil texture data were obtained from the USDA-NRCS soil texture class map (Knoben, 2021) and depth were derived from interpolated data using the Kriging method, based on historical water levels from the UNL Groundwater and Geology Portal (CSD, 2025) respectively. Soil type, groundwater depths, and digital elevation models (DEM) were imported into ArcGIS Pro and processed under the NAD 1983 UTM Zone 14N coordinate system to ensure spatial alignment.

Hydraulic parameters for the ten soil textural classes in Nebraska were defined by the ROSETTA model in HYDRUS-1D and used to model nitrate transport and concentration at 2m soil depth at 1,000 randomly defined locations statewide. Nitrate concentration data at 2 m of soil depth was interpolated using the Kriging tool to create a continuous nitrate concentration data layer. Soil type and groundwater depth data were converted into raster format to enhance the spatial analysis, and a vulnerability assessment was performed using a classification system based on soil permeability, groundwater depth, and nitrate concentrations to produce a spatial representation of groundwater contamination vulnerability (Figure 1).

Figure 1. Distribution of groundwater contamination vulnerability modeled with HYDRUS-1D
Figure 2. Level swine inventory data for Nebraska (Census of Ag, 2022)

Swine population inventories (Figure 2) were obtained from the 2022 USDA Census of Agriculture (IARN, 2025), allowing for comparison of county-level swine populations to groundwater contamination vulnerability.

What Have We Learned?

The HYDRUS-1D model successfully modeled nitrate movement in the soil profile, producing time-series data that matched expected trends based on soil properties and environmental conditions. Counties with the greatest groundwater contamination risk are predominantly located in the western and northern regions of the state due to well-drained soils and shallow depths of groundwater. Very few swine operations are located in these moderate- to high- risk zones, but those that are located in these zones should be aware of the potential for groundwater contamination and should utilize mortality disposal methods that minimize leachate production. Four counties in northeast Nebraska contain moderate swine populations and have moderate to high risks for groundwater contamination. Castro and Schmidt (2023) found that carcass disposal via shallow burial with carbon (SBC) yielded much less leachate – and, subsequently, much lower loads of contaminants to the soil environment – than composting of whole or ground swine carcasses, suggesting that SBC may be a more environmentally conscious disposal method in these counties. Counties having low vulnerability to groundwater contamination cover much of the state’s central and eastern portions where the majority of swine production is located. This study provides critical insights into the risks of groundwater contamination from on-farm swine carcass disposal in Nebraska. Guidance for on-farm disposal of mortalities by all livestock producers should focus on selecting disposal methods that minimize leachate production and contaminant transport potential.

Future Plans:

Outreach efforts will focus on promoting mortality disposal BMPs with a primary focus on selecting disposal methods that minimize leachate production. Field research will be expanded to include evaluation of multiple carbon sources used for on-farm carcass disposal to reduce leachate generation. Future research will focus on enhancing the predictive accuracy of the HYDRUS-1D model by incorporating field-scale validation using observed nitrate concentrations from groundwater monitoring wells in high-risk areas. This validation will improve the reliability of the model’s output and support more precise risk assessments.

Authors:

Presenting Author

Gustavo Castro Garcia, Graduate Extension & Research Assistant, Department of Biological Systems Engineering, University of Nebraska-Lincoln

Corresponding Author

Amy Millmier Schmidt, Professor, Department of Biological Systems Engineering and Department of Animal Science, University of Nebraska-Lincoln, aschmidt@unl.edu

Additional Authors

Mara Zelt, Research Technologist, University of Nebraska-Lincoln

Aaron Daigh, Associate Professor, Department of Biological Systems Engineering and Department of Agronomy & Horticulture, University of Nebraska-Lincoln

Benny Mote, Associate Professor, Department of Animal Science, University of Nebraska-Lincoln

Carolina Córdova, Assistant Professor, Department of Agronomy & Horticulture, University of Nebraska-Lincoln

Acknowledgments

This project was supported by the National Pork Board Award #22-073. The authors wish to recognize Jillian Bailey, Logan Hafer, Alexis Samson, Nafisa Lubna, Andrew Ortiz, and Maria Oviedo Ventura, for their technical assistance during the field and column studies that provided input data for this modeling effort.

Additional Information

Castro, G., and Schmidt, A. (2023). Evaluation of swine carcass disposal through composting and shallow burial with carbon (poster presentation). ASABE AIM. Omaha, NE. July 9 – 12, 2003.

CSD. (2025). UNL Ground Water and Geology Portal: CSD Ground Water and Geology Data Portal. University of Nebraska-Lincoln. Retrieved from: CSD Ground Water and Geology Data Portal.

IANR. (2025). Hogs and pigs, operations with inventory, total operations by county. Nebraska Map Room. Data source: Census of Agriculture, 2022. Retrieved from: https://cares.page.link/Xu1J.

Knoben, W. J. M. (2021). Global USDA-NRCS soil texture class map, HydroShare, https://doi.org/10.4211/hs.1361509511e44adfba814f6950c6e742.

Koh, EH., Kaown, D., Kim, HJ., Lee, KK., Kim, H., and Park, S. (2019). Nationwide groundwater monitoring around infectious-disease-caused livestock mortality burials in Korea: superimposed influence of animal leachate on pre-existing anthropogenic pollution. Environ Int 129:376–388.


The authors are solely responsible for the content of these proceedings. The technical information does not necessarily reflect the official position of the sponsoring agencies or institutions represented by planning committee members, and inclusion and distribution herein does not constitute an endorsement of views expressed by the same. Printed materials included herein are not refereed publications. Citations should appear as follows. EXAMPLE: Authors. 2025. Title of presentation. Waste to Worth. Boise, ID. April 7-11, 2025. URL of this page. Accessed on: today’s date. 


Climate Change Mitigation and Adaptation in Dairy Production Systems of the Great Lakes

Proceedings Home | W2W Home  waste to worth 2017 logo

Purpose

To better understand how dairy agriculture can reduce its impact on climate change, the USDA has supported a large, transdisciplinary research project to examine dairy production systems across the Great Lakes region of the United States. The goals of the Sustainable Dairy Coordinated Agricultural Project are to identify where in the life cycle of a dairy system can beneficial management practices (BMP) be applied to reduce greenhouse gases (GHG) without sacrificing productivity or profit to the farmer. Since 2013, a team of 70 researchers has been collaborating across institutions and disciplines to conduct the investigations.

What did we do?

Experimental data were collected at the cow, barn, manure, crop and soil levels from 2013-2016 by agricultural and life scientists. Modelers continue to conduct comparative analyses of process models at the animal, field and farm scales. Atmospheric scientists have down-scaled global climate models to the Great Lakes region and are integrating climate projections with process modeling results. The Life Cycle Assessment team is evaluating select beneficial management practices to identify where the greatest reduction of greenhouse gases (GHG) may occur. Results of focus groups and farmer surveys in Wisconsin and New York will help us understand how producers currently farm and what types of changes they may be willing to implement, not just to reduce emissions but to adapt to long-term changes in climate.

What have we learned?

Through the Dairy CAP grant, researchers have developed and refined the best ways to measure GHG emissions at the cow, barn, manure, crop and soil levels, and these data are archived through the USDA National Sustainable Dairy LogoAgricultural Library. Results show that the greatest levels of methane produced on a farm come from enteric emissions of the cow and changes in the diet, digestion and genetics of the cow can reduce those emissions. Another significant source of methane—manure production, storage and management—can be substantially reduced through manure management practices, particularly when it is processed through an anaerobic digester. Changes in timing of nitrogen application and use of cover crops practices are found to improve nitrogen efficiency and reduce losses from the field.

A comparative analysis of process models showed multiple differences in their ability to predict GHG emissions and nutrient flow (particularly nitrogen dynamics) at the animal, farm, and field scales. Field data collected were used to calibrate and refine several models. The Life Cycle Assessment approach shows that a combination of BMPs can reduce GHG emissions without sacrificing milk production. The application of down-scaled climate data for the Great Lakes region is being used in conjunction with the suite of BMPs to develop mitigation and adaptation scenarios for dairy farming in the Upper Midwest.

Research findings are shared through a series of fact sheets available on the project website, and a web-based, virtual farm that presents educational materials for 150- and 1500-cow operations to a variety of audiences, ranging from high school students to academics.

Future Plans

The Dairy CAP grant sunsets in 2018, but research questions remain relative to the efficacy of beneficial management practices at different stages in the life cycle of a farm. Challenges revolve around the complexity of farming practices, the individuality of each farm and how it is managed, and uncertainty associated with the predictive capabilities of models. Mitigation and adaptation strategies will be shared with the dairy industry, educators and extension partners who will be responsible for working with farmers at the field level. Implementation of these strategies will make dairy farming in the Great Lakes region more resilient.

Corresponding author, title, and affiliation

Carolyn Betz, Research Project Manager, University of Wisconsin-Madison. Department of Soil Science

Corresponding author email

cbetz@wisc.edu

Other authors

Matt Ruark and Molly Jahn

Additional information

http://www.sustainabledairy.org

http://virtualfarm.psu.edu

Acknowledgements

This material is based upon work that is supported by the National Institute of Food and Agriculture, U.S. Department of Agriculture, under award number 2013-68002-20525.

A Model Comparison of Daily N2O Flux with DayCent, DNDC, and EPIC


Proceedings Home W2W Home w2w17 logo

Purpose 

Process-based models are increasingly used as tools for studying complex agroecosystem interactions and N2O emissions from agricultural fields. The widespread use of these models to conduct research and inform policy benefits from periodic model comparisons that assess the state of agroecosystem modeling and indicate areas for model improvement. The increasingly broad application of models requires an assessment of model performance using datasets that span multiple biogeophysical contexts. While limited in the capacity to identify specific areas for model improvement, general evaluations provide a critical perspective on the use of model estimates to inform policy and also identify necessary model improvements that require further evaluation.

What did we do? 

The objectives of this model comparison were to i) calibrate and validate three process-based models using a large dataset; ii) evaluate the performance of a multi-model ensemble to estimate observed data; and iii) construct a linear model to identify and quantify possible model bias in the estimation of soil N2O flux from agricultural fields. We selected three models that have been used to evaluate N2O emissions from agricultural fields: DayCent, DNDC, and EPIC. Using data from two field experiments over five years, we calibrated and validated each model using observations of soil temperature (n = 887), volumetric soil water content (VSWC) (n = 880), crop yield (n = 67), and soil N2O flux (n = 896). Our model validations and comparisons consisted of commonly conducted statistical evaluations of root mean squared error, correlation, and model efficiency. Additionally, the large sample sizes used here allowed for more robust linear regression models that offered additional insight into relationships between model estimations and observations of N2O flux. We hypothesized that such a linear model would indicate if there was model bias in estimations of soil N2O flux. Ensemble modeling can reduce the error associated with climate projections and has recently been applied to the estimation of N2O flux from agroecosystems. Thus, we also constructed a multi-model ensemble to evaluate the use of multiple models to improve estimates of soil N2O flux.

What have we learned? 

In a comparison of three process-based models, calibration to a large dataset produced favorable estimations of soil temperature, VSWC, average yield, and N2O flux when the models were evaluated using RMSE, R2, and the Nash-Sutcliffe E-statistic. However, an evaluation of linear regression models revealed a consistent bias towards underestimating high-magnitude daily N2O flux and cumulative N2O flux. Observations of soil temperature and VSWC were unable to significantly explain model bias. Calibration to available data did not result in consistent model estimation of additional system properties that contribute to N2O flux, which suggests a need for additional model comparisons that make use of a wide variety of data types. The major contribution of this work has been to identify a potential model bias and future steps required to evaluate its source and improve the simulation of nitrogen cycling in agroecosystems. Process-based models are powerful tools, and it is not our objective to undermine their past and future application. However, more work is left to be done in understanding the biogeophysical system that produces soil N2O and in harmonizing the process-based models that simulate that system and which are used to evaluate management and generate policy.

Future Plans 

Future work should test our findings in additional agroecological contexts to determine the extent to which a bias towards underestimating peak N2O flux persists. A meta-analysis of published data may be the most direct method for doing so. New datasets will need to be collected that represent simultaneous observations of multiple system properties (e.g. soil NO3-, soil NH4+, and heterotrophic respiration) from different soil layers and at increased temporal frequencies. Model developers should use these rich datasets to identify the source of N2O estimation bias and improve the structure and function of process-based models.

Corresponding author, title, and affiliation      

Richard K. Gaillard, Graduate Student, University of Wisconsin-Madison

Corresponding author email    

rgaillard@wisc.edu

Other authors  

Curtis D. Jones, Assistant Research Professor, University of Maryland; Pete Ingraham, Research Scientist, Applied Geosolutions;

Additional information               

sustainabledairy.org

Acknowledgements     

This material is based upon work that is supported by the National Institute of Food and Agriculture, U.S. Department of Agriculture, under award number 2013-68002-20525. Any opinions, findings, conclusions or recommendations expressed in this publication are those of the author(s) and do not necessarily reflect the view of the U.S. Department of Agriculture.

Additional Authors:

Sarah Collier, Research Associate, University of Wisconsin-Madison;

Roberto Cesar Izaurralde, Research Professor, University of Maryland;

William Jokela, Research Scientist (retired), USDA-ARS;

William Osterholz, Research Associate, University of Wisconsin-Madison;

William Salas, President and Chief Scientist, Applied Geosolutions;

Peter Vadas, Research Scientist, USDA-ARS;

Matthew Ruark; Associate Professor; University of Wisconsin-Madison

The authors are solely responsible for the content of these proceedings. The technical information does not necessarily reflect the official position of the sponsoring agencies or institutions represented by planning committee members, and inclusion and distribution herein does not constitute an endorsement of views expressed by the same. Printed materials included herein are not refereed publications. Citations should appear as follows. EXAMPLE: Authors. 2017. Title of presentation. Waste to Worth: Spreading Science and Solutions. Cary, NC. April 18-21, 2017. URL of this page. Accessed on: today’s date.

Are Models Useful for Evaluating or Improving the Environmental Impact of Pork Production?

green stylized pig logo

Models are basically equations that are based on real-world measurements. Measurements are made in different situations and/or different times. Models are used to make comparisons between different choices or look at “what if” scenarios without having to implement each possible option.

Generally, models that are created with large, diverse (but still compatible) data sets containing relevant information are going to be more reliable than models with smaller data sets with smaller data sets. Models can then be used to predict performance or evaluate changes in a system.

There are very good reasons to use models when looking at the environmental footprint of pork production:

  1. Efficiency. It is expensive and impractical to measure actual emissions from every farm or barn.
  2. Decision-making. Models allow farmers and their advisers to look at “what if?”. Prior to making an expensive decision, farmers can evaluate the location, type of building, manure storage, manure treatment, feed ration, etc. and select the best option.
  3. Measure progress trends. Models can be applied at different points in time to see if a farm or industry is making progress in reducing their impacts.

Are there limitations to models?

Yes. By their very nature, models are a simplified representation of a complex system. Modeling is a balance between complexity (how much information does the user need and how much time will it take?) and accuracy (how much is gained by including additional variables?).  The results must be evaluated in their appropriate context. As an example, many TV weather forecasters look at several sources of information, including models when formulating their forecast. While on a given day the forecast may be off (either due to inaccurate analysis or results) it is safe to say that overall, weather forecasting is greatly enhanced by the use of models.

Do you have an example of a model used on pig farms?

One example of a model that is currently looking at the environmental footprint of pork production is the Pork Production Environmental Footprint Calculator.  It currently estimates greenhouse gas (GHG) emissions and the day to day costs of the activities that generate those emissions, but research is underway to expand the model to include land,  and water footprints–leading to a more comprehensive “environmental footprint” model.

The model referenced above can be used for estimating the GHG emissions from the various operations on a pig farm in order to calculate the farm’s cumulative emissions. It shows where the major contributions arise, and provides a test bed for identifying strategies that reduce emissions at least cost. The model requires input information that most producers will know about their operation such as the type of barn, animal throughput, type and quantity of feed ration used, a physical description of the facilities (size of barn, insulation, fans etc.), the time in the barn, temperature profile for that area, type of manure management system (lagoon, dry lot, pit, etc.).  Sample costs for day to day farm activities are provided in the model, but can be updated by the user. The model output includes a summary of feed and energy usage for the simulation, including energy estimates for temperature control (both heating and ventilation) as well as costs.

Authors: Jill Heemstra, University of Nebraska jheemstra@unl.edu and Rick Fields, University of Arkansas rfields@uaex.edu

Reviewers: Dr. Jennie Sheerin Popp, University of Arkansas, Dr. Karl Vandevender, University of Arkansas

For More Information:

Acknowledgements

This information is part of the program “Integrated Resource Management Tool to Mitigate the Carbon Footprint of Swine Produced In the U.S.,” and is supported by Agriculture and Food Research Initiative Competitive Grant no. 2011-68002-30208 from the USDA National Institute of Food and Agriculture. Project website.

Modeling water movement in beef cattle bedded manure pack


Why Examine Moisture Content of a Manure Pack?

Bedded manure is a valuable fertilizer source because it contains essential macronutrients (nitrogen (N), phosphorus (P), and potassium (K)) for crop production. Previous research with beef cattle bedded manure packs demonstrated that water-soluble macronutrients accumulated toward the bottom of the packs with water movement. Thus, predicting water movement in bedded manure helps to estimate nutrient composition throughout the bedded pack. This work presents a development of a process-based model of vertical water movement that considers percolation and diffusion as the main processes of water and vapor movements in bedded manure packs. Evaporation from the top zone to the atmosphere was considered a process of convective mass transfer. The model predicts the change in moisture content of the different zones in the bedded manure and assists in estimating nutrient composition.

cattle loafing on a bed pack in their barnWhy Study Moisture Movement In a Bedded Pack?

Beef cattle producers that raise cattle in complete confinement, such as mono-slope or hoop barns, may apply bedding material to manage moisture and improve the environment for the animals. Some producers let the manure and bedding accumulate to form a bedded manure pack, which is compacted by cattle activity. The bedded manure contains valuable nitrogen (N), phosphorus (P), and potassium (K) that are essential for crop production and soil sustainability. Depending on temperature, bedding material, and storage time of the bedded pack, the concentration of water-soluble N, P and K compounds may increase in the bottom of the bedded pack where water accumulates. Thus, understanding and predicting water movements within the bedded manure is important to estimate fertilizer N-P-K content and distribution in the bedded manure.

What did we do?

The processes considered in this process-based model include evaporation, percolation, diffusion of water vapor and diffusion of liquid water for vertical water movement. The model by Seng et al. (2012) for static compost piles and a modified version of the Integrated Farm System Model (not yet released) by Rotz et al. (2014) for bedded manure were reviewed and compared. Ultimately, the model needs to be adaptable to estimate the water content of the pack over time for different environmental conditions, bedding materials, and storage times at varying depths within the bedded pack. Data for model calibration and validation were gained through laboratory-scale experiments by Ayadi et al. (in review).

What have we learned?

Percolation and liquid water diffusion are considered the main processes for vertical water movement between layers in the bedded manure. Evaporation occurs from the surface of the top zone of the bedded pack. The rates of percolation and liquid water diffusion are depth-specific and their rates therefore vary. The modified version of the Integrated Farm System Model (IFSM) is more adaptable to data gained through laboratory-scale experiments. Overall, IFSM is more applicable to producer-available data and thus more applicable to predict water movement for bedded manure packs in real-life conditions.

Future Plans

After predicting water movements in the bedded manure, the model will be used to estimate N, P and K movement through the different zones of the bedded manure pack as well as gaseous emission (ammonia and nitrous oxide) from the bedded pack surface. The final overall model will be a calculator that estimates fertilizer N-P-K content and value and ammonia and nitrous oxide emissions of the bedded manure packs from confined beef cattle facilities with respect to temperature, bedding material, storage time and depth of the bedded pack.

Authors

Erin Cortus, Ph. D., Assistant Professor, South Dakota State University, Brookings, SD

Ferouz Ayadi, M.S., Graduate Student, South Dakota State University, Brookings, SD; Mindy Spiehs, Ph. D., Animal Scientist, USDA‐ARS Meat Animal Research Center, Clay Center, NE

Additional information

References

Ayadi, F. Y., M. J. Spiehs, E. L. Cortus, and D. N. Miller. In review. Physical, chemical and biological properties of different depths and ages of simulated beef bedded manure packs. Transactions of the ASABE.

Rotz, C.A., Corson, M.S., Chianese, D.S., Montes, F., Hafner, S.D., Bonifacio, H.F., Coiner, C.U., 2013a.

The Integrated Farm System Model Reference Manual, Version 4.1. USDA-Agricultural Research Service. Avaialble at: http://www.ars.usda.gov/sp2UserFiles/Place/80700500/Reference%20Manual.pdf

Seng, B., H. Kaneko, K. Hirayama, and K. Katayama-Hirayama. 2012. Development of water movement model as a module of moisture content simulation in static pile composting. Environmental Technology 33(15):1685-1694.

Acknowledgements

The support and assistance of Henry F. Bonifacio with the simulation of water movements in the bedded pack manure is very much appreciated. This project and all associated reports and support materials were supported by the Sustainable Agriculture Research and Education (SARE) program, which is funded by the U.S. Department of Agriculture- National Institute of Food and Agriculture (USDA-NIFA). Any opinions, findings, conclusions or recommendations expressed within do not necessarily reflect the view of the SARE program or the U.S. Department of Agriculture. USDA is an equal opportunity provider and employer. The mention of trade names or commercial products in this publication is solely for the purpose of providing specific information and does not imply recommendation or endorsement by the USDA.

The authors are solely responsible for the content of these proceedings. The technical information does not necessarily reflect the official position of the sponsoring agencies or institutions represented by planning committee members, and inclusion and distribution herein does not constitute an endorsement of views expressed by the same. Printed materials included herein are not refereed publications. Citations should appear as follows. EXAMPLE: Authors. 2015. Title of presentation. Waste to Worth: Spreading Science and Solutions. Seattle, WA. March 31-April 3, 2015. URL of this page. Accessed on: today’s date.