
 Dr. Greg Thoma, Dr. Richard Ulrich and Dr. Jennie Popp – University of Arkansas, Dr. William Salas and Dr. Chengsheng Li – DNDC Applications, Research and Training
Why Develop Models for Pork Production and Environmental Footprint?
Change in complex systems can occur either systemically, for example by government policy or regulation, or by adoption of new practices by individuals followed by wider adoption where the new practice is effective. This is costly and early adopters incur high risk of failure. This risk can be reduced through good decision support systems to aid in the selection of optimal practices – in effect, with a good model of the system, adoption of management techniques or technology can be tested by simulation before physical implementation.
This is the fundamental utility of models: they provide an inexpensive low risk alternative to experimental trial and error. The swine production model being developed for this project is based on the National Pork Board (NPB) Pig Production Environmental Footprint Calculator written at the University of Arkansas and first released in May 2011.
The National Academy of Sciences reported that EPA methodology should be improved by replacing emission factors with “process-based” models.” The tradeoff is that process-based models are more complex. Our team worked with the National Pork Board to create a process based emission model for swine production to serve as the foundation for a decision support system. This combined emission and cost model, the Pig Production Environmental Footprint Calculator (V2), was released in June 2013, and V3 will be released in Fall, 2015.
This model estimates GHG emissions, water use, land occupation and day-to-day costs from multiple farm operations to identify major contributions and provide a test bed for evaluating potential reduction strategies. The model requires readily available input information such as the type of barn, animal throughput, ration used, the time in the barn, weather for the area, type of manure management system as well as energy and feed prices. The model output includes a summary GHG emissions, water consumption, land occupation and costs by source, of as well as feed and energy usage for the simulation.
 Project Objectives
Integrate process-models of swine production with coupled life cycle assessment (LCA) and economic models to create a decision support tool to identify economical swine production system options which minimize GHG emission and increase sustainability of production systems.
- Improve existing process algorithms to capture effects of barn climate control, feed phases, water distribution, solar insolation, and manure application technology on GHG emissions.
- Expand and improve the user interface, making it more intuitive and user-friendly.
- Expand the feed ingredient list and improve estimations of important feed characteristics needed for the model.
- Develop economic algorithms and compile relevant cost databases to capture the costs of day-to-day activities that entail water use and generate GHGs on farm.
Research Summary: What Have We Done? What Have We Learned?
Scale of the farm and manure systems
The model was converted from barn-level to a farm-level tool by integrating the barns and manure systems together through the model input procedures. In this way the emissions from the various on-farm operations can be compared on the same basis and put into perspective with regard to emission sources. There can be up to ten barns, each with its own associated manure system (subfloor, deep pit and, added in year 4, dry bedding) and 10 separate downstream manure handling systems (lagoon, outside storage and, recently added, a digester). Each barn can have its manure stream routed to any downstream manure system enabling streams to be combined for processing before going to the fields. An algal turn scrubber option can be added as an adjunct to any downstream system.
All of the manure handling systems, both those associated with a barn and those downstream of the barns, were written at the University of Arkansas and all but the digester are process-based. A digester option was added with options for burning the produced methane as barn heat or for producing electricity. Emissions are calculated for the transport of manure to the fields but not for emissions after application.
Growth, performance and amino acid inclusion in rations
The National Research Council (NRC) growth and performance model was integrated into the full farm level model in order to link ration characteristics and growth performance. We have closed the mass balance over the farm for carbon, nitrogen, phosphorous, water and manure solids. Addition of the NRC model also brought in the effects of ractopamine and immunocastration management options.
Testing of the revised growth equations with respect to the effects of individual amino acids (AA) was completed and a manuscript has been partially drafted. A revised equation predicting the effects of heat stress on feed intake was derived and incorporated into the model resulting in much better predictions of these effects than provided by the native NRC equations. Equations describing the impact of heat and cold stress on energy maintenance costs were also constructed, but have yet to be incorporated into the model. These latter 2 efforts were carried out primarily by a postdoctoral student employed on the National Animal Nutrition Program (NRSP-9) with the resulting equations made available to the project. Two manuscripts describing this work have been drafted and will be submitted in Fall, 2015. Finally, a method of deriving model settings to match observed rates of daily gain and feed conversion efficiency was devised and recently passed onto the barn model team for incorporation into the barn model. This will allow the model to be easily calibrated to observed gain and feed efficiency as input by the user.
Weather information
We updated the model weather files from the MERRA database for each of the 3102 counties in the U.S. These files have, in addition to temperature and humidity, other useful information such as precipitation, solar insolation, subsurface temperatures at various depths, and snow cover. The additional MERRA information facilitated addition of a solar panel option and will be used to estimate rainwater contribution to outside manure handling facilities and of solar insolation on inside barn temperatures.
|
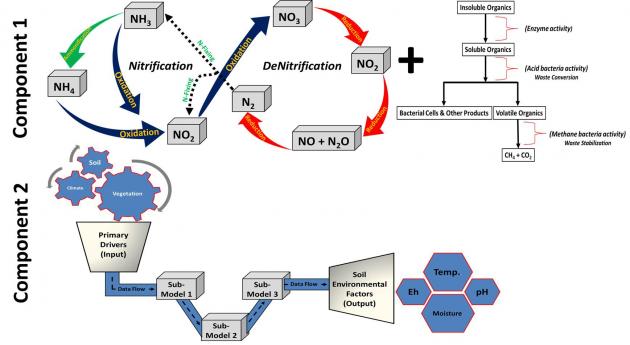
What Is the DNDC Model? The DNDC (DeNitrification and DeComposition) model was developed for quantifying N2O emissions from agricultural soils in the late 1980s (US EPA, 1995). By including fundamental bio-geochemical processes of carbon and nitrogen transformations, DNDC was extended to model soil C sequestration and other trace gases (e.g., methane, nitric oxide, ammonia etc.) in the early 1990s. DNDC consists of two components. The first component entails three sub-models and converts primary drivers (i.e., climate, soil, vegetation and anthropogenic activity) to soil environmental factors (i.e., temperature, moisture, pH, Eh and substrate concentration gradient). The second component consists of nitrification, denitrification and fermentation sub-models; and simulates production/consumption of N2O, NO, N2, NH3 and CH4 driven by the modeled soil environmental conditions [see graphic below]. With the bio-geochemical reactions embedded in the model framework, DNDC can predict the turnover of soil organic matter and the consequent trace gas emissions and nitrate leaching losses. |
Feed ingredients
With input from industry and academic experts, our feed ingredient database was revised to better capture the expected range of ingredients typically available to producers in the US. Carbon, water and land footprint data as well as nutritional characteristics for the NRC growth equations were compiled for each feed ingredient. Economic models, that estimate the cost of feed, manure handling, utilities (water, electricity, gas, propane and diesel), dead animal disposal and immunocastration were integrated into the model. Capital costs are not considered. We are conducting cost benefit analyses on combinations of operations, manure management and dietary feeding systems aimed at reducing GHG emissions. These will help identify incentives to minimize mitigation strategy cost. Routines have been developed that will allow the user to download a set of updated prices for utilities and major feed ingredients.
DeNitrification and DeComposition (DNDC) Model (Soil)
The DeNitrification and DeComposition (DNDC) model requires numerous weather and site inputs, many of which are output from the environmental calculator, and others which require site-specific geographical characteristics (e.g., soil type). We analyzed the agricultural area of each continental-US county using agricultural classes from the 2013 NASS Cropland Data Layer. For each county, we assigned the mean latitude/longitude of all agricultural pixels as the agriculture-weighted centroid from which representative weather data will be extracted.
County soils data are derived from the NRCS General Soils Map (STATSGO). We derived the spatial intersection of STATSGO soil polygons with county boundaries. We summarized top soil data for each soil polygon from 0 to 10cm depth for clay fraction (a proxy for soil texture), bulk density, organic matter fraction (to estimate soil organic carbon, SOC), and pH. Modeled results will be based on either the comprehensive set of soil polygon attributes or a representative distribution of soil attributes for each county (depending on timing and available computing power).
Summary
The model will enable the user to find hot spots in their emissions profile, evaluate the effects of operational changes, and estimate the emissions from facilities during the design stage. The further addition of an operational economic model will provide the ability to perform cost/benefit analyses of practices that can change impact GHG emissions (see video).
Work will continue on this project through Spring, 2016.
Figure 1. Diagram of the DeNitrification and DeComposition (DNDC) model
Why Does This Matter?
The environmental footprint model, with improved algorithms for manure management, economics, and animal performance provide high resolution and flexible decision support for the swine industry. The model enables users to identify hot spots in their emissions and water/land use profiles, evaluate the effects of operational changes, and estimate the emissions from facilities during the design stage. The further addition of an operational economic model enables cost/benefit analyses.
These enhancements support evaluations of dietary energy, protein, and amino acid content for much of the life cycle and immunocastration and the use of ractopamine during the growth cycle. They also allow assessment of the performance, economic, and environmental impact of transient health events during the growth cycle with respect to whole farm operation.
For More Information
- Related Research Projects
- [archived webinar] Life Cycle Assessment Modeling for the Pork Industry – More… (July, 2012)
- [archived webinar] Producer Association Efforts to Address Carbon Footprint (Pork and Poultry) – More… (June, 2012)
Contact Information
Dr. Greg Thoma
gthoma@uark.edu
Phone: (479) 575-7374
Dr. Richard Ulrich
(retired)
Dr. Jennie Popp
jhpopp@uark.edu
Phone: (479) 575-2279
Dr. William Salas
wsalas@dndc-art.com
Phone: (603) 292-5747
Dr. Chengsheng Li
cli@dndc-art.com
Phone: (603) 862-1771
Acknowledgements
This information is part of the program “Integrated Resource Management Tool to Mitigate the Carbon Footprint of Swine Produced In the U.S.,” and is supported by Agriculture and Food Research Initiative Competitive Grant no. 2011-68002-30208 from the USDA National Institute of Food and Agriculture. Project website: https://lpelc.org/integrated-resource-management-tool-to-mitigate-the-carbon-footprint-of-swine-produced-in-the-united-states/.